What happened in production?! Instrumenting with OpenTelemetry
Acknowledgment of Country and Talk Overview
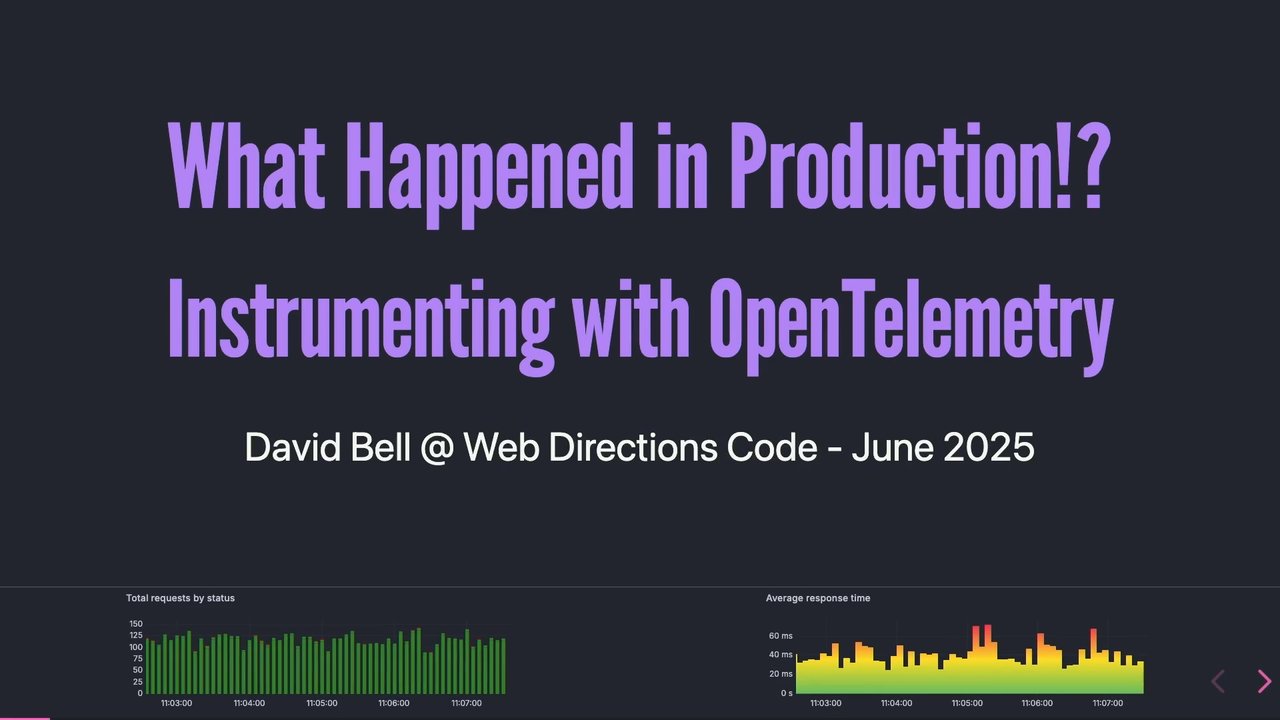
The speaker opens with a formal Acknowledgment of Country, paying respects to the Wurundjeri and Wathaurong peoples as traditional custodians of their respective lands and acknowledging First Nations sovereignty. He then outlines the session's agenda: following a fictional production incident to explore observability concepts, the three pillars theory, OpenTelemetry's fine print, and practical code examples—framed as an educational exercise rather than anything from his day job.
The Production Incident: MicrolitzeRUs and the Mystery Alert
The speaker introduces the fictional company MicrolitzeRUs and their new client, the Web Directions Attendees Co-op, rolling out an IoT event-sourcing platform fleet. An on-call alert fires mid-presentation, and the speaker walks through what existing monitoring reveals: a clear spike in errors and latency on the metrics dashboard, and logs that provide no actionable detail about a recurring daily incident that had been straining the events backend for some time.
Observability Defined: Ollie, Known Unknowns, and the Metrics Pillar
The speaker introduces Charity Majors and the concept of observability (o11y), defining it as the ability to understand a system's internal state simply by asking questions from outside. He presents the known/unknown framework before examining metrics as the first observability pillar, explaining that their pre-aggregated, fixed-dimension nature limits them to answering predefined questions and reinforcing existing biases—though he notes metrics can always be derived later from richer underlying data sources.
The Logs Pillar: Pitfalls, Structured Logging, and Appropriate Use Cases
The speaker examines logs as the second observability pillar, candidly describing the common reality of inconsistent formats, missing schemas, expensive storage costs, and the need for complex CLI parsing just to extract useful data. He champions structured logging—such as emitting JSON with consistent key-value pairs—as a significant improvement that also enables metric aggregations later, while noting logs remain essential for audit trails and security events where guaranteed, blocking delivery is required.
Tracing's Historical Limitations and the Case for OpenTelemetry
The speaker critiques traditional tracing tools as typically siloed away from metrics and logs, tuned only for bad events, and lacking business context—making it difficult to compare problem traces against a healthy baseline. He pivots to OpenTelemetry as the answer: an open standard maintained by the Cloud Native Computing Foundation with broad language support and powerful auto-instrumentation that provides deep application context, including database query details and external API timing, without requiring custom instrumentation code.
OpenTelemetry Internals: Spans, Attributes, and Distributed Tracing
The speaker explains how OpenTelemetry traces are directed acyclic graphs (DAGs) composed of spans—structured records of work containing names, timing, trace IDs, and rich attributes supplied by both auto-instrumentation and custom business context. He covers how trace context is propagated across polyglot distributed systems via request headers, and introduces high cardinality and high dimensionality as the key properties that make unknown unknowns discoverable, contrasting them with the fixed dimensions of traditional metrics.
Sampling Strategies: Head-Based and Tail-Based Approaches
The speaker addresses OpenTelemetry's non-blocking, best-effort delivery model and explains how sampling makes tracing practical at scale without risking the system failures it is meant to diagnose. He contrasts head-based sampling—deterministic, low-overhead, and proportional—with tail-based sampling, which applies rules after trace completion to prioritise errors and unexpectedly slow requests, recommending newcomers start simple with head-based sampling and tune their approach as their understanding of span volumes matures.
Getting Started: Node.js Setup, Browser Instrumentation, and Core Web Vitals
The speaker walks through the minimal steps to enable zero-code auto-instrumentation for Node.js and browser environments, pointing to the official OpenTelemetry documentation as the best reference for a JavaScript and TypeScript audience. He highlights emerging community and vendor work—particularly Honeycomb's open-source web instrumentation package—that brings Core Web Vitals including LCP, CLS, INP, FCP, and TTFB into OpenTelemetry from real users, providing richer performance data than synthetic monitoring or developer machines alone can offer.
Live Demo: Identifying the Root Cause with OpenTelemetry
The speaker demonstrates a live Honeycomb query against real tracing data from the fictional incident, exploring span attributes and waterfall views of individual requests. By comparing attributes across erroring and successful request spans, he quickly surfaces that customer ID 60 has never had a single successful request; drilling into their traces reveals a database table scan caused by a poor query plan unique to newer customers with fewer rows—an unknown unknown entirely invisible to their previous tooling, and the resolution of the long-running incident.
I prepared this talk at my home about 60 kilometers to our southwest near Wediuang, an aboriginal stone arrangement thought to be the world's oldest astronomical observatory on the lands of the Wathaurong people. The Wurundjeri and Wathaurong people are the traditional owners and custodians of these land respective lands and have been for millennia. And just as we are coming today to share knowledge and stories, Wurundjeri and Wathaurong people along with other members of the Kulin nation tribes came together too.
I wish to fair my respects to elders past, present, and emerging, and acknowledge the continuing connection to land, waters, sky, and culture of Aboriginal and Torres Strait Islander peoples across Australia. I also extend that respect to all First Nations people joining us today, either in person or remotely via livestream. Aboriginal and Torres Strait Islander sovereignty was never ceded.
This always was, always will be aboriginal land. Yes. We are here today to find out what happened in production and how we can use OpenTelemetry to solve it. Today, we're going to follow the story of a mysterious long running incident. I'll introduce you to Ollie and the concepts of knowns and unknowns. I'll subject you to my take on the apocryphal three pillars of observability. There's a chunk of theory crafting on OpenTelemetry and we'll come off some cover some of its fine print.
I'll point you with some example code and documentation so you can try this at home. And with any luck, we'll resolve our incident, hopefully. This is a work of fiction. This isn't a presentation about anything at my current day job. This isn't the don't get fired challenge 2025.
As a result, the example is also a bit contrived, but hopefully still a bit of fun. We are MicrolitzeRUs. We're purveyors of fine event sourced Internet of Things microservice backed architectures. And we've just finished a trial with our latest new big client. And I hope you don't mind that I'm on call for them here today.
We should be fine. These systems are rock solid. Yes. We've just snagged a contract with web directions attendees co op. And that's you. They've just finished a lengthy trial with a single device and loved it. So they're rolling out to a section of their entire fleet.
I'll give you a quick rundown on the the service you're taking up. You're an IOT device and you're using an event sourcing model. Yes.
Something is broken. Let me acknowledge that one so it doesn't keep making noise. Weirdest thing ever, turning your phone off silent to do a presentation. Well, we can see from the metrics on the screen, they don't look happy. Something clearly happened in production. We can see a big old spike of errors.
The response time went up massively, like twenty seconds. We can see something went wrong, but it doesn't really tell us much more. What about the logs? It's all going great until it's not. And there's nothing particularly useful about what went wrong here.
Well, I guess we just haven't hit whatever this is to have added a log message for it happening, let alone any details about what's being requested. MicroLitsRUs went on like this for quite a while. Every day at around the same time, events back end would strain under the load, sometimes recovering quickly with barely an increase in latency, other times totally locking the database requiring a lengthy crash recovery.
I myself spent many hours trying my luck as an amateur database administrator, convinced more disk or memory might save us. No. But we were trialing a new approach and a new tool, observability and OpenTelemetry. Had already added to some platform team owned systems to great success, but there hadn't been much movement in convincing product owning teams. After all, their systems were clearly quite happily working in production.
Our synthetic monitoring told us so. Sound like a familiar story? We'll return to our story after a little bit of theory. You know, the actual technical stuff you probably came here for. First, let's get you introduced. Who or what is Ollie? Charity Mages is my personal idol in the observability space.
She introduced the term observability, often written as o 11 y and pronounced Ollie in the style of Kubernetes being k h s or kates. Charity paraphrased mechanical engineering and control theory to position observability as the ability to understand what is happening inside the system, any internal state, simply by asking questions.
Which brings us to needing to better understand and label what we know and don't know. Some of you may already be familiar with this sort of table in the concept of known knowns and unknown unknowns. Knowledge is what we already know about our systems. These are hard facts we collectively know or think we do. Awareness is what our current or previous practices might be able to tell us about the state of our systems.
We're aware of things we ask about. Request volumes, average times, CPU usage, codeword vitals, someone. Right? We all have biases. It's important in any context to identify them, be aware of them, and challenge them. Ignorance feels a bit harsh.
Opportunity feels a bit corporate. Interesting stuff. Teach me something new. The observability industry is obsessed with the notion of observability having three pillars. Metrics, logs and traces. Conventional wisdom is that you need all three and that if you get the balance just right, you'll reach some sort of state of SRE enlightenment. So let's start with the first of the three pillars, metrics. Can you count on them?
Maybe that should be meh tricks. But we all know them and are familiar with them. Minimums, averages, maximums, sums, maybe an exotic percentile measurement. Our cloud infrastructure loves to spit them out, and they know what they're doing, so it must be the way. Yes, but also no. They're pre aggregated. That means they're bundled together in increments and presented as an average or a percentile, and maybe have a very limited number of dimensions. Therefore, they can only answer predefined questions that fit those aggregations and those dimensions.
They have no connective tissue between individual metric points. Each is just a single data point. It can tell you something like the average latency over this minute was five hundred milliseconds. But with some really really fast and some really really really slow, sure a couple of minimum and maximum metrics might give you that. But you can't tie that together with any other metric, such as error rates. You can only ever know those ranges independently.
You can't drill down on a metric. Yes. The load balancer returned a thousand HTTP 500 errors, but what were the parts associated with each? I mean, I guess we'll have to go check the locks to find out. But they aren't totally without use. We can answer questions we know about such as how many errors were returned or how quickly a message might be leaving a queue.
We can draw some pretty graphs on dash boards and make inferences about the shapes of lines. We humans are great at picking out visual patterns even when they're not really there. We can draw a line on that graph and wake someone up if the metric crosses the line. We can report on things like daily volumes because management love a summary. They're great for things we have knowledge or awareness of, but they fit and feed our bias and tell us nothing about the interesting unknown unknowns. But we can make them up from other richer data sources deriving the aggregations we need from those other data sources.
We don't need to keep a counter of the number of requests or time series of average response times if you're already recording those data points alongside each individual request in a log or a trace, for example. We can create the aggregations later tailored to the questions we want to ask, and then be able to ask new questions of them. What about logs?
We said we need to check those to see what endpoints were causing the thousand h t p 500 errors. They're often either boilerplate logs from the framework we're building on in some bespoke format or haphazardly spat out strings. Log it on info. Starting request. Console dot log retrieved 1,000 rows and so on. Some of us will have had the misfortune of having learned the Unix philosophy of text streams as the universal interface.
So we'll be privileged or cursed to be comfortable enough to break out CLI utils like SEID to make sense of those logs. Each of those log lines might have some useful data in them, or they might not. If it's there, you're gonna have to tease it out by hand. You might like to use a tool like sed or orc here to parse the logs.
There are potentially many log lines for each piece of work, if you're lucky. They're tied together with a common identifier which is used in a consistent way across the log lines such as a request ID field prefixed on each log. If you're like me, now you'll break out grep. But there's also often no schema defined or used, so there can be little consistency around field naming or value meanings.
Time to break out the entire GNU toolkit and chuck some of the good Perl Regex in there for good measure. If you have a schema or a structure, it's hard to have an index to make searching efficient. I know I've personally previously downloaded logs to parse locally rather than waiting for the logging platform du jour of previous employers because the thing was just too slow, needing to extract the same fields again and again. Structured logging is fantastic if you can pull it off.
What do I mean by that? As an example, mean, emitting all of your logs as JSON with clear and consistent key value pairs for your fields. And remember, we can always easily create aggregations on structured logs to meet our hunger for metrics later. But all that logging data is expensive, especially for you to process and store the field names on every single one of them as well. I'm sure anyone who's worked somewhere with one of the large incumbent logging platforms knows the pain of either administering that platform or having the administrator coming to tell you to stop logging so much.
Log everything. Find nothing. Die unfulfilled. They too have a place, namely audit logging and security events, Stuff you need to get written down in a way that will block the execution of your app if it can't record the log. When it comes to containerized applications, it's common to output logs on standard out. If you can't output on standard out, something's probably very, very wrong. So you probably you shouldn't or probably even can't process that request. But in general, if you can't log the sign in request, the sign in request shouldn't be happening.
Two pillars down. One to go. Tracing must be the one true pillar then. No? Maybe? Not historically. Not really. It's often kept in a separate tool away from where you're used to seeing your metrics on fixed dashboards and your logs in your expensive logging tool. So you might get an alarm from a metric, such as an error rate or response latency, which gives you a rough time stamp, maybe plus or minus a minute.
You then go look at your logs, which might give you some idea of the methods and endpoints involved, and a more accurate idea of the timing of the problematic requests. If you're lucky, you'll have a tracing tool of some sort at all, and then you might even have a trace from one of those requests. But does it have the business context that's relevant to you? Has it been molded to your use case?
Or does it just tell you what you already know? That you mostly wait on the database and external APIs to return responses? Or in the case of Next. Js, it's just touching every file in the file system. And if it does have those things, my experience has been that it's then typically tuned to only look for bad events, errors, latency, that sort of thing.
But how can you know what's making it a bad trace if you have no baseline data available from the same time? And given it's historically been mostly used to look at bad requests and the purpose of a system is what it does, that's all tracing systems often want to show you, the bad traces. There's limited capability to use the that data in other ways, such as searching across it.
No. We're not here for the sing along of Frozen two. We're here to dig into the interesting stuff going on inside our system, to be able to understand the internal state from outside just by asking questions. So let's take a look at OpenTelemetry. OpenTelemetry, often shortened as OTEL, is a project in open standard which is maintained by the Cloud Native Computing Foundation.
The same folks who look after Kubernetes amongst many other things. This project will fit so many pillars you would not believe it's got you covered on metrics, logs, and traces. It has a wide range of languages supported including Python, Java, JavaScript, Node, and Web, Golang, and Rust, just to name a few. I can't speak for all the supported languages.
The ones I've used, I definitely consider batteries included with auto instrumentation. Auto instrumentation is applied differently depending on the language, but think of it like a set of wrappers or hooks into commonly used libraries and SDKs that provide context about what your application is doing without you having to write a single line of code to it. An example of what that looks like is knowing for free how much time you're spending waiting on a database call without needing to handle the time as yourself, or tease out which database or connection, user normalizing the query, and so on.
They're all just automatically added to the automatically created span as attributes. It's also super simple to get started with. You can often enable it without modifying a single line of your application code just by calling your app via a wrapper or providing an agent. I've previously rolled out order instrumentation to an entire fleet of Java microservices by adding it to the in house Docker base image. It's incredible scaffolding that put in place for building on top of creating incoming and outgoing request spans that we could enrich with our own business context.
Those auto instrumentations also handle propagation of trace context between distributed systems, meaning you can share the same tracing across disparate systems written in multiple languages. Distributed tracing is commonly handled by request headers passing along the identifiers for the trace. The auto instrumentation libraries know how to serialize and deserialize these values and handle injection and retrieval out of those auto instrumented libraries.
There are heaps of vendors that support it, so you can try sending the data to multiple to find out the right fit for you. I'm personally using Honeycomb today, but if they stop keeping pace and they know this or a better player comes along, well, OTL tracing is where it's at. But what is it? How does it work?
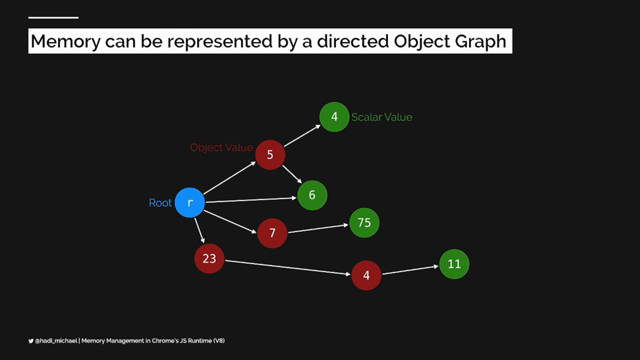
Traces are DAGs, directed acyclic graphs. That is each node can only point to a single other node without any loops, and at the top we've got a node with no pointer elsewhere. The nodes in a DAG are spans. A span represents a chunk of work, a literal span of time. You can think of spans as a fancy structured log.
Big old pile of JSON with some required fields. It's not necessarily actually JSON. A name, a start and end time, and the spans context, its trace ID. The parent span if it has one, and its own ID. That's typically handled by the SDK for you, but you can dive in and do it by hand if you really feel the need. Those fields are referred to as attributes, and your spans can have many, many, many, many attributes.
Some are provided by the order instrumentation. Some you can provide yourself based on your application specific business domain context. Speaking of spans and attributes, we can have both high cardinality and high dimensionality. Cardinality refers to how many values can be assigned to or tracked by a single field across your entire all your spans. A high cardinality field might be conference ticket number or invoice number or seat or height.
A low cardinality field might be attendee species. Did anyone's cat buy a ticket? There were online only tickets available. Dimensionality cuts the other way and is how many attributes a single span might have. The wider you go, the more enriched you make these spans. It'll be the easier it'll be to uncover the unknown unknowns. We can have high dimensionality, meaning we can have almost as many attributes or fields as we like.
There can be a limit. It's up to the platform you're sending to. Honeycomb, for example, accepts no more than 2,000 distinct fields on a single event. But all things in moderation. OTO tracing won't solve all of your problems. Just as with your logs, you shouldn't stick your PII in tracing.
That should really go without saying, and yet, there's also no guarantee on delivery. This is a tool designed to help you when your system is failing. You don't wanna discover that it's the cause of the failure. So it gets itself out of the way when resource resources are contended. The trade off here is between system health, but occasionally missing a trace, or total outages, but aggressively tracking everything.
This means it's no good for those audit and security logs we talked about. Ochel is non blocking, but audit logs, as mentioned, probably should be. But we can lean into the lack of guarantee and build on the fact that we might get a trace for every single request and use sampling to manage our data volumes. We don't need every trace.
Sampling will absolutely do. Just as with getting a blood test, your GP doesn't need to drain your body to check your iron levels. Just a little goes a long way. There's two approaches we can take for tracing, heads or tails. Head based sampling is deterministic based on the trace ID generated before we've done any work. We can configure which what proportion of IDs should be included in our sample set, and that decision is then propagated throughout our system.
For example, we might set a sample rate of 50, and therefore keep one in 50 traces. Very easy to configure without any extra overheads, but it has no regard for what's inside the trace. Every request has the same, in this case, 2% chance of being traced sampled. Tail based sampling is nondeterministic. We don't know which traces or spans we will or won't keep until we look at what's available after they're generated, and make a judgment based on a set of rules applied at the tail end of the trace. For example, we might define a rule to keep traces whenever one or more spans contains an error.
We can also have a rule to keep any traces that take longer than ten seconds because that's unexpectedly slow even if they didn't hit an error. Lastly, we can have a catch all that to keep one in 50 of every other trace. We can pick a sample right here that balance is giving us a good baseline of what hopefully a vast majority of working as expected traces without blowing our tracing data budget.
When you're starting out your OpenTelemetry journey, I recommend keeping it simple. Use head based sampling until you get a handle on your span volumes. You can always tune the sample rate in the event of an incident investigation that requires more data. Yeah. Alright. Sure. Let's take a quick look at how you might implement this and where you can go to learn more.
We're pushed for time, but you can look at the code samples online after. You'll be better served looking at the excellent documentation from OpenTelemetry's website than having me walk through it in great detail. I'm assuming this is a predominantly JavaScript and TypeScript audience. So here's the page on the zero code instrumentation for Node JS. Here's the setup. Install two packages, the API and the s t SDK and some instrument for the API SDK and instrumentation tools, provide some configuration, use the required command line argument to register the auto instrumentation.
That's it. And very quickly, here's what's required for the auto instrumentation on the front end in the browser. Nice big warning banner at the top there. OTIL on the web is still pretty dynamic, and the documentation might not hold your hand as much. Install a few packages. There's obviously other ways to do this. Their example is using parcel.
It's not a requirement. Then define your tracer. This works the same for front end or back end, but there's a different SDK for web. For some reason, at the start of the example, sets up the document load instrumentation, but you can also auto instrument user interactions and Ajax requests, which is quite nice. There's also work being done by vendors like Honeycomb and others in the OpenTelemetry community on getting Core Web Vitals into OpenTelemetry with its own auto instrumentation. This means getting real time Core Web Vitals from all of your users actively using your website and not just your developers on their m four pro plus plus plus super beefy MacBooks with their, you know, two gigabit fiber connections.
Right? This is currently available in Honeycomb's web instrumentation package, which you can either use as is with Honeycomb or not. It's all OTEL under the hood, so it's interoperable with the rest of the OTEL community, or you can go take a look at their implementation because it's all open source. I tried to weigh out the best and quickest visual of something to show what this could do for you and landed on these tables in the documentation.
The whole gang is here. This is the attributes for the instrumentation ads for largest content for paint or LCP. There's an identifier, the timing values, what the lighthouse rating would be for that value, the navigation type that got you there, the URL, and the HTML element associated with the paint. There's a couple more, but they didn't fit on the screen.
Cumulative layout shift is pretty similar, but it's obviously not time based, there's a few differences in the attributes. Same story for interaction to next paint. There's some attributes related to what the interaction is and so on. IMP looks the most detailed to me. I'm not a front end person. There's also first contentful paint and time to first bite.
So like heaps of useful data there to collect from real users. Alright. I've kept you waiting as long as I can. So what happened in prod? Oh, no. It opened the tab on the wrong screen. Live demos, folks. That's great.
Okay. So this is current data. Right? This query just ran. First off, let's take a look at a couple of representations of the tracing data. If we jump down here is this big enough? Do you need me to zoom? We're good? Great. We can see we've got the, you know, trace IDs, parent trace ID, and the span ID.
If I like filter down to one of these, we'll we'll get just that one set of data here that then, you know, we can we can take a look at what the attributes are. Right? Like, can see that there's a heap of attributes available. Each of them have a different set depending on exactly what's being instrumented by this particular span.
If we jump into this, we can look at it represented as a waterfall view. This allows us to see, you know, where we spend our time in this particular request. Right? We can see there's a big chunk calling another API here, licensing service, and there was a big chunk of time running a select on the database. Right? Databases gonna database.
Yeah. So this is a typical healthy request. Right? Like, we're we're pretty happy with that fifty milliseconds that it took or something. Now let's take a look at what went wrong earlier by taking a look at the durations of our route spans. Right? So when the request hit our system. And we'll group these by status code that was returned because we saw there was errors.
Right? So the first thing that jumps out at me is that there's pretty much always these really slow requests. Right? These are taking like a minute, and then they jump up and they go back down again. That's interesting. And when, you know, we look at which ones are 500 errors, oh, we're always getting 500 errors. That's interesting. I didn't see that on the metrics graph.
I thought everything was was great. So we can compare this group to that group, and this will look at all of the attributes across those spans and sort them by the things that are most different first down to the things that are less different or more samey or just, you know, more distributed. So first few, you know, yeah.
All errors were errors. All errors had an exception. Sure. Good. That's good. And then we get to an interesting one that is, you know, our our business context has been added, the customer ID. Our busiest customer, much less represented in the sample of errors.
This guy uh-oh. Never had a success successful one request at all and is the highest, like, contributor to the the error set. So something's going on for customer ID number 60. If we take a look at just their request and we'll grab a trace from a recent one.
Well, looks a bit different. I spent a lot of time waiting on the database and it times out eventually. So we can see here the like database order instrumentation gives us a normalized query. Right? We can grab this query. For the sake of time, I can tell you that it's the same normalized query as a fast request.
The only thing that differs are the inputs. Therefore, we can take all of this Really threw me off that it went on the wrong screen. And we can ask the database what it's doing. So we can check the normalized query and the input values into the database using explain, and it will tell us how our query will be executed. Right?
It tells us the query plan. Well, there's your problem. I don't know much about databases, but you typically wanna avoid a table scan. I could talk for another thirty minutes about this part of the incident alone. You're probably not the audience for this. You're probably falling asleep at this point. I'm very sorry. But the important takeaway here is this.
We had an unknown unknown that newer customers with significantly lower quantity of rows in the database would get a drastically different and incredibly poor performing query plan. Our existing tooling could not get us this answer. Our existing approaches failed us. MicroLiftsRUs may never have solved this entire before entirely rebuilding the system in anger, potentially taking the same missteps again.
We didn't know what we didn't know, and we couldn't ask the right questions to uncover it. That's the power OpenTelemetry gave us, and it is coming to the web front end as well. As I said at the start, this is an incredibly contrived example. I had to do all sorts of things to the database to get this to be a problem reliably, because this talk needed something reliably breakable. Who knew, writing bad systems is difficult?
So I hope you've enjoyed this look into observability and OpenTelemetry, and that you'll be able to give it a go in some of your trickier systems. Check out the OpenTelemetry docs website for those setup docs I shared or for more info about OpenTelemetry generally. Thank you for listening. I hope you've enjoyed my presentation. I'd also really appreciate any feedback you might have.
You can scan the QR code in this Google form with some feedback questions, or you can come heckle me on social media. Thank you.
People
- Charity Majors
Technologies & Tools
- Docker
- Golang
- Internet of Things
- Java
- JavaScript
- Kubernetes
- Lighthouse
- Next.js
- Node.js
- OpenTelemetry
- Parcel
- Python
- Rust
- TypeScript
Standards & Specs
- Core Web Vitals
- Cumulative Layout Shift
- First Contentful Paint
- Interaction to Next Paint
- Largest Contentful Paint
- Time to First Byte
Concepts & Methods
- Directed Acyclic Graph
- Distributed Tracing
- Event Sourcing
- Head-based Sampling
- High Cardinality
- High Dimensionality
- Microservices
- Structured Logging
- Tail-based Sampling
Organisations & Products
- Cloud Native Computing Foundation
- Honeycomb
You could almost set your watch by it: at 2pm each day, the microservice would time out
and crash, the database growing increasingly slow and deadlock prone, and the SLA
perilously close to being breached.
Everything looked “normal” – the logs showed typical requests and responses right up
until it all fell over, the metrics showed the API received more requests at other times
of the day so it wasn’t overwhelmed and had capacity, but something was different.
Was it a noisy neighbour problem on the shared database? Something malicious not caught
by the WAF? Solar flares?
What was going on?!
Join us on a journey into the unknown-unknowns with our guide O11y (pronounced “Ollie”,
short for “Observability”) as we explore:
Observability and its “three pillars”
OpenTelemetry Tracing
Auto- and Manual-Instrumentation
High Cardinality, High Dimensionality, and Sampling
Honeycomb.io’s querying and trace rendering