Opening title So, next up is Hadi Michael.
He's a Melbourne boy, he has been working for quite some time at Deloitte, down here. He's, about literally next week, to head off to Cambridge to do a Master's in Technology Policy over there. So, we're gonna lose him for a while.
Hopefully, we'll get him back at some stage. He thinks really big, hard, and deeply about and does things with JavaScript that very few people have done. He's done face recognition, all sorts of really interesting work in that machine learning, which he'll touch on a bit. And in doing that, he is really pushing the browsers as hard as they can go and learning things from that. And he's here to share some stuff, specifically around garbage collection and memory management in Chrome. But these lessons also are invaluable for working with other browsers as well.
So, to tell us all about that, please welcome Hadi Michael. - Thanks friend! Hello, alright so, my name is Hadi and today I want to talk to you about memory management in V8. Now, V8 is the JavaScript Runtime that powers Chrome and also Node on the server. And what I wanna do in this talk is really prove to you by way of demonstration that understanding memory management in JavaScript is about a whole lot more than just avoiding memory leaks, which is what it's commonly attributed to, right? Understanding the internals of the Runtime that you spend probably the majority of your day with everyday, will make you a better developer.
And I hope that by way of demonstration today, I can prove that to you.
So, for me the story started last year when I was working for a large bank and we were building an app that had to make use of machine learning.
So, we were sitting in an enterprise, architecture, design meeting.
It's a rainy Thursday afternoon in Melbourne and all these enterprise architects are bickering over what version of Java they were gonna use to build this thing.
The only web developer in the room, I put my hand up and I say, "Hey, I reckon I can do this in JavaScript." Silence, and they just laughed at me for a little while. I managed to convince them, "No look, give me a chance, I reckon I can do this." And they said, "Alright fine you can get "two weeks to go away and have a crack." And so I did.
Now, JavaScript's portability made it a really attractive target for what we were trying to do, which was distributed machine learning.
We could write the algorithm once and run it on the server on a bunch of aggregated data. But we could also run it in the browser on the client to preserve user privacy.
So, we could do all the learning and the client and just send the results back.
We could even run it in a Chrome extension and learn from pages that we didn't even own, and still send results back, it was really, really cool. But choosing JavaScripts wasn't without cost. If anyone's tried to do math with JavaScript, probably know what I'm talking about.
But also for machine learning to work, we had to ingest and work with really large amounts of data. And long running computation on large data structures in JavaScripts completely paused the page.
So, users would scroll, we were losing frames, it was jank, we were crashing tabs.
It was just not working and after two weeks of this, JavaScript was not working for me.
And I could hear the data scientists with their R and Python just laughing at me from the other side of the room. I was gonna have a go, right, I solved the math problem. This was just performance optimization.
So, like any performance optimization task, I thought I'd start by building some benchmarks. And then I would try to do some work on the app and see how my application was gonna improve over time. So, I started by teaching the application about sports. This was an application that was gonna classify documents. So, I started collecting documents about sports and I figured eventually, I'd give it a news article and it will tell me what sport that article was talking about. So, I did that and built the benchmark, I was all good to go.
I used Chrome's developer tools to start profiling. So, in my case, I used the timeline view, quite a lot. And I also used the profiles tab to profile the heap and the CPU and other things. So, I built this benchmark, I've started to do some profiling and the results started to come in.
So, the first thing I learned was that learning times, the time it took for me to all my learning, was increasing proportional to the document's word count. And I figured, well that makes sense, right? The more words in the document, the longer it's gonna take for my loop to complete. So, it kinda makes sense.
You know, it was taking 13 seconds for 14 million words that was quite slow, unacceptably slow.
So, I decided next, I'd profile the heap.
So, looking at heap size growth, I notice that the heap size was growing also proportional to the document size.
And I figured, well this also makes sense, right. So, the larger the document that I'm going to feed into memory, the more of the heap I need to use.
But what didn't make sense is, surely this document has some words that repeat. And once I've learnt a word, I don't need to learn it again. So, I expected this to start to taper off after time, and not just keep growing exponentially, as we reached repeated words.
The second thing was, an 85 meg document was causing a 258 meg size heap.
It was like tripling the size of the heap.
And that also didn't quite make sense to me, I said, "There must be something happening that's not my classifier, "that's not code I've written." So, the next step was for me to profile the actual classifier that I wrote.
And I found out the classifier's memory footprint was growing with vocabulary size.
So, I go, great this is kind of in line with what I was thinking.
And this graph's quite powerful because you see in the first three columns as we grow the vocabulary size, the size of the classifier grows with that. And then in the last three columns, when we hold the vocabulary size constant, but grow the size of the document from 100.4 million words to 7 million words to 14 million words, the size of the classifier only grows a little bit. So, huge growth in the heap, but it's not coming from my classifier.
Next step was to profile the heap directly, so I did. So, heap comparison showed that when I ran learn, I would start at about five meg and I'd finish at 258 meg and all that growth was happening in system properties.
Now, system properties are properties that you can't really access from your JavaScript code. They're created by the JavaScript VM as a by-product of other other operations that it's trying to complete. In my case, it was regular expressions during tokenization. So, I had a look at this, okay well, let me see how this is affecting my timeline and why are things so slow? Having a look at the timeline, I noticed that garbage collection operations were running really, really frequently.
So, every little grey bar that you see in the timeline there under the tokenization function is a garbage collection pause.
That is time that the JavaScript execution thread is doing nothing but garbage collection.
13 milliseconds for about an 85 meg file.
In fact, 30% of all processing time was being spent on GC. So, 30% of GC and only 69% on any learning or mathematical operations.
So, again, things weren't quite working for me. V8 was chugging along.
I'm starting to lose hope, but not quite.
But I figure, I kind of know where the problem is, it's in the way I'm managing the heap and there should be a better way to do it.
And this is where my understanding of how memory management in JavaScript works really played to my advantage.
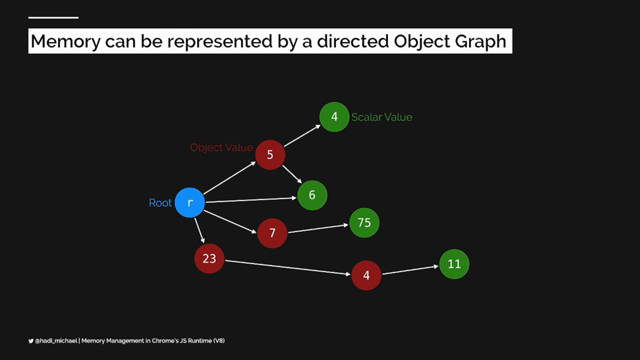
So, let me share with you, what I know about how memory works in JavaScript. So, all JavaScript values are stored on the heap, right? The heap can be represented as an object graph and I often find it easier to think of the heap as a directed object graph.
All objects under heap start from what's called a root object.
Now, the root object is something like the window object. The objects that are created by the browser and destroyed by the browser, you have no say over their life cycle.
Connected to the root object are other types of values, like the object value.
The object value is a container-type value that can hold other potentially object values or scalar values.
And a scalar value is an object that holds something like a JavaScript primitive, so, like a Boolean, or a string, or a number, or so on.
Cool, so every object in your directed graph can have one or more retained paths that connect it to the root.
So, in the case of the green scalar object that you see there, it has a direct retained path that connects it to the root.
And that retain path is essentially how do we reach that object starting at the root? Like I said, it also has an indirect retain path going through an object value as well.
Now, our value can be removed from the directed graph, by cutting its retain path, right? So, we can go and we can cut this retain path here, disconnecting those two objects from the graph. And it's important to understand how retain paths work because they feed into what becomes our definition of garbage.
And in JavaScript, it's quite difficult to know whether a variable that you've declared is gonna be used again in the future.
What we have to do instead when we're trying to assert whether something is garbage or not, is rely on a guarantee from the compiler that any live record will be reachable from the root. Now, with that guarantee, we can assert that garbage is any heap allocated record, any record in our graph that is no longer reachable by any chain of pointers. That is to say, that garbage is all values that no longer have a retain path.
So, in terms of our graph that we've been looking at, that's these two objects here that we just disconnected earlier.
Now, garbage collection is about reclaiming memory that's currently occupied by garbage, so that we can use that space to allocate new records, right? So, garbage collection makes memory available for new object allocations.
So, in the case of our two objects here, it's freeing this bit of memory, so we can use that space in the graph to allocate new functions or new objects.
So, key thing to understand here is that the more objects that there are in the heap, the longer it's gonna take to collect all the garbage. There's just more things to look at.
There's more things to reconcile and to understand. And you can imagine as your heap grows larger and larger, it's gonna become more and more complex to go through and identify garbage and collect it all. So to address this, we work on a hypothesis in garbage collection theory, called the regenerational hypothesis.
And this states that most objects die young. So, once you've created an object, chances are, it's gonna become unused very quickly.
So, you'll create it, you'll use it, and then you'll probably never touch it again. And if you are gonna touch it again, chances are, that object is gonna be quite long-lived. So, to take advantage of this hypothesis, V8 implements what's called a generational collector. And it splits the values in the heap into the young generation and the old generation. The young generation is when you allocate a new object, that's where objects go.
The young generation is the first part of memory that gets used when you allocate a new object. When an object survives a young generation collection, we assume that it's gonna be around for a while. So, that object then gets promoted into the old generation and can be kept there and stick around for a while. The young generation is really small, allocation is fast, collections are fast, and it's collected quite frequently. Whereas the old generation is a lot larger, allocations are still fast, but collection can be a bit slower.
Fortunately for us, it's not meant to be collected as frequently as the young generation.
So, the two generations use different algorithms to go through and identify garbage and collect it. So, I'll start with the young generation.
The young generation uses what's called a semi-space stop and copy scavenger algorithm. And I'll explain that in detail.
So, what we do is we split up the young generation into two semi-spaces, the from semi-space, and the two semi-space.
When you create a new object, you allocate a new object, you allocate it into the from space.
So, we allocate object A into from.
We then go onto allocate object B, object C, object D. So far, so good.
We're just incrementing the pointer and allocating new objects.
Well then, we come along and we try to allocate E and there's not enough room in the semi-space to accommodate E.
At this point, your page is paused.
Everything freezes, everything in the browser stops. And a collection is triggered.
So, during the time that you're allocating objects, chances are, some of them have lost their retain path and are now garbage.
So, what we do is we go through and we walk the transitive closure.
And every time we reach a live object in the graph, we copy it into the to space.
So, in our case, there's two live objects, which are A and C, and as we go through and walk the graph, we copy those into the to space.
Once we finished going through the whole graph, we've copied all of the live objects, the original from space can now be discarded and that piece of memory can be reclaimed.
And eventually made available for new allocations that you might have in the future.
At this stage, the page can resume-- Oh wait, so the to and the from space need to reverse roles and after that, the page can resume and now we can now allocate new objects into what's the new from space.
So, we can allocate object E and everything can continue until eventually you run out of memory again and the whole process repeats.
However, when it repeats, object A and C having survived one garbage collection cycle, are now candidates for promotion into the old generation. Cool, so some key points to remember about the young generation.
The first is that we split the heap into two semi-spaces. The copied space is compacted, it's just an isomorphic copy into a free piece of heap. And compacted mean that it's occupying a contiguous amount of memory, so it's defragmented. Allocation is fast because what we're doing is incrementing a pointer and the cost of the garbage collection is proportional to the number of live objects in the graph. Because we only ever touched live objects.
So, in this case, those could be objects A and C, say, for example.
Cool, so the old generation.
The old generation uses a mark-and-sweep, or mark-sweep compact algorithm.
The amount of memory that's allocated to your application or allocated to your tab for the old generation is governed by a set of heuristics that look at, the rates of object allocation that you're going through and essentially how much memory you're currently using. You're given some piece of live memory, you have a bit of space to grow into and as you grow into the space, you're gonna be given more and more space to keep growing. Just like we did with the young generation, except this time, we have a single space, we allocate objects, in this case, A through to F. And we're allocating new objects, then we come along try to allocate G, not enough space, full garbage collection is triggered.
Okay, cool, so the first stage of an old generation garbage collection is the mark phase.
With the mark phase similar to what we did with the young generation, we go through, we walk the graph and every time we reach a new record or a value in the graph, we flip a reserve bit, called the mark bit.
And that's pretty much saying, "Hey, we're marking this bit "we've reached, this bit is live." So, we go through and we mark objects that are live in the graph.
In this case, B and D can be seen as garbage. The next step is the sweep phase.
Now, with the sweep phase, this time, we start walking through the heap.
So, we start at the first pointer in the heap and we go through the heap and every page in the heap. Every time we reach a page or a record, we look for that reserved mark bit.
If the mark bit is switched, we switch it back and move on.
If the mark bit is not switched, then we assume that piece of memory is garbage and we add it to the free list, so it can be used in future allocations.
So, as we go through here, you'll notice that A and C get flipped, B and D get put on the free list, and then E and F have their mark bits flipped. Cool, so at this point, we're actually ready to start allocating memory again.
If we came and wanted to allocate a new object, we can go to that free list and say, "Hey, do you have an object of this size?" Yep I do, and that's the space and memory that we can use to create new objects.
But you can imagine after doing this for quite a while, your memory will continue to get more and more fragmented. And say you want to allocate a larger object, like object C, for example, there might not be enough space in the heap to allocate that object.
Say, once in a while, we have to go through and do what's called a compaction, or a compact phase. And that's when again you walk through the heap and every time you reach a new object, you copy it back to where the previous object ended, essentially compacting the heap.
So, as you go through, we defrag it, we've got A, C, E, and F all sitting right next to each other and contiguous memory. And we can allocate new objects, new larger objects onto the heap in this case. Perhaps even a promotion from the young generation, so promoting object G, for example.
Cool, so some key points to remember about the old generation.
For starters, you use all the committed heap that's available to you.
The marking phase takes time proportional to the number of Nodes it's gonna mark, which is the number of live objects in your graph. And the sweep and compact phases can take time proportional to the size of the heap.
Again, what's important to remember here is that some of those GC components that we looked at, like mark-and-sweep and compact and stuff, can be made to be more incremental, concurrent, and in some cases, even run in parallel.
And that's something that V8 is looking to take advantage of.
And the V8 team have been working really hard on a project, called Orinoco, which they're bringing out into V8, incrementally to essentially introduce a parallel and concurrent more garbage collector. It's gonna have less jank and higher throughput. So, V8 garbage collection is already quite highly optimized. But Orinoco introduces a few new interesting optimizations. One of them is incremental marking.
So, as you go through your JavaScript execution, you might stop for a scavenge every now and again, which can take up to 10 milliseconds.
You can start to do what's called incremental markings. So go through, walk a bit of the graph, mark a few values and then stop.
Come back, pick up where you left off.
Mark a new few bits and stop.
Until eventually, you reach a mark-sweep compact, or a full garbage collection is triggered, in which case, you'll collect the young and the old generation and do the whole thing, and that can pause your page for 100s of milliseconds.
The beauty of the first optimization's being introduced here is that incremental marking, where it can be done. Second optimization is concurrent sweeping, so where previously, your entire job is get to execution thread had to stop, had to halt, so that a garbage collection could take place. What can happen now is we can halt the thread for a shorter period of time and perform operations like sweeping, unmapping and other things, concurrent to that main thread.
And again, that reduces the amount of time that your application freezes or pauses.
Third optimization is parallel compaction.
Similar to concurrent sweeping, where we would have had to pause the execution thread to run a compaction operation, what we could do now is run those compaction operations in parallel, reducing the amount of time that thread needs to halt for.
Now, those optimizations are really cool and when you combine them with some idle time garbage collection scheduling, which was introduced at I/O, we can start to see some real improvement on large and complex applications.
So, previously what would happen is, your thread would be going along and you might have some idle time at the start, but nothing gets done in that time, and then you're allocating objects, going along and a garbage collection gets triggered. So you go away, you start doing your garbage collection. Your garbage collection holds everything on the thread, you take a really long time and you miss your 60 frames a second performance budget, and you miss a frame, in this case, and that's pretty poor. What the new scheduler can do is, it can come to the garbage collector and say, "Hey, I noticed that I've got some spare time coming up, "would you like to use it?" And the garbage collector can say, "Actually, yes, "I'm gonna do some incremental marking in that time." So, it can use little bits of idle time, hopefully not causing you to have a frame budget blowup and end up missing frames.
So that's pretty cool being able to take advantage of that new scheduling operations that's coming in Chrome.
Point to remember here is that each allocation is gonna move you closer to a collections.
Every time you allocate a new object, you're one step closer to triggering a garbage collection of some kind.
Garbage collections will pause your application and introduce latency in most cases.
The larger the heap, the longer collection is going to take. The longer it's gonna take to walk the graph, do some marking, or do some copying and so on. Sweet, so last time we checked, I had about 45, 44 fold heap growth, 30% of all my processing time was being caused by garbage collection, probably due to that heap growth. And it was taking 13 seconds to complete my learning algorithm.
And that wasn't good, we'd done some profiling. And I kinda figured, well, if the issue is because my heap is growing real quick. What could happen if I read in the document in chunks? So, rather than read in the entire 85 meg in one go, what if I broke it up and I read one chunk at a time, using streams 'cause streams meant that I could stream from the fast system, or from a database, or even over the network.
And therefore, reduce the amount of heap that I need to work with every time I'm trying to do my learning. So, I did that and I noticed a huge reduction in heap size. In fact, I noticed a 96% reduction going from the original 5.8 meg to 11 meg.
And you'll notice that my end heap, almost half of that, is uncommitted space that's available for new allocations. Having a look at performance and time spent learning, this is the same top down approach you saw earlier, it's easier to see the numbers in a bottom up sort. But learning was now up to 94% of the time, up from 69. And garbage collection time was down to 1.87, down from 30%. So now, it's spending the bulk of my CPU time actually doing learning, which is what I wanted at the beginning.
Now, you'll notice that I'm doing a lot more things, and that's because I've got a stream to manage now. But that's okay, 'cause it comes in the advantage of a lot more compute time being spent on doing learning. And you see that here, so the actual time was down by 22%, so down to about 10 seconds from 13 seconds. This wasn't the last optimization I did.
I then went on to do things like, web workers and so on, but had I not known about how memory management works, I would have been tempted to just change my tokenization implementation, or do something a little bit more naive.
But now, by fixing it at the core of the problem, I can write the algorithm, so that any developer can provide their own tokenization function. And it'll work either way, and it will try to use memory as best as it can. So, it's important to remember that understanding memory management in JavaScript is about a whole lot more than just trying to avoid some memory leak, right? Understanding the internals of JavaScript and the Runtime that you work with every day will work to make you a better developer, a better programmer.
It will go to boost your developer productivity as you build applications and try to bake in performance into absolutely everything you do.
That's it for me today, thank you.
(audience applause) - Thanks so much Hadi.
Time for maybe a question for Hadi, while we get Simon set up.
- Garbage collection is fun, yeah.
- No one wants to ask some questions about garbage collection.
I got a question then, if no one else does. So, that approach that you outlined of the way in which GC works, which is relatively new, it's been evolving within Chrome, within Blink, how is that similar or different to, say, WebKit, JS Core and Mozilla's browsers.
- You're right.
Obviously, I chose to work on V8 because we were doing stuff on Node in the back end and Chrome in the browser and Chrome extensions and stuff. I know that SpiderMonkey, up until July of last year, weren't doing compactions.
So, the short answer is to say that most browsers are using some variation of mark-sweep or mark-sweep compact.
SpiderMonkey, up until July of last year, were doing just the mark-and-sweep, and they were having fragmentation problems over time, so they introduced compaction. They can also do incremental marking.
I didn't know too much about what JS Core was doing, but then talking to Yoav, when I had a look at the source code, it looks like they're also using a mark-sweep implementation.
They're doing things like incremental marking and concurrent sweeping as well.
But I don't know if either of those browsers are doing generational stuff yet.
I know that SpiderMonkey would like to do generational garbage collection, but they have issues where parts of Gecko are referencing the GC directly. And if they were to re-factor the GC, they would break Gecko so there's a bit of work to be done there.
- Alright and so the techniques that you outlined that will have benefits not simply-- - Yeah, the core message here is, I used GC as an example, but the core message is to take an interest in the internals of JavaScript, right?.
So, in my case, it helped that I knew a little bit about how garbage collection worked because I could optimize for that app in a non-naive way. But you might taken an interest in the rendering pipeline, or how JavaScript deals with numbers or dates or something else.
And so, the core thing here is, don't try to prematurely optimize for memory until you have that problem.
So, wait until you've got the problem.
But go away and take up interest in the internals of the Runtime.
- Fantastic, once again, thanks Hadi.
And let's wish him very well as he goes off to Cambridge. Please come back one day.
- I will, yeah, thanks John.