Performance Mistakes–an HTTP Archive deep dive
Hello, during this session, we'll be talking about performance, mistakes, or rather performance features that are often implemented incorrectly.
Many of the features I'll be talking about today are ones that you're likely already familiar with.
Compression, resource hints and lazy loading.
Now, over the years, I've found that a lot of sites make some of the same mistakes on these three features.
And I thought it would be really interesting to look at some data from the HTTP archive to see exactly how prevalent they ar.
So today I'm going to show a lot of examples so that we can all collectively learn from these mistakes.
And my hope is that by seeing some of these examples, you'll be able to keep an eye out for them if, and when they pop up on your own site.
Now, if you've never heard of the HTTP archive before, it's an amazing open source project.
That's been tracking the state of the web since 2010, almost all of the research from this presentation comes from the HTTP Archive.
Now the data from the archive is based on millions of WebPageTest measurements.
The site, the sites that are tested are actually based on a list of sites from the Chrome user experience report, which is Google's RUM data.
And after the tests are run, all the results are stored in BigQuery.
Now the data can be queried directly from BigQuery.
And I've done a bunch of that for this for this, some of the graphs that I'm going to share.
You can also find some high level monthly trends on this data in the HTTP Archive's web site.
There's a discussion forum where you can share and discuss analysis with the community.
And then there's also the Web Almanac.
Now the Web Almanac is a community authored ebook about the state of the web.
It sources all of its data from the HTTP Archive.
And last year there were 24 chapters covering everything from page contents, to user experience, content delivery networks, security, CMSs, performance, and so much more.
Uh, Overall, there is more than 120 contributors.
Authors, analysts, reviewers, translators, and, and, and such a, it's a, it's a really huge effort and I'm proud to have played a part in it over the years.
Now, the 2022 edition of the Almanac is currently underway.
So if you're interested in contributing, please reach out.
I'll be happy to help you get started.
So we're in an event called lazy load, and I figured we can start with lazy loading.
Now the goal of lazy loading is to limit the number of bytes served during an initial page load by only loading images above the fold.
Now, many years ago, when the concept of lazy loading images started, sites would have to use JavaScript to monitor when an image was scrolled into view so that it could be loaded.
More recently, the `loading` attribute was added to the HTML specification.
You can see an example here where you have an image element that says loading equals lazy.
What this does is this tells the browser to natively lazy load the image.
So there's JavaScript library required.
Now native lazy loading is widely supported on, on almost all modern web browsers.
That makes it really, that makes it easier than ever to implement it.
It's ultimately a really great thing, if it's configured properly.
This graph is from the 2021 web Almanac and shows that almost 18% of websites were using the loading attribute for images.
I did some analysis back in 2019 when Chrome first added support for lazy loading.
And I found that literally in the first month there were hundreds of websites already using it.
Now there's well over a million websites, which is really amazing.
But what happens when you lazy load too much?
So last year, Rick Viscomi and Felix Arntz shared some intriguing research that showed that WordPress sites had a slower Largest Contentful Paints when lazy loading images.
Disabling lazy loading actually resulted in a net improvement.
Now the degradation wasn't because lazy loading was enabled.
But rather because of how it was used on the pages.
Since the site was lazy, lazy loading all of the images, the Largest Contentful Paint image was also lazy loaded, which prevented the browser from loading it earlier.
The 2021 web Almanac also discussed this in the performance chapter, highlighting the Largest Contentful Paint elements with potential anti-patterns.
Now two of these anti-patterns were lazy loading related.
The Almanac showed that 9.3% of pages that were using the loading equals lazy attribute had in fact, lazy loaded the Largest Contentful Paint image.
Also 16 and a half percent of sites that were probably lazy loading images, using a job using a JavaScript implementation, had lazy loaded the LCP image.
So this is so prevalent that a lighthouse audit was created to detect when a page was lazy loadingthe LCP image.
And you can see in the screenshot, it shows a snippet of the HTML where the LCP element was loaded.
So you can see the loading equals lazy in in there as well.
Now in addition to a webpage test results, the HTTP archive is also running a lighthouse measurement for every page and it stores that data as well.
So we can actually run SQL queries against this data to see how often the LCP images is lazy load.
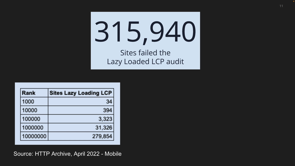
Now, according to the April, 2022 HTTP archive data, almost 316,000 sites failed the lighthouse audit for lazy loading the Largest Contentful Paint image.
Now, when I looked at the rank of the sites, I can see that 34 of these were in the top 1000 sites.
So these are some popular, highly traffic sites.
In fact, almost 4% of the top 100,000 sites fail this audit.
Now, a few examples of popular sites that failed this audit are Flipkart's, Spotify, T-Mobile, PlayStation and the NBA.
Now some of these may have fixed the issues since then, but you can always run a lighthouse audit to check.
Now, the next topic I'd like to discuss is resource hints.
There was an entire chapter in the 2021 Web Almanac dedicated to this topic.
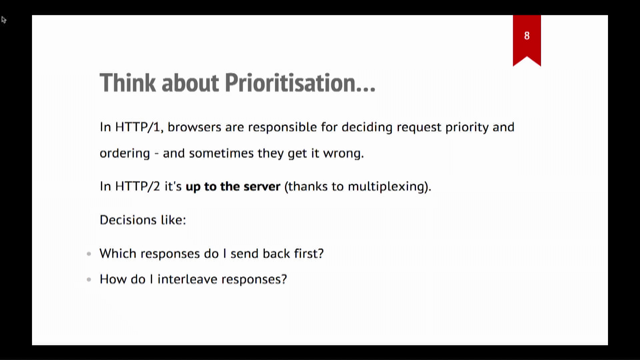
The resource hints tell a browser that it can do some work early.
And if they're, and they're implemented in either the HTTP request well, I'm sorry, the HTTP response header or the HTML response body.
Now the three most popular resource hints are dns-prefetch, preconnect and preload.
And they're the ones that we're going to be talking about today.
Now we'll start with dns-prefetching preconnect and we'll get to preload a little bit later.
When a page attempts to load a resource from a different host name, for example, a third-party request, it needs to perform a DNS lookup to get the IP address.
And, and then, and then it performs a TCP handshake to establish a connection.
After that, there's a TLS negotiation that needs to happen.
And all of this happens before the HTTP request is made.
But what's important to note here is that the time that the DNS lookup happened is when the browser knew it needed to make the request.
It just had to wait until the connection was ready.
dns-prefetch tells the browser to perform the DNS lookup early.
So when the browser knows it needs to make the request, it establishes that connection.
And then it makes the request.
preconnect sets up the entire connection in advance.
So when the browser knows it needs to make the request, the connection's ready, and it can just make the request.
Now as we showed earlier, dns-prefetch is used three, almost three times more than preconnect.
So if you're using dns-prefetch on a domain and you're loading resources from that domain on the same page, you should probably use preconnect instead.
So at Etsy we're using preconnect in the HTML response body.
It looks like this, you know, there's a link rel equals preconnect and an href with the domain.
And we're using this to fetch our image subdomain, i.etsystatic.com.
Now something doesn't look right here, though.
If you look at the waterfall, the preconnect actually looks like a dns-prefecth.
When I first saw this, I checked the source to see if we were using a dns-prefetch, but sure enough, there was a preconnect there.
So preconnect has an optional cross-origin attribute, which is required when a connection is going to be used to request a credentialed resource.
Now, I found this a bit confusing because we're requesting images and it shouldn't require a credentialled resource.
It turns out that this wasn't working because of the missing cross-origin attribute though.
So we'll be fixing that soon.
We did check to see what happens in the so if you look at a packet capture, the browser actually established a connection.
It just didn't use that connection.
So what we saw was a DNS lookup, a TCP connection, a TLS handshake, and then another TCP connection and TLS handshake and that's, and, and the, in the webpagetest waterfall, what you are essentially seeing is that first DNS lookup, and then the second connection.
But this made me wonder, you know, how often is this happening across other websites?
So when I queried the HTTP archive, I found that there were 9.7 million preconnect headers and 4.5 million preconnects in HTML.
Now out of the preconnect headers, 101000 of them were missing a crossorigin attribute.
Oddly enough, I couldn't find the case where this issue was reproducible with ha with header injected preconnects.
But now out of four and a half million preconnects in the HTML 2.8 million of them were missing a crossorigin attribute.
And there, I found a lot of examples where this resulted in unused preconnects.
So in addition to Etsy, you can see this occurring on sites like Ikea, New York Post, chess.com, Tik Tok, and many more.
In all of these examples, it looks like a dns-prefetch is happening.
So the general rule of thumb here is if you see what looks like a dns-prefetch, then you're either using a dns-prefetch and you should use preconnect instead, or you're using a preconnect and missing the crossorigin attribute.
Preload is another resource hint that will fetch your resources early as possible in a way these resources jump the queue and they get, and they get loaded much earlier than they would otherwise.
A few common use cases are pre-loading fonts or LCP images.
Now this is an incredibly powerful feature, but it could be dangerous if overused.
You can see an example here where the image on the top, there's an HTML page, CSS request, and a font file.
And on the image on the bottom, you can see with a font preload, the font, the font file gets loaded before the CSS.
Now, if you are using preload, you might want to check the JavaScript console.
Wait a few seconds after your page loads and just see if you get a warning about an unusedpreload.
So in the HTTP archive, I found that there were 430,000 sites with unused preloads.
A few examples of these were Washington Post, Amazon, Redfin, Wayfair, and many, many others.
This is actually a, probably one of the more extreme examples I found.
The image on the left is actually a waterfall graph.
There's over 500 requests being loaded in this in this waterfall graph.
But 318 of these were preloads that went unused.
Now, if you look at the waterfall graph up close, you can actually see where there's multiple seconds being spent loading resources that were unnecessary.
So by preloading a lot of resources that are not used, you're you're taking, you're taking away bandwidth from requests that would have, would have otherwise been loaded by the browser.
Lastly, let's talk about text-based compression.
And specifically, I want to talk about Gzip and Brotli compression.
So the HTTP archive shows us that 43% of requests were served with either Gzip or Brotli compression last year.
Now the non compressed resources were likely files that are already compressed in other ways, such as images and font formats and things like that.
But the adoption of Brotli compression has grown over the past three years.
And I'm really looking forward to seeing what the 2022 Almanac shows about its continued growth.
Brotli compression generally shaves off about 15 to 20% more bytes compared to Gzip compression.
And and it's pretty widely supported across all across all modern browsers.
In the 2021 Almanac, the authors decided to download a large number of requests and attempt to recompress them to guess the compression levels that were used.
The results here were really interesting.
For Gzip, most of the resources were compressed between levels 5 and 9.
But there's a very large percentage of resources compressed with Gzip level one.
With Brotli, the majority of resources were compressed with Brotli's level four to six, and then some are compressed as high as 11.
Now the almanac recommends using different compression formats for pre-compressed versus real-time compressed resources because of the CPU overhead in compressing at the higher levels.
But why are so many sites compressing to Gzip level one?
NGINX is one of the most popular web [servers] and it currently defaults to Gzip compression level 1.
So, if you, if you're using NGINX, you know, please check your compression levels.
Level one leaves a lot of bytes on the table, and it's definitely worth increasing that to six.
Now, if you do find that your web server has a low compression level, and you're going to increase it, you may also, if you, and if you're using a CDN, you may also want to purge the CDN cache since the CDNs will cache, what you serve to them.
So they probably have the inefficient compressed payloads cached.
So here's another Etsy example.
We were testing out a third-party implementation on our checkout page, and we found that this third-party was serving a 152 kilobyte Brotli compressed payload.
I thought it seemed a bit large, especially since the uncompressed version was 373 kilobytes.
So I made the same request for Gzip compressed resource.
And I found that I received a 130 kilobyte response.
So in this case, Gzip produced a smaller file compared to Brotli, which is actually the opposite of what I'd expect.
A few years ago, I wrote a tool attempts to guess the compression level that you're using.
So what it does is it downloads the resource Gzip compressed and Brotli compressed, and then it recompressed is at every level of Gzip and Brotli this can be useful for seeing what the compression levels would look like.
Now at Brotli level five you should, we would have, we would have expected a 99 kilobyte response for this, for that same resource.
So would it, so in a way it's 35, 33, 35% too large.
Now the Gzip compressed resource was also larger than expected as well.
So when you see something like this, it's usually worth double checking your compression levels on your web servers or your CDN's compression levels, if they're doing the compression for you.
I've also seen some, some cases were Brotli encoders are configured with the window size that produces an inefficient, inefficiently compressed payload.
So you may want to check that as well.
The takeaway I would recommend from compression here is take your largest CSS or JavaScript file, run them through the tool, test it, just to see what's the compression level that you would expect and how does that compare to what you're serving?
Right.
If you see a large, a large gap, then you may want to investigate whether your compression levels are set or whether there's other web server configurations to tweak.
Another thing that to be careful about is Gzip compressing binary responses.
Right?
So Gzip is Gzip and Brotli are are really for compressing text-based responses.
They're not it's not an image compression algorithm.
Images are already compressed like a JPEG image or a PNG.
These are already compressed formats.
So if you're Gzip compressing these responses, then it's actually going to go into incur CPU costs that you might want to avoid.
Now, there were 226,000 websites that were serving first party, at least five first party images compressed with Gzip.
Now examples of these are Costco travel, Cricket Wireless, Ryan Air, bass pro, support.apple.com.
This is a really easy fix.
You can just disable the Gzip compression for those content types or those file extensions in the web server configuraton.
We covered a lot in a very short time, I included the summary of the takeaways for your analysis.
Considering how many of, how many sites have these issues, you may want to check some of this against the sites that you're working on, just to see if there are any quick wins here for performance.
If you enjoyed this talk and you're interested in contributing to the 2022 web Almanac, please reach out.
We're starting the analysis stage soon.
And contributors are always welcome at any time.
Lastly, here's a few links on how you can learn more about the HTTP archive.
The project is open source.
It's available on Github.
So if you want to contribute, feel free.
There's also a discussion forum and a slack channel where you can share analysis, find examples, get help from the community.
My DMs on Twitter are always open, so feel free to reach out as well.
And I hope you found this useful.
Thanks for watching.
And I hope you enjoy the rest of the talks.
Web performance is a complicated topic, but over the years it’s become easier to articulate thanks to incredible advancements in performance features, their adoption in the browser ecosystem and tools that test and give insight into which techniques might speed up your site.
However, all too often a feature is implemented incorrectly, resulting in a lost opportunity for performance improvement. During this talk I’d like to explore a few common web performance techniques–some that you are likely already familiar with. We’ll dive into HTTP Archive data to find some examples of sites that are using them incorrectly, and explore the impact and potential benefits of fixing them.