The Latest on Measuring Web Performance
Hey, everyone.
Welcome!
I'm going to be talking to you today about measuring web performance and sort of, the history of how we got to where we are.
I kinda wish I could have been talking to you in person.
I kinda miss the real conference events, but I'm going to be participating online.
So as you're going through the video and as you're watching the presentation, if you have any questions, I should be there, to ask them.
If not, you can always hit me up on Twitter: @PatMeenan, and I'm always happy to chat performance.
It's hardly work for me anymore - it's kind of like what I like to do!
So anyway, without further ado - the history of web performance!
And sort of....
at least my exposure to the history of web performance over the years.
And so before we dive too much into the measurements and the metrics, it's probably worth talking that - a lot of what we determine is fast or slow comes down to priorities and what different browsers, different user experiences prioritize for their users.
And so fundamentally there's two - really two browser engines these days: Chromium and Safari WebKit.
Firefox still has some market share - it's still worth looking at - but fundamentally there's two main browser engines that everyone's consolidated on and they kind of take very differing views on what makes a fast user experience and what to optimize for.
And it's worth keeping that in mind as you're optimizing your sites or as you're measuring your sites - to understand what you're actually targeting and sort of what they care about and why they do the things that they do.
So you understand the optimizations you make, whether it's going to impact one browser or the other or both.
Maybe one positively, one negatively?
And so Chromium generally focuses on getting as much user content in front of the user as quickly as possible.
And so to do that, it'll tend to defer things that aren't visible or it doesn't think will be visible to the user.
So it will prioritize 'in viewport' thumbnails, for example.
It will prioritize head blocking resources like scripts and CSS.
Whereas asynced scripts it may load - defer until after it loads images, for example.
While it's processing the HTML, it will also yield periodically.
If it thinks it's got enough work to draw something on the screen, it'll pause the work that it's doing to go ahead and try and paint onto the screen.
And images, it will progressively render them when it can - so like progressive JPEGs - it will try and show you scans as they're being decoded, rather than just at the end when they're complete.
And this sort of goes into even steps beyond that.
Like when it's parsing the HTML and it gets to a late body script, for example, it can decide: Hey, I've already processed a bunch of images, probably some DOM that hasn't been laid out.
Let me do that before I start running this script, because I don't want to get into a situation where I'm running a long running script and I can't draw to the screen.
So Chromium very much focused on getting early content visible to the user as quickly as possible.
WebKit - Safari kind of takes a different view on it and tends to optimize for efficiency and getting to the end state as quickly and as efficiently as possible, minimizing battery usage and not focusing on sort of the intermediate states and more just the end state of the experience being loaded.
And so it will not defer anything.
It will load everything as quickly and as soon as it - or it will request to load everything as soon as it knows about it.
It will keep parsing HTML and doing work as long as it has worked pending for it to do.
And it will sort of defer doing layout and paints until things have stabilized, until it's done making changes, to try and avoid doing multiple layouts and doing re-layouts of the same content that it already did.
And images it will tend to prefer to render only the final decoded image rather than incrementally as it's being decoded.
And so as you're working on optimizing, and if you think you've got an optimization that may target one browser, make sure you're measuring in both of them, just to be sure, and kind of keep that in the back of your mind as you're working on pre-loading and pre-fetching and progressive images and all of the kinds of things that we like to work on in performance.
And so with that background and philosophies in place, if you would...
diving right into the history of how we got to where we are today!
And you're going to be hearing a lot of talks during Lazy Load about the performance metrics themselves, the Core Web Vitals, and so I want to try and give you some of the foundational background on the journey of web performance measurement and how we got to where we are today.
And it's just sort of a stop in the progression.
We're never going to be done with the final end state of This is it!
We have one number that represents all of web performance!
Unfortunately.
And so back in the day, when operations was generally doing most of the performance monitoring for applications, it tended to focus on server response times.
This was probably even before the days of slashdotting and the slashdot effect, but it's: How quickly is my server responding to requests?
How many requests can it process per second?
Am I going to fall over under load if I do get very popular all of a sudden?
and Can I handle the scale?
And so it was generally looked at from an operations perspective.
You had load testing, you had HTTP monitors which - and we still do these days - which would monitor the HTML response time from the origins to see how quickly it responded.
And that's actually still a very important metric today.
It's not like all-encompassing of the user experience, but a slow 'Time to first byte' will guarantee a slow everything else, cause the browser can't do anything until that first byte comes back.
And so it's not an old metric that we should forget, and it's still...
This is a tweet from a couple of years ago where I did a fairly large scan against the web and 20% of the webpages I tested had a first byte time of over three seconds, which is, you know, higher than the target for LCP - Largest Contentful Paint.
And so, in that case, you're slow before you even get off the ground.
And so if you've got a slow 'Time to first byte', fix that before you fix anything else, but it's probably not the main metric that you should be monitoring over time.
It tells you how responsive your servers are and how healthy your back ends are but it's such a tiny part of the overall user experience.
And so Steve Souders kind of famously when he was back at Yahoo and working on YSlow and Yahoo web performance coined the 80/20 rule on web performance where, you know, everyone was focused on the back end, but the back end is really only about 20% of the time that is consumed in loading the user experience.
The other 80% is what we call front end time, which is the browser sort of running the HTML and parsing the HTML that you gave it, assembling all of the different resources that go up into making the page and then putting them together into the final presentation to the user.
These days it's held up fairly well.
I'd actually argue it's probably more towards 90/10 these days, where 90 plus % of the time is on the front end, whereas only 10% if you're lucky is the actual back end processing time on the server.
There are certainly some connection setup time to get back to the origin and things like that that go into 'Time to first byte', but generally that's held up and it's skewing even more towards front end as the years go on.
And so as a result of that, we started focusing on more of the - the end-to-end full page experience from the user's perspective.
And so we went towards Page Load Time, which is a fairly clean and easy metric, particularly pre single page application and pre rich applications, where if you're looking at something like a document - like an actual HTML, read it, article kind of document - the onload time (page load time) is the time it takes for the browser to load all of the resources that were statically defined in the HTML basically.
All of the scripts, the CSS that ran all of the scripts and it loaded all of the images and so everything was complete.
And that - that's a fairly good technical measurement, if that's what you're trying to measure.
Unfortunately it doesn't map very well to the actual user experience.
And so in the single page app kind of world - and this is an old version of Twitter but it's one that I've screenshotted and used for a while.
And you get the same thing with Gmail and almost any rich application where the onload time is actually just the time to load the bootstrap of the actual application code that was in the HTML.
And then the application actually kicks off at that point and loads all of the actual application UI.
And so the onload time is way sooner than the actual application and it has nothing to do with the actual user experience.
And on the flip side, another...
even in the static HTML case, one of the things that you get is...
I think DailyMail is one of my favorite poster children, because it was a really fast website from a user experience point of view.
But the page load time is horrendous because it's a long scrolling page with articles and articles and articles, images - like hundreds of images - but they're all below the viewport and the viewport itself loads really quickly, but to load everything, (even though the user doesn't actually see it until they scroll, and even then it'll probably load faster than they're actually scrolling reading content) so it reports a page load time way later than what the user is actually experiencing.
And so while the Page Load Time is an easy to define browser technical metric, it's been a horrible end user experience metric, but it was the best we had for the longest time.
Yeah.
And so the other thing, even beyond the...
on the below the fold scrolling and something we're seeing a lot of these days are chat widgets, ads, retargeting pixels in particular, which are completely transparent to the user and it's basically a way - like when you go look at a car at a dealership online and suddenly that car follows you everywhere online - it's because the dealership dropped what they call retargeting pixels saying, "Hey this is...
They visited Chrysler," and so across all of the different ad platforms, target the user and say, "Hey, they visited Chrysler, so if you ever serve an ad from your ad platform, give them a Chrysler ad." And so they drop retargeting pixels for all of the different ad providers that they use.
But the user doesn't actually see that - that's not user consuming content.
It tends to be really slow to load because each one's a different origin that has to set up a new connection, but typically that used to go into the page load time.
So just another example where it doesn't actually represent what the user gets to see.
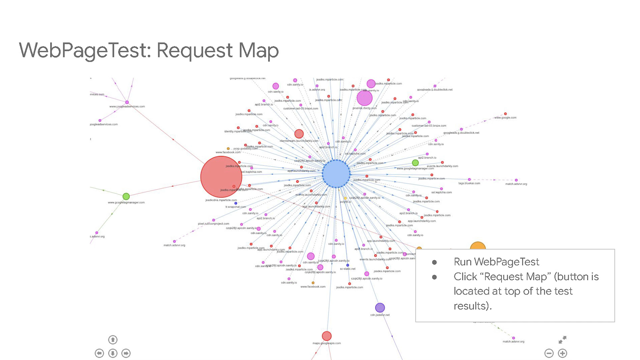
So we started working on render-based metrics and this is right around when WebPageTest brought the Filmstrip to WebPageTest.
But before that, IE I think is probably the first browser that was reporting First Paint Time in JavaScript as sort of a - it's not a great overall end user experience, but it's a step in the user experience that's fairly easy to define and fairly easy to measure: "When is the first piece of content that's like not a blank white page that gets shown to the user?" And so we started working towards having visual metrics and more towards the user experience and less of the technical measurements.
It was kind of an interesting time because the browser paint metrics were horribly broken.
They reported times...unfortunately, the initial implementations, what most of them ended up reporting was the blank white page that they painted when the document committed.
So like when the HTML finished loading, but before the head blocking scripts and everything else have run in the CSS and it has any DOM, it would report the paint time of that blank white page.
And so video-based performance testing helped us combine those two or evaluate those two and see under what conditions is the browser not working accurately as far as the end user goes?
And so they've evolved over time and pretty much all of the browsers right now report fairly accurate First Paint time.
It's still worth checking, because there are still some cases where they're off by a few seconds even, from when stuff actually gets displayed to the user.
And so it's one of the things to watch out for.
Anti-flicker snippets from A/B testing tools can sometimes trigger it these days, where they paint, but they have a hidden overlay that's hiding the content that's being painted.
And so browsers - and Chrome in particular I know has been doing a lot of work to try and deal with those edge cases - so that what they report is what the user actually sees as far as paint times.
But this is sort of the first real step towards a user perspective from our performance metrics.
Speed Index went a step beyond that and it effectively tries to give a score for how quickly content gets painted to the screen.
And so you get rewarded for getting as much content as quickly as possible onto the screen in front of the user.
So if you can get to the end state really fast, great!
But if (and you'll have a fast score), but if you get to the end state really slow just because of a social widget, but all of your main content was still displayed really, really quickly, you'll still have a very fast score, especially compared to a site where it stays blank for that same amount of period and then finally displays everything at once.
And so you'll get a much faster speed index by having as much of your content displayed as quickly as possible.
And so technically it ends up being a measurement of the average paint time for a pixel on the screen.
But it's a hard metric to explain to people, because you can't look at a filmstrip and see a point in time...
Like if you had a Speed Index in this case of let's say it was 2300, which would be an average paint time of 2.3 seconds - and you look at the filmstrip - you may or may not actually see anything changing at that time.
It could be the same for multiple seconds before and the same for multiple seconds after, because it is just an average.
And the other thing - it had some fairly rough edge cases where Speed Index is calculated based on the visual display of the viewport.
And it can only be calculated off of a video capture, which was one of the rough things.
So you can't capture it in RUM, but it depends on that final state screenshot, if you would, being representative of the final state of the page.
But things like pop-up banners, click throughs, rotating gallery content in the first page can result in that end frame not necessarily meaning all of the content has loaded.
And so if you didn't have a completely static page that built towards a final end state and then didn't change, Speed Index could get skewed fairly badly.
But it's still one of the better metrics that we have.
And if you have a page where it works reliably, it is a very good metric for how quickly stuff gets on the screen.
But unfortunately, it's a Lab-only metric, and so we had to move on and try and find (and trust me, we've tried many, many times) to, "Is there a way that we can measure something like Speed Index in the field?" But there were always security concerns and lots of overhead with trying to sort of figure out when all of the different pieces of the screen render in real time on end user devices without video.
And so some of the recent metrics work has been around.
"Okay, let's...
how do we define the parts of the user experience that we want to measure?" And so a lot of this came out of the Chrome team.
Big props - Kenji in particular I think started with the milestones that we care about, as like: "When did the user actually see something?
When could they interact with it?
And how was that experience of seeing and interacting with the content?" And so we have a bunch of different metrics that sort of, fall into different places, but it fundamentally came down to: Is it happening?
- something changed on the screen to give them a progress indicator roughly First Paint-ish.
Is it useful?
Did the actual main content load?
Can they do something with the page now that it's loaded?
Sorry - that's the: Is it usable?
- is: Can they actually do something with the content that was loaded being the content that they were actually going there for?
And so those three milestones are kind of the foundation of how the Chrome team, and generally we in the web performance community at large are trying to represent the end user experience of loading content.
And so how we got there and beyond sort of just the paint metrics.
So when we had Start Render and Speed Index for many years, there was a lot of focus on getting content loaded visually as quickly as possible.
And so in the single page app case, that ended up pushing towards a lot of server-side rendering.
Send down the page to be displayed and then hook up all of the application logic - rehydrate the page if you would - under the scenes so that you'd have a really fast visual experience.
Unfortunately, that rehydration process was really expensive in a lot of cases.
And so you could end up in a situation where the page would look visually complete and you couldn't do anything with it.
Like the user would be trying to tap on things, scroll, and it wouldn't be responding, because the browser was too busy running megabytes of JavaScript that was actually running the application rather than the effectively, just the screenshot that got sent down from the server.
And so we knew we had to move beyond just render metrics.
And that's where we got into the Is it usable?
side of things.
"What can we do to measure the point where the content will actually respond to the user input?" Not necessarily penalize, but make sure we don't have situations where the main thread is like completely consumed with seconds of JavaScript execution resulting in a really bad user experience after the content has loaded.
And so, yeah.
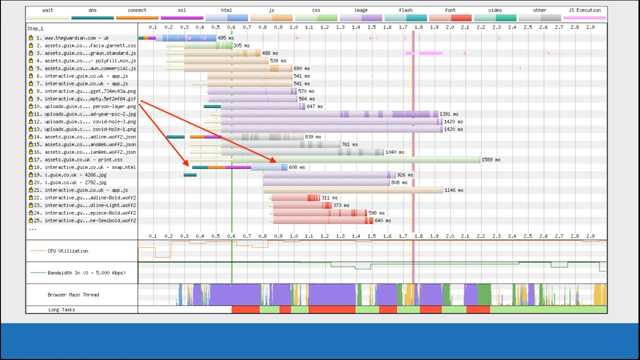
This is an example it's probably - CNN would be my guess - on a mobile device where you can see: the red blocks are where the main thread wasn't interactive.
And for the vast majority of the first 70 seconds, even though content was displayed on the screen at 13 seconds, the page was busy - the main thread of the browser was so busy running JavaScript that it couldn't respond if the user were to try and actually do anything with the page - for up to a minute after it got displayed.
So, Time to Interactive was the first attempt at one of the metrics, to try and address that side of the space, if you would, where it was an attempt to say, "At this point in time, you can be confident that if the user were to try and interact with the page, they would have a fast interaction." And it was trying to figure out: "Okay, all of the JavaScript has been hooked up at this point.
There's no longer any long tasks, and so this is the point where the application is guaranteed to be usable and responsive." It's an all encompassing metric, if you would.
So it would include Start Render, the main content loading, and all of the application code loading up, but it also had a fairly big Achilles heel in that it was measuring the last long task that would execute.
And after all of the application code was running and being hooked up.
And so you'd have a same Time to Interactive whether the, like in this case, the first one we saw, it was like really janky for the 60 or 70 seconds after the main content displayed.
And it would have a Time to Interactive right around 75 seconds.
Unfortunately, the second case where the main thread was completely interactive that whole time - even though it's doing a lot of work, it would respond to user input really, really quickly, but right at the end, it happened to have something that ran longer than 50 milliseconds, and so you'd still have a 75 millisecond Time to Interactive.
And so it was, if you would, say like a pessimistic metric and it ended up giving people sort of false things to focus on.
Instead of focusing on cleaning up the biggest, longest tasks that were happening that the user is likely to hit, it would encourage them to focus on the last tasks to focus on.
And so while it's still a metric that can provide useful information, I'd say it's probably not one of the interactive metrics that we want to focus on going forward.
And so there's been a lot of work and trying to figure out: Okay, so where do we go from here to actually have useful interactive metrics?
One of the good things that did come out of sort of that Time to Interactive janky main thread is the concept of Long Tasks that are also visible from JavaScript with a performance observer.
Where you can say, "Hey, tell me any time the main thread is blocked for more than 50 milliseconds," and so you can create charts like this if you would, and see how often and for how long the main thread is blocked after the main content is loaded.
And you can calculate sort of anything you'd like if you come up with a different metric that works better than Time to Interactive, for example.
And it was the foundation for calculating Time to Interactive, but it's also been useful in a lot of other cases, just for understanding the busy-ness of the main thread, if you would.
So.
From there, we've sort of evolved to where we are today with the current state of the art in web performance metrics being the Core Web Vitals (or the 'Web Vitals' in general) from Google - largely from Google and the Chrome team - there have been like inputs through the W3C Web Performance Working Group across all of the browsers, but it's definitely been a metrics effort that's been led by the Chrome team.
And so back to Kenji's chart on the multiple states: Is it happening?
Is it useful?
Is it usable?
We sort of - the team in general picked out - some of the early work was like, okay, First Paint?
Maybe not so useful because it could be a background, so First Contentful Paint - when did you draw an image or a piece of text?
- something that the user can actually consume other than just sort of a bland color, if you would.
Our early efforts were to try and identify a First Meaningful Paint, which was to say, "Hey, the main user content has loaded", but unfortunately, figuring out what is meaningful on the page was really hard to define clearly and get right very frequently.
So we've sort of moved on past that.
And then there's...
we don't have a 'Visually ready' metric right now.
We can sort of capture it in the Lab with Visual Complete from video capture and things like that.
Time to Interactive we've sort of moved on from, and then Fully Loaded, which is sort of the end of everything and it's not the old 'Page load time'.
It's sort of the...this is where we think all of the content, even after a single-page app and everything else has been hooked up is finished loading.
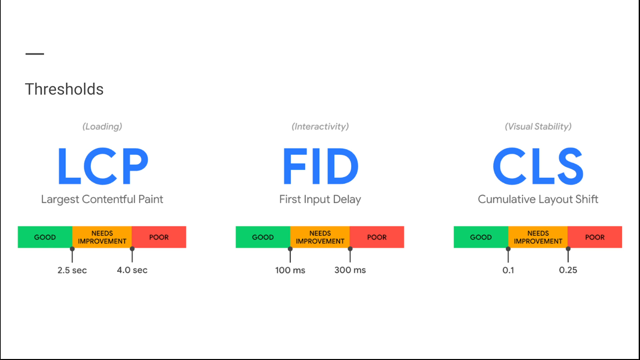
But the main Core Web Vitals are targeting around sort of three experiences that we wanted people to focus on, or that in general contribute to that: Is it loading?
Is it, or is something happening?
Is it useful?
Is it usable?
And so there's one around loading.
The main one for that in Core Web Vitals is Largest Contentful Paint.
Interactivity - how responsive it is.
That's First Input Delay (and we'll get to that in just a little bit ), and then sort of, a metric that didn't fall out of any of those, but understanding the stability of the page, one of the ongoing sort of concerns, if you would in web experience was content moving around under the user.
A common case for this is like you have articles with ads in between them - or article paragraphs with ads in between it - and you're reading an article and all of a sudden, an ad loads and it pushes the content down, but it also happens with like buttons and things like that, which can be really bad if they move as the user's about to click on something.
If there were about to click on 'next' and they accidentally click on 'buy now' or something like that, or if they accidentally click on an ad.
And so to reward the stability of - the layout stability - if you would.
And so Cumulative Layout Shift generally works on focusing something like that.
So into the actual metrics.
And of course, I'll start off with one that's actually not a Core Web Vital yet, but we've talked about it a fair bit.
It's the latest iteration of a Start Render or a First Paint if you would, but First Contentful Paint, which is when the first image or text piece of content is drawn.
Effectively, it tries to measure when it's drawn to the screen, or as close as the browser can figure out to when it gets to the screen.
We've seen this recently - Safari just shipped support for FCP in iOS 14.5, and so I think Tim Kadlec has a blog post up about it, where, depending on the browser engine or the browser you're talking about, they're somewhat removed from the actual painting of content to the screen.
So the browser will put layers together, images, compose it on a 3D - in the GPU buffers, if you would - and then it'll kick it over to the OS and say: "Okay, you know what?
I've given you everything that I want displayed to the screen, you figure out how to get it actually to the screen." And so Chromium - in general - is fairly close.
It gets callbacks to know when the layers have been composited together and when it's actually being presented to the screen.
And so it gets a First Contentful Paint that's fairly close - within milliseconds at best - to when the content actually hits the screen.
Safari is a little more removed.
They have a lot more OS layers between the browser and the actual screen, so you can see a few hundred milliseconds up to between when it's actually reported and when stuff shows up on the screen.
So it's worth paying attention to - especially if you're doing cross-browser comparisons for metrics - to understand if the metrics are actually measured the same way across the different browsers and to validate that they're working well, specifically for your pages and your sites, maybe by doing a video capture or something like that.
Largest Contentful Paint.
So LCP is the measure for when the - this is sort of the latest iteration of the main content for your page loading, and instead of Meaningful Paint, it was a whole lot easier to define and ends up being fairly reliable to just report the time when the biggest piece of content gets painted to the screen.
And so we've got Largest Contentful Paint.
Chromium only, unfortunately for now.
This is the main Core Web Vital from a loading perspective for the end user experience.
And it's - it works fairly well across a lot of sites.
You can measure it through JavaScript.
You can register a performance observer to listen to them.
It will tell you what element was measured and you get candidates, unfortunately.
It's not like: you know when you've hit the largest paint until you've actually hit it.
And so as you're going along the page load experience, you will get a callback for each paint that is in the viewport that was for a piece of content that was larger than the previous largest thing, and so you can end up with a bunch of LCP candidate events.
So in this case, like CNN, for example, first on the search box there was a Largest Contentful Paint for the little label and then above the header, the text for the article, if you would - the headline for the article was the largest piece of content so you got another LCP callback, and then finally the hero image painted and you get a callback, and then that ends up being the last LCP callback.
But if you end up stopping your measurement - for example if you're doing this through RUM - before the largest thing actually paints, you can end up reporting too early of an LCP.
So waiting until as late as possible in the lifecycle before reporting metrics - especially for the Web Vitals - tends to give you better metrics, if you would, just to make sure that nothing came in later that ended up replacing the candidate that you had before.
There are some still a few rough edges.There have been a bunch of iterations on LCP in particular to help report a more accurate measurement, but one of the rough edges that still needs to be sorted out is around progressive images, for example.
So LCP right now for an image only reports when the image has completed loading.
And so if you have a progressive JPEG, for example, where it looks visually complete to the end user at roughly 50% of the bytes or 60% of the bytes, it won't actually report LCP until 100% of the bytes are completed.
And so if you're looking like at a filmstrip or a video representation, you can end up with an LCP that may not match what you expect to see visually for the metric loading.
Animated GIFS (JIFS, just to make everyone happy) - it will also only report when the last byte of the animated GIF has finished loading.
And so if you have a fairly long animation, even though it can start drawing and doing the actual animation after the first frame has loaded, it won't actually report until the last frame has completed, and so you can end up in a situation where visually, it looks like you should've gotten your LCP much sooner than what was actually reported.
This was one of the metrics that was impacted by A/B testing overlays, hidden content and things like that, where it was drawing the browsers, drawing content, but it's invisible.
Most of that stuff has since been fixed in the latest versions of Chromium, but there may still be a few edge cases.
So just watch out for - look at - I'd say run some lab tests and compare what gets reported for LCP against what you see in the filmstrip and just make sure what you're seeing makes sense for your site and you understand.
But it's awesome.
Even from RUM and from JavaScript, you get the actual element so you can start reporting like: "What image, what div is my LCP and can I start prioritizing that?" "Can I preload the image (for example) to start getting it loading sooner?" Because by default Chrome will load images at a fairly low priority until after it's done layout and only then does it boost the priority of images that are in the viewport because it knows: "Oh, okay.
These are critical images.
Let's try and get these sooner if possible." But if you can preload, maybe you can give the browser some hints to try and get your core, key LCP image loaded as soon as possible.
Cumulative Layout Shift.
This is one that's definitely going through iterations.
It's kind of a difficult metric to understand as far as the number goes and what's being reported, but effectively it's reported in units of viewport shifted, if you would.
And so like a 1.0 for a Layout Shift means the entire viewport worth of content moved by an entire viewport's worth of distance.
So if you have a, like a large viewport or a large element moving, but it only moves like one pixel you'll have a very small layout shift.
Or if you have a one pixel element that moves by like a whole viewport, you'll still have a very small layout shift.
And so it accounts for how much content moved and how much it moved within the viewport of what the user can see.
And so historically, prior to early May/late April, CLS was reported for the entire user session, however long they were on your page or application.
So if you have a single page app - you have a web app like Gmail or something that's open for days - it would report on the experience over that entire time, and every layout is added cumulatively to the Cumulative Layout Shift.
And so there's been changes made more recently to use a windowed version of that if you would, where it looks for batches of layout shifts that happen right after another.
And then if it goes silent for one or two seconds, it cuts it off.
Or if it's been over five seconds of things, moving, it cuts it off and it looks: Okay, what's the Cumulative Layout Shift for that window of time?
And then it starts another window when it sees more layout shifts.
And then it basically groups them in bursts of layout shifts.
So a long running page may have a whole lot of bursts, but the cumulative version of each one of those bursts is just for the one event that happened at that time.
And then the overall CLS that gets reported for the page is the max of all of those, if you would.
Basically to try and stabilize, or make it more fair for short-lived, page loads - single page apps versus multiple page apps - traditional HTML - and try and make it fair because you could end up in a situation where you had very large CLS even though the actual user experience was relatively good, just because the application was so long lived.
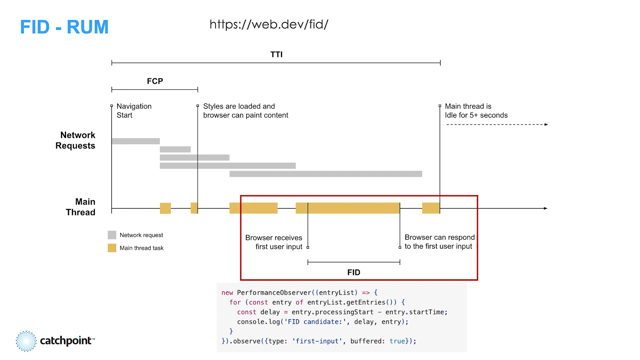
And then First Input Delay is where we sort of move into the interaction side of things.
And this is trying to measure: When the user actually interacted with the page for the first time, how much was the main thread blocked for before the browser could actually service that event?
It doesn't include any of the actual processing that your application would do in response to the event to show the user anything - it's basically literally just "How long was the main thread blocked while the user tried to interact with the page?" And all of these you can get from both RUM and Lab except for FID.
The FID - First Input Delay is RUM-only because there is no user in the lab, right?
So there's no way of knowing at what - you could do 'probabilistic' or whatever to try and check at every point in time - but it only really makes sense from a user experience where you actually have a user interacting with the page.
Total Blocking Time.
TBT is the Lab equivalent, if you would, for an interactive metric.
And it's the Lab proxy, if you would, for FID, where it takes all of those long tasks - everything that was over 50 milliseconds - and it basically sums them together.
It takes out - it has an allowance of 50 milliseconds to consider JavaScript blockage on the main thread as being responsive.
And so for every one of those long tasks, it takes out the 50 milliseconds and only counts the blocking time, but then it sums up the blocking time.
And so this works out to be a much better representation for how busy the main thread was than the old Time to Interactive metric.
But it works fairly well for the Lab to give you a single number for: "How much did I block the main thread after load?" The main drawback to something like Total Blocking Time is there's now 'is-input-idle' as a JavaScript call that things like React can make, for example, so that they can run long tasks - or 'is-input-pending', so that they can run long tasks and just check and poll the browser: "Hey, did the user try to interact with the browser?
And if so, then yield.
But otherwise go ahead and run things in a tight loop as much as possible." And so, in a case in the Lab where a user is not actually trying to interact with anything that'll never respond with: "Yes.
Input is pending." And so it'll look like you have a long task, even though the actual code could have yielded immediately.
So First Input Delay from the field is largely going to be a lot more accurate, if you would, for, for an end user experience and the team's working to try and make it more encompassing than just "How long was the main thread blocked?" And so we've talked a lot about what's available in RUM, what's available in Synthetic, and so I definitely highly recommend if you're not already paying attention to he W3C Web Performance Working Group.
All of the browsers participate - Safari I don't know why they're not on the list, but they do actually show up into the calls, but it has browsers, web publishers, developers, all getting together to try and figure out: "Okay, what are the metrics we care about?
What are the measurements we care about?
What are the other performance APIs that we care about?" And things like lazy loading, for example, came out of - for images - came out of the W3C working group.
Navigation Timing was one of the first things that came out of the W3C Working Group.
Before this, we always had a situation where the only thing that you could - the only timeline you could measure from RUM was effectively as soon as you could get your JavaScript actually running on the page - from that point until whatever you wanted to measure.
But you were blind to everything that happened before that.
And so Navigation Timing gave us the full picture: For this page loading, when did the content, when did the browser actually start navigating to the page?
How long did it take to get the HTML back?
And so you're no longer sensitive to having your JavaScript as early in the head as possible to start measuring performance, and you could actually get visibility into back end server times that you largely couldn't get before it, and you could get it in a bunch of interesting components, if you would, in the loading.
And so this was like the first time when I started thinking: Awesome!
We're not going to need to do synthetic testing anymore.
We get all of the data we need directly from the user experience, from the field, from what they're actually experiencing.
Resource Timing took it a step further where beyond just getting it for the overall document, now we get all of the timings for every request that's made on the page, assuming that the Cross-Origin Requests allow timing, otherwise you just get that the request happened and an overall duration.
But it's awesome because now you actually get to see: "When the browser scheduled a request, how long did it take the server to respond?" "Did I have a slow DNS or TCP setup time?" And things like that, or "How much time did it spend-" {{AppCache is less important these days, but) - "how much time did it spend doing service worker processing for the request before it went out?" And so we could build full waterfalls, if you would, from the actual end user experience in the browser.
You were still sort of subject to only seeing what were successful navigations, because you only got your JavaScript to get measurements once the HTML's loaded.
And that's where Network Error Logging came in and to fill the gap of unsuccessful navigations - if the user had ever been to your site and your server sent a report to, and a 'network error logging' header, the browser would now know an endpoint to send error reports to on navigation failures.
And so you can start getting reports for DNS failures or origin problems, or if like there's an ISP specifically where someone's having problems navigating to your site and you can have it report to a different origin.
So you can have it on different infrastructure than your main site in case it's your main site that's having problems.
And so now this actually starts to get to the point where we have complete visibility into the end user performance from RUM, which was only something that was a bit available through synthetic testing before.
And so I was, you know, for the longest time of the opinion that we're going to move completely to RUM, and I've learned over the years through several...
I'd say sanity checks - that it's a little more complicated than that.
And so I've been at companies that have the largest number of sessions that you could ever have, so it's not a lack of data problem.
But RUM is noisy.
There's no two ways about it.
You have demographic shifts, you have time of day, time of week, month, seasons, all that kind of stuff.
And so this is, these are averages, so they're not great, but the 'domContentLoaded' time for WebPageTests, for example: on multiple year periods, within a year, across a few weeks and so you have the variations where..
yeah I mean, if you had 100% or a 50% improvement in a given metric, you might be able to tweak it out of the numbers, but some of my favorite anecdotes are like at AOL every year, we'd have a fire drill because we'd forget the previous year's fire drill - that in the summer all of the pages got slower because students went home from university, and they were no longer on really fast university connections.
They were now on their slow home internet connections, and it happened over a few week period, and so we'd have this shift in our metrics over a few week period where everything got slower, we'd do a fire drill and then at the end of the summer, everything got faster again.
And so it took us a while to track it down to be the demographic shifts, but every year we'd seem to forget that we tracked it down and we'd go through the same fire drill over again.
And I saw very similar behaviors when COVID hit and lockdowns happened, where people went home and they were all on their home internet connections over just a few day period when the lockdowns initiated.
And so, we get these seasonal shifts or these shifts that happen not because of website changes or technology changes, but because of usage patterns.
And so teasing the usage patterns and demographic shifts away from the technical changes is a tough thing to do with RUM.
And it's much easier where you have Synthetic, where it's like a fixed platform and you can measure just the changes in what you're actually serving as far as the content goes.
And so I've, you know, it's always sort of been the case, but it's, I think it's always going to be the case where you're going to need both.
RUM will give you a, "How are users experiencing the content?" But you'll need Synthetic largely to have a stable reference point for - "Did the changes I make actually make things faster?" - rather than the world around you moving.
And so, one of the things I'm most excited about - in WebPageTest, I pulled in the Chrome User Experience Report data to go in with your Synthetic data.
And so you can see in this case, down below the data table you have the Chrome User Experience data, the distributions, and at the bottom, you have the p75 from the RUM data.
And above the bars, you have little triangles for the First View and Repeat View from your Synthetic tasks.
And you can see: Roughly how representative of the user experience was this Synthetic test?
And use that to sort of set and calibrate your Synthetic Lab tests to roughly mirror what you get in the field and still have a nice stable baseline to work off of.
As far as getting the Web Vitals, they're all over the place, especially withthe search impact coming.
But Chrome Dev Tools, if you're doing iterations, the 'Performance' tab will show you all of your Web Vitals times as they happen and as they're reported and give you raw details about them.
Lighthouse you can run locally through a Command Line Interface.
It will also give you all of the Web Vitals along with the regular reports.
Google offers a bunch of tools - basically hosted Lighthouse - web.dev/measure.
You have to be a little careful in how the tests are done.
Like a lot of the hosted versions of Lighthouse that are run by Google use what's called 'lantern mode' where it doesn't actually throttle the connection to like 3G.
It loads everything very fast and it has a internal model, if you would, of how the browser thinks it likely would have gotten the resources and it predicts what the performance numbers would have been.
So you have to take those kind of with a cross-your-eyes, grain-of-salt kind of thing.
And so like WebPageTest runs both natively, and if you're running Lighthouse through WebPageTest, it actually slows down the connection using packet-level traffic shaping, and measures what happened.
But there are other tools out there that also use packet-level traffic shaping.
It's by far the most accurate way to simulate a network connection or a slower connection speed, if you would.
Chrome User Experience Report : the raw data, if you would.
And there's also an API for it - for how your users are experiencing your site in Chrome, for signed-in users.
And it's the foundation for the data that goes into the Chrome - the search performance experience report.
PageSpeed Insights, another hosted Lighthouse, if you would, but it includes URL-level Chrome performance data from the field, as well as hosted Lighthouse and so it combines the RUM and Synthetic, if you would, into one result.
The ultimate source of truth for how Google sees your site performance - the Google Search Console.
It'll tell you how many pages are good, what pages to focus on, and how you're doing as far as Google sees you from the search experience ranking.
Some common things, particularly around images triggering layout shifts.
If you don't have your image borders defined, it will move content around on you.
And so it's really just a matter of setting a height and width for all of your placeholders to make sure that the content doesn't load.
Lazy loading of images?
Don't.
In viewport images, don't lazy load them if you can.
Try and keep lazy load for out of viewport images, mostly because the browser won't even start to load the image until it's done layout which can be really late.
And so you, you can end up really hurting your LCP if you lazy load all of your images.
And so, I mean, we're all probably aware of the search ranking change coming in June around Core Web Vitals.
Basically if you've got all three Core Web Vitals performing "Good", you'll get a positive ranking signal boost, and that's what the search console will tell you - how you're doing relative to the targets.
And you're going to hopefully hear - you're definitely going to hear - from Annie during the conference, also follow Nicholas online.
They post fairly frequently about Core Web Vitals.
They are the core team working on the Web Vitals, and if you have any issues with the Web Vitals, definitely don't hesitate to file Chromebugs - crbug.com, and interact with them.
They're happy to help and looking for sort of the edge cases to improve the metrics so they're more representative.
And thank you.
That was a quick run through the history.
Like I said, I'll be participating online - feel free to ask any questions about this or kind of - any performance topics I'm happy to talk about.
So enjoy the rest of the conference!
Patrick is going to explore the current state of web performance measurement, both in a lab (synthetic) environment and from real users (RUM). There has been a lot of exciting advancement in this space with Google’s Core Web Vitals and evolving of other metrics over the years.
We will also explore how synthetic and RUM data complement each other and when each is most appropriate to use.
Link to Addy Osmani’s blog entry:“Web Page Usability Matters”:
Link to Addy Osmani’s Medium article: “The Cost of Javascript in 2018”
Link to the Google Search Central Blog post:
“Evaluating page experience for a better web”
Links to the web.dev resource pages for:
Largest Contentful Paint
Cumulative Layout Shift
First Input Delay
, and
Total Blocking Time
Links to the W3C Web Performance Working Group resource pages for:
Navigation Timing
Resource Timing, and
Network Error Logging
Link to WebPageTest.org
Link to Google’s PageSpeed Insights testing page.
Link to Google’s Search Central Blog on:
More time, tools, and details on the page experience update
Link to Simon Hearne’s article:
Everything we know about Core Web Vitals and SEO
Link to crbug.com