Building a Performance Culture

Hi everyone.
I'm Claire- an Engineering Manager at SafetyCulture, and today I'll be talking about building performance culture.
Firstly, let's dive into why performance is important.
In my experience, I've worked in environments where there were millions of users visiting each day.
And so handling the load and the traffic was something that was important because if we didn't, this would have an impact on the user experience and have business impacts.
So jumping back in time: when Twitter was experiencing a lot of load, users would often see the 'fail whale' whenever there were scaling issues.
And then moving forward to a more recent example, Signal also experienced something similar.
As their user base was growing - (you can see here they're really excited by that) - but they also had scaling challenges that they needed to overcome.
So these were a couple of examples where the back end performance is important, but as a part of the user experience, the front end performance is just as important.
So diving into an example here: Google conducted a survey and found that 53% of people will abandon a site if it takes longer than 3 seconds to load.
As a part of that same survey, they found that 46% of people said waiting for pages to load was one of the things they disliked the most when browsing on mobile devices.
And lastly, as a part of that survey, they also found that mobile sites took an average of 19 seconds to load over 3G connections.
Diving into another example: Pinterest also conducted a series of experiments to improve their website performance back in 2015.
And as a part of that, they worked to improve the mobile landing page and improved the performance by 60%.
This led to a sign-up conversion rate improvement of 40%.
And after this, the team worked on productionalizing these improvements, which led to the biggest increase in user acquisition in the following year.
So now I want to touch on: What does performance culture look like?
You've got examples out there where teams are working on performance, but what does it really look like inside?
Jumping back to an example a few years ago, where I first encountered the topic of performance was a team at Fairfax, or they also looked at the Sydney Morning Herald, and this was something where it was just baked into the processes and everything that we did.
For example, if we were building features, we'd be considering performance impact.
Before rolling out features, we would be performance testing and tuning if any of the benchmarks were not met.
And then as we rolled out the changes into production, we'd also monitor these and see what was happening and respond as we needed to.
I can remember when engineers were clustering around a dashboard if it was a busy day and, you know, there was a lot of load, and that's just something that we just lived in breathed.
Then jumping forward a few years, I found myself in a team where we were looking at front-end performance.
And in this scenario, it wasn't just one team's focus.
It was actually a focus globally in the organization.
So being a classifieds site, the impact of ads is something that we were considering, and we wanted to understand what was the impact on the user experience, as well as in finding places where we could optimize things.
So A/B testing some of our changes and improvements, and then leveraging some of the technical advancements that were coming out at that time.
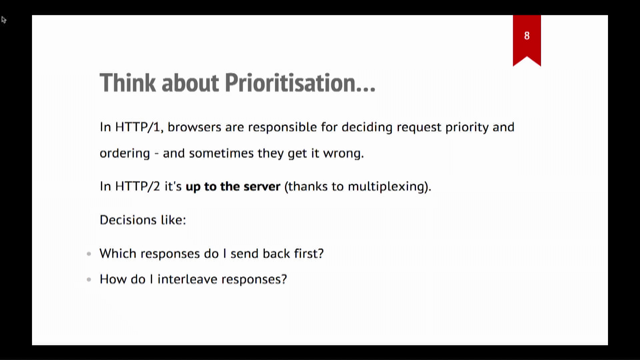
So for example HTTP/2 was rolling out some changes and we wanted to leverage some of those improvements into our optimizations.
So we've talked about what does performance culture look like?
But let's backtrack now to how that can start.
And that can be different depending on the environment you're in.
So more often than not, you may not have a clear idea of what the performance is like at that point in time.
You may or may not be testing, and you could find that this could be quite a manual and ad hoc process.
Customers might start complaining, particular pages might take a while to load, and this is when that starts to surface.
Another way that this could surface is that the user base is growing.
And this is where performance becomes more and more of a focus.
So at SafetyCulture this started in a few different ways.
The scalability of our systems is something that's important, and that's because our user base is growing and we're going through a period of growth, which is very exciting.
But at the same time, we needed to understand our limits and if we could support the growth that we were expecting.
On the other side of that, we also wanted to understand: What was the impact to the front end?
And we just didn't know.
And so one of the things that we wanted to do is just run a bunch of performance tests to just understand: What was the performance like right now?
So now I'm going to pass over to talk about how this started at SafetyCulture: Team members reach out and ask, "Hey, you know, do we have any metrics on how our application is performing on specific pages"?
And we had a few select engineers who ran those tests on an ad hoc basis.
So it was very manual and it wasn't until we had a quality-themed hackathon that we started diving into that process.
We wanted to embed that process into our day-to-day workloads.
And by doing that, we really start to bring performance to the forefront of our minds in our day to day work.
So as part of that, we also wanted to push a lot more of that information to the engineers, so performance metrics information to our engineers, and that really involved automating that process as part of their daily changes.
And so, why do we do that?
I think we want to ensure that we've got a way to conveniently present that information to our engineers so that they can understand and really view and analyze what their changes are like and how that impacts performance.
And so that's what we've done at SafetyCulture.
We've updated our CI/CD pipelines such that upon any change that is merged and deployed to our staging and production environments, we run these sets of performance tests.
And then we've also got infrastructure capturing the results of these tests.
We then have dashboards that we've created to visualize and show the trends of these metrics over a period of time.
And then we've also got reports that we're sending out to teams on a weekly basis.
And that focuses again on proactively pushing that information to our engineers, and that allows us to then get them to engage in the performance analysis process.
And then the automation piece also allows us to be a lot more flexible with how we run the tests, what we configure to test, how we run the test and how we...
- actually let's cut back on that - The automation process also allows us to run the test with various configuration settings.
In particular, location and network connection speed are quite important to us here at SafetyCulture.
We've got various customers all around the world with different profiles, and you can imagine a frontline worker, for example, who's in a mining site or construction site where they don't have great internet connectivity.
And we really need to understand: What is the user experience like within those environments?
And then we can start to improve and iterate on our application, on our platform.
Another thing that you'll find as you're working on starting performance culture is understanding your surroundings.
And so, for example, if you're at a startup, the environment will be very different to other types of organizations.
In this scenario it's important to understand what matters.
As a startup, you're most likely going to be focusing on product/market fit and understanding the needs of the customer and finding solutions to meet that.
And so performance may or may not be a focus at this point in time.
However you could identify: What are the key pages to focus on?
And a great way to do that is just understanding the user journey as they're going through the funnel.
For example, landing pages, booking forms, they're indicators of customers using your site and the success of your business.
The other thing that you could do is look at the bounce rates of these pages and find those opportunities where you could start optimizing performance.
And then for scale-ups or organizations where you're experiencing higher load and more users using the site, understanding the limits of the systems is going to be a focus.
This is a quote from someone in the team who mentioned that "we just didn't know what the limits were.," And so one of the things that we needed to do was just backtrack and just understand the current landscape to understand our limits, and from there kick-started a bunch of activities to start improving the scalability as the user base is growing.
So now I'm going to pass over to Kevin to talk a little bit more about that.
So for us at SafetyCulture, it was really, really important for us to recognize and build awareness of where our architecture would begin to fail.
With a growing business like ours and a scale-up where we're adding users on an ongoing basis and the requirements on our system are growing and growing on ongoing basis, it's really important to maintain an awareness of where you're going to start to see problems and take action as soon as you can, to ensure that users who are onboarding and users who already exist on your platform or have been around for a while, continue to have the best experience possible.
So for us, that was about taking a look at the systems that we had in place and asking ourselves,:" Are they still right for us?" "Do they still serve us?" "Do they still serve our customers?" "Are our customers still getting the best possible experience?
And as we continue to add users at the rate that we're currently adding users, or in an alternative scenario, if that user curve, that growth curve was to tick up, what would that look like, and at what point would we start to see problems?" So once we'd identified a goal, once we knew where we were going with the growth of the company, with the growth in our user base, the next thing to do was to set some performance targets.
And we thought about that along two different dimensions.
It's the leading and lagging indicators of performance.
The lagging indicator is really the user experience, and that tells you, you can look at that and say, "Hey, users are starting to have a really poor experience".
And you can see that experience starting to degrade as a result of the scalability challenges, or scalability issues that you might be experiencing.
That's a lagging indicator - it tells you that something has already gone wrong.
For us, we wanted to look at leading indicators.
We wanted to look at indicators that told us we were starting to see a degradation in performance, which allowed us to then take action and make a change.
So that, that degradation didn't lead to a degradation in the user experience.
So what might that look like?
We set goals, for example, on SLAs and SLOs for response times from our data stores.
SLAs and SLOs for response times between microservices, and paying attention to data at that level allowed us to take corrective action to ensure that as we made changes in our back end architecture, we could make changes with the view to avoiding issues with the user experience and not degrade that user experience.
As you're working through performance, you also need to understand how to communicate the value of this to other people, and that's going to be different for the audience.
So for example, if you're talking to marketing they most likely want to understand about the bounce rates, and time spent on pages.
If you're talking to customer experience, they want to know: What is the user experience going to be like?
They'd be looking at things like page responsiveness, NP scores, and other indicators to demonstrate this.
For stakeholders they want to understand limitations.
For example, Will we be able to grow and meet customer needs?
Another way you can do that is looking at benchmarks and comparisons to competitors in the market.
An effective way you could do this is showing this visually through a filmstrip, and you can see here that - you can see how the page is being loaded and the performance impacts of this.
And another example here is how you could demonstrate benchmarks to competitors.
This is taken from SpeedCurve, so you can see that similar organizations' load times are compared against each other, to just give you an indication of where your organization could sit.
So at SafetyCulture, we conducted a bunch of different activities.
So as I mentioned earlier, we started with an audit.
Just to understand where we're at.
And then we documented those findings.
So looking at the problems that we found, as well as opportunities.
Following on from that we drafted a plan.
So, diving into particular areas that we felt that we could continue investigating or start to roll out performance improvements.
We also had senior leadership buy-in and that's quite key.
We had a director who was interested in understanding what was the front end performance across a few of our front-end repositories, and then dived in to understand the performance results.
From there, they also communicated this across other leaders in senior leadership.
And if you didn't pick that up from earlier in the earlier points, communication is key and finding different ways that you communicate this across the group, so that you can drive the engagement and awareness of performance.
As you're building up performance culture, it's important to also have a plan and figure out: Where do you start?
As a part of that, you will be identifying different areas to tackle.
So for example: What are the problems and opportunities that you could tackle?
Can you break down the bundle size?
What are the impacts of third party scripts and other things that you've found from your performance report?
As a part of that, there'll be metrics that you want to focus on.
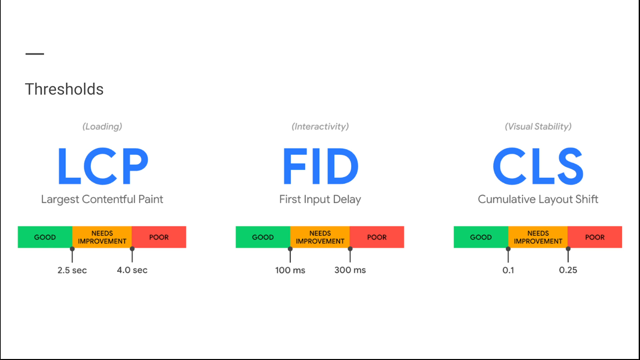
At SafetyCulture we've decided that Cumulative Layout Shift was something that we weren't going to focus on.
And it wasn't because it's not an important metric.
It's just that our pages are not organized in a way where content will be shifted down by other content.
So as a part of that, we also looked at pages that we could tackle.
So for example, landing pages, pages that were visited more often, or where there were more shared components, these were areas where we felt we could make an impact if we started picking up optimizations in these areas.
The other thing to pay attention to is the data that's coming out of performance reports.
So as you're adding more features in, it's important to revisit the results from these tests and see other areas that you could start diving into.
The other thing here is OKRs.
So something that we've been doing here at SafetyCulture is just adding in the performance score into the OKRs.
So teams can revisit every quarter and identify areas that they can start improving in.
As you're rolling out performance culture in your teams, the other thing you want to think about is: How will you drive change and keep that momentum going in your organization?
So a great way to do this is form a team around it.
Something that you can look at, for example, is finding the performance champions who can really champion the importance of performance and the value that it brings.
Finding the subject matter experts to guide others, for example, who will help do the investigations and who can help guide others in making improvements in their systems.
And remember, there'll be many steps and changes to drive some of these initiatives forward, and having a team helps with driving this.
I now want to touch on the examples of performance teams in other organizations.
So Etsy is a great example.
They live and breathe performance.
For example, they've got dashboards, they write up, they contribute to the tech community.
They really show others what performance is like.
Jumping into the example from earlier at eBay Classifieds Group - as I mentioned, this was an initiative that was a focus globally.
So there were different teams formed worldwide to look into performance and also bringing that back within the group.
For example, there was a slack channel where people would post questions and share their learnings as they were diving into performance.
A more recent example is at Yoox, where they have a Performance Guild that specializes at looking at optimizing - so they have a great example on their Medium page, where they talk about some of the optimizations they've rolled out.
At SafetyCulture, we have a framework called World-Class Engineering, and this is a great way for engineers to bring initiatives to improve engineering and front end performance was something that was a part of this.
And now I'm going to pass over to Kevin to talk a little bit more about World-Class Engineering.
So, in a technology organization like ours, it's super important that you're always moving forward, changing, growing, learning, and adapting how you build software.
In the tech industry, if you're not moving forward, you're actually moving backwards, because the landscape around you is moving so quickly, and moving and changing almost on a daily basis, that it's necessary to continue to improve and continuously improve on a daily basis to keep up with that change.
So, the World-Class Engineering framework is a framework which brings people together around initiatives.
And through those initiatives, people across our teams look to make change in some aspect of how we run our teams and how we build software, or in how we connect with the community, the greatest software engineering community in the city market, in the Australian market.
The engagement within the team is going to help you continue to build the performance culture and a great way to do that is knowledge sharing.
So whether it's through lunch and learns workshops, documentation training, find the method that's going to suit your environment.
As you're working on optimizations and learning new things, share that back into the organization.
Another way you can do this is just putting this into the team processes.
So at SafetyCulture, we have something called "Ops Reviews" and that's a forum where the team gets together regularly to review the health of the system.
Looking at things like dashboards, incidents, things that have happened over a period of time, and identifying the optimizations and improvements that they can make.
As a part of that, the front end performance has become a focus for some teams to pull in as a part of that process.
Another thing that we've done is looking at How do we divide up the work so that teams will find it easier to contribute to the performance?
And I'm going to now pass over to Tom to talk a little bit more about how we did that.
One of the challenges that we have with really large-scale engineering challenges is: How do you break that up into small parts that software engineers can contribute to in a meaningful way?
And the analogy we discussed internally was: if you were at a party and they were serving a chicken dish, they wouldn't just get a roast chicken and put it on a platter and take it around to the people at the party.
They would beforehand prepare it out in the back and put it in a nice bite-sized dish that you could pick up neatly off the tray and eat and enjoy.
And the same challenge - we have the same challenge with the software engineers.
How do we take that large, large task and split it up into smaller pieces that they can just pick up in a sprint and do quickly without having to understand all the details of the greater piece of work?
Another thing that we did at SafetyCulture was look at how to automate performance tests.
So this was something that we ran manually and ad hoc.
For example, if someone wanted to understand the performance of the page, they'd ping someone to run a test and find out.
So this was something that we saw as an opportunity to take it away and automate this.
So then that way teams could focus on the data that was coming out of those reports and understand the trends, and then make it easier for them to find the opportunities to improve performance.
So those were examples of how you could do this internally, but there's also a tech community that can benefit from this.
And a great way of doing that is writing up some of the findings and the learnings that you've been doing for your performance testing and performance improvements.
Something that's really important is remembering to celebrate the improvements.
So as you're working through things, celebrate the achievements and the hard work that the team's been working on, share that with the group so that everyone can see the progress that you're making.
It's also important to remember that this is a continual journey and will go through a series of different iterations.
Remember that you'll be learning about different ways you could be optimizing different metrics, learning how you communicate with others, and just remember that it's a continual process.
So that's the end of my talk.
I hope that there were some points in here that can help you with driving the performance culture in your environment.

