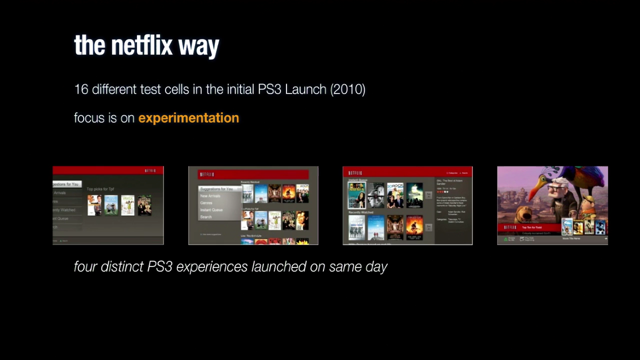
The Operable Front End
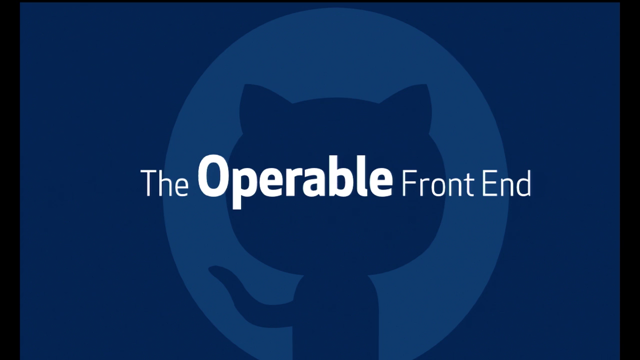
Operations engineers sometimes use the term “operability” when they talk about the ingredients for fast, stable, maintainable applications. While operability is usually discussed in the context of back-end systems, there’s no reason instrumentation and observability should stop at the app server. This talk will take a broad look at what operability can mean in the context of the browser, and it’ll lay out the metrics and tools that are needed to have operable front end code. We’ll also look at some production situations where good client-side instrumentation uncovered an unexpected facet of performance, security, or user behavior. Finally, we’ll dig into how to employ all of these metrics and techniques in service of a faster, more responsive end user experience.
“make your software more operable” …whuh???
Build code to be more friendly to the build and release cycle.
Be able to:
- detect when there are problems
- diagnose and fix them
- deploy the fix to production (efficiently!)
Operability is about everything that happens after a feature is ready for production.
Automate things, test things, have monitoring endpoints, dashboard everything!
The attitude that used to be… (worked fine in dev, ops problem now – burning house girl meme)
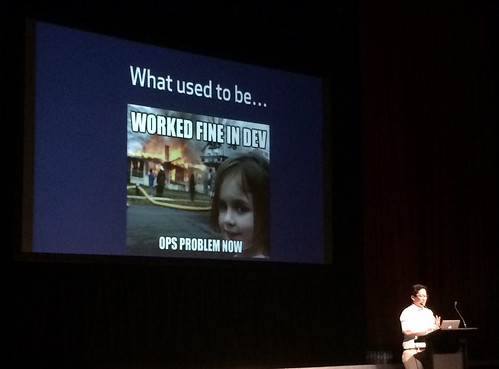
…became “it’s a user problem now!” Understand that problems are an issue for everyone – the user, support team who has to field the calls, etc.
Notion of “frontend ops” – while not a common job title or well-defined role, it’s definitely a concept that is out there and should be discussed. It’s probably going to become more common as more code shifts from the back end into the front end.
(reference a smashing mag article from 2013 “front-end ops”)
Emily’s day starts by checking some dashboards. Looking for things which aren’t normal – a new pattern, a new error, something that’s a bit suspicious.
In one case she found a problem with a license text injection menu – a feature she didn’t even know existed! It was built before she joined and not a hugely popular feature. First thing she did was check the issue queue to see if a user has already spotted the issue (in this case, yes). She knew having just looked into it, she was “the company’s leading expert on this one bug…” so she was able to answer the issue, saving the support team a few minutes.
JS ERROR MONITORING
They have a short script that collects contextual information for JS errors. The browser provides lots of detail including message, filename, line number, the error and even a stack trace. Then they also grab document.ready state and time since load. Capture the target of the event (what were they clicking?).
They filter out quite a few errors and send it to an app called Haystack, which is an internal github system built originally for backend errors. But since all errors are just objects they adapted it to track JS errors as well.
They use chat to query the error API, partly as it gives the team visibility on who’s working on an issue.
PERFORMANCE
Two main categories: synthetic metrics (debugging tools and systems) and real user metrics (from the users browser).
Specific callout – lots of third party code insists on a SCRIPT in the HEAD which really causes problems if that third party is down. You can have blank pages being served but it may not trigger traditional monitoring (eg. It’s still a 200ok status, for a successfully-delivered-but-totally-empty page).
- Loading metrics – Monitoring response time, domcomplete time, etc gives more detail so you can work out where problems are occurring.
- Simulated loading metrics (ajax, pjax, etc) – pjax lets you time navigation actions
- Interactive performance (jank) – harder to track but awful for the user. Github has a “hacky FPS measure” that runs in the background, but it doesn’t give a lot of detail. There’s an API coming (frame timing) that will make this better.
USER METRICS
Nothing is as good as instrumenting the user experience directly. Google Analytics can provide some of this…
War story: she accidentally broke the “create pull request button” one time… they now monitor how many PRs have been created in the past few minutes and alert if it drops.
GA can actually provide alerts for these metrics!
CANARIES
Tests never really capture all the weird things users do in real life. You need as many canaries as possible… but ultimately coworkers
ACCESSIBILITY MONITORING
They are building a set of a11y checks in JS; this fires a custom error class, console.logs and gets reported to Haystack. They detect images with no alt, links with no text, form labels not connected, inputs with no label, etc.
Why not put this in your test suite? It’s actually hard to get the tools to test every view; but running the checks in staff mode/dev mode runs on everything.
HOW TO START
“OK cool but I don’t have Haystack…”
There are services that can help:
New Relic, errorception, Raygun, LogNormal (SOASTA), Google Analytics.
Graphs and alerts – Circonus, Graphite+Nagios+your ops team, GA again.
“The best answer is talk to your ops team, find out what they use and then use that too.” It’s good to collaborate!
Anything you can send an event to GA you can get alerts on.
SO WHAT?
Putting all this together gives you some really good tools and techniques that will help you write better code. It can change the way you code.
People wouldn’t use XHTML 1 Strict because it was too hard to know if you were serving broken pages. People liked using jQuery because it doesn’t throw errors much. But if you are monitoring you want errors so you know things have gone wrong.
Why not just write tests? You don’t want to write tests for everything! Some things are better to simply monitor results than write massive, complex tests.
Tests won’t catch everything – monitoring will find errors that occur when your users upgrade their browser, even if your tests aren’t running that version yet.
Monitoring makes for fewer ‘code janitors’ – you find bugs sooner, so you can usually get the author of the bug to fix it (opposed to someone having to dig through and reverse engineer it again later).
…
Front End Ops Engineer – quite a title. But worth remembering that even if you have some people named “javascript developers” usually everyone is writing some JS. So her job is to put the tools in place to make it easy and safe for people to write and deply frontend code.
…
Q&A
Q: why did you roll your own app instead of using sommething like new relic?
A: github just prefers to roll their own to customise things… they obviously prefer open source too.
Q: are there performance hits from the actual monitoring code?
A: this is a question they ask a lot – and how do you monitor the monitoring code? – but they keep an eye on the impacts; plus they can run the site in “staff mode” so users aren’t taking the hit.
Q: how do they manage alert-itis, too many alerts or too much noise?
A: something’s that’s really critical will send an SMS, but something not so urgent might get a chat message from Hubot.
Q: do your devops people care about the FE monitoring/errors? How do you get everyone to care?
A: they don’t automatically get ops involved, they naturally work together when they need to. The teams also generate a lot more empathy for each other and get on more easily.
Q: how bad are the cross-browser issues?
A: they have a pretty modern user base so they actually get issues from really new versions of chrome rather than the really old browsers…