Tuning web performance with just browser APIs
(upbeat music) - Hello, everyone.
Welcome to my talk on that performance tuning with just browser APIs.
First of all, let me thank you, the Veterans Code organisers, they've done a fantastic job. It's been a blast.
Running through one month worth of knowledge is a really great job.
They've done a really massive job.
So thank you all.
Thank you, John.
Thank you, Rosemary.
I think you've done a great job and I really appreciate you having me here this year.
This is my first time at veterans course, so I'm really excited to be here and talking to you all. And this talk in particular, I'm really interested about because it basically sets some precedents for us developers to use the modern APIs instead of relying on third party tools to do some basic stuff in our day to day jobs. So if you're a web developer and you're passionate about web performance as much as I am, difference is the ground.
It's gonna be a talk with full of tips and tricks and a lot of different stuff that we'll go through. And hopefully by the end of this talk, you will have enough on your plate to go around and play around with some of these amazing technologies. So let's start with some of the background about myself. My name is Yas, I'm a Lead Consultant at TelstraPurple. I've been in the Development Community for about five years now, starting...
When I came here in Australia about five years ago, I started to go around and do some talks and share my knowledge at meetups and conferences, national conferences and international conferences. And I've really enjoyed this.
I'm really passionate about sharing knowledge and helping developers in the community to thrive. So bear with me.
You can find me at Twitter, @yashints, and I've got a blog at yashints.dev, that you could check out all of these contents that I went through, it's been blogged before. So I've had a massive amount of basically attractions from different people and different developers, both at my own website and also at dev.tool, which is a developer community platform for bloggers. So another thing that I'll do, let's jump into the talk. First of all, we need to agree, on a concept on a few concepts before we can build into those APIs and technologies.
To be on the same page, let's start with what is web performance.
Basically web performance is, a set of act of monitoring and analysing the speed of the web page and how interactive it is to the users. And then, throughout this monitoring, we find areas which need improvement.
And after identifying those areas, we basically take some actions to improve those points and bring a better user experience for our users. So that's all about web performance.
Web performance can happen in both sides.
It can be on the server side where you have, for example, all your operations, you have database interaction, and so on.
And also, on the client side where you have, for example, image optimizations or web phones or using, stylesheet and a bunch of other stuff.
So that performance basically can happen in both sides. When we talk about web performance, we talk about general web performance, but this particular talk, it's all about clients side.
There's a tiny bit of server side as well, but that's just one tiny API.
And the rest is just purely about client side performance optimization.
So the process for web performance is really easy. We basically measure some metrics and basically metrics are the thing that we use to measure the performance. And then we go through some actions we took, we basically apply some changes to our application and we then measure again to see how far we've come or whether we've gone into the right direction or not. And if we have coming to the right direction, the application performance is not a bit better. Then we can basically say that, yes, we've done a good job, let's continue.
In terms of how we should do it or where we should do it, in specific, we basically take some actions in the lab. So all the things that I will be doing for you today, or I will be talking about today, good performed is in your local host, in your local development environment.
So that's called lab.
In a lab environment, we can potentially measure a lot of different techniques.
So from, let's say from all the metrics that we talked about in terms of user centric metrics, you could potentially go through all of that in your browser dev tools, as I'll show you shortly.
But also you could use some third parties to measure your performance optimizations in terms of adding a bit of a different perspective to the performance optimization. But, those third parties have been always like either not being free or not being accessible enough for people to use.
And especially, since we're talking about third parties and local environments testing those local list websites through a third party might be really challenging. So today's talk is about using something that is in our hand and at our disposal to be able to basically go through this process.
Once we've done that, once we've gone through and measured our lab environment, we apply some tools that I mentioned before in the process space, and then we go through production.
So once we upload those into production, we have to monitor the performance again, because most of the time, the conditions in the local environment are a bit different to the production environment.
So we need to make sure that we also monitor the performance in the production environment and how the real users are interacting with the application. Once we've done that, we again take those measures back into the lab environment and try to replicate those issues or any other potential issues that we've found and apply those changes back to the, again, to the lab environment and measure again. So this process is a really incremental and cyclic process and we have to continue until we reach to a desired state. The desired state is not that we have to reach, for example, a hundred percent in lighthouse, it's about user happiness or how happy the users are, because performance optimization mainly have a lot of...
Take a lot of time.
And the companies have to spend heaps of money to be able to reach to a state where the users are happy. But they don't need to go too far, because when you go too far in anything, not just the performance, you might basically face some newer challenges or you might not get the return of investment of what you've already spent on the product. So, let's talk about metrics.
Metrics, basically, as we've talked about before, we have up to five high level categories for our metrics. We have perceived load speed.
This is in particular, talking about perceived performance. And perceived performance is not the actual performance decide, is how users think your side is performing. So there are some techniques that we go through that improve the perceived performance and how users are perceiving your side to be performing. In better word, your side might be slow in performance, but you have done or you have used some techniques which basically conveyed the message to the users or conveyed the experiences to the users that their side is fast.
But those are like tricks, like magic tricks. So you basically do some actions to let the users see something in the interim and basically talk about when it comes to seeing the side itself.
Load responsiveness, is basically another metric that, we have to consider when it comes to performance optimization.
Runtime responsiveness, visual stability and smoothness. Now, I don't wanna go through details in the metrics. Let's continue with the, why the performances matters. So first of all, there are three main reasons why we should care about performance.
First one is conversion.
So how users are converging with our website. Conversion normally is not a really complex topic. So if a user is filling a survey on your website, they've already converged.
If they are basically interacting with the site or they are going through one page to another, that might be actually a factor of representing the conversion.
The second factor is traffic.
So obviously the more the performing your side is the more traffic you get naturally from search engines or from different places. And users are more happy to return and your user experience. So when users are more happy, for example, shopping at your shopping website and they are... They see a really fast process, checkout process, shopping process, they definitely refer the word of mouth and so on and so forth.
So Amazon...
Let's go through some examples.
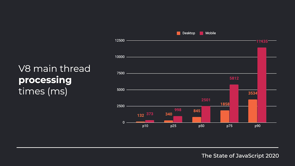
Amazon find out that every hundred millisecond delay will basically cost them 1% in sale.
Now you might think that 1% is not a really large number for a company, but when we talk about Amazon, they've had like $3.3 billion worth of basically income or revenue in 2019.
So imagine that, 100 millisecond, we'll be basically talking about $330 million per year worth of income.
So that's a huge number.
So performance obviously is really important. So how to measure the performance.
We can measure performance using, for example, our browser DevTool, so Chrome DevTools, Firefox DevTools, and also Edge.
They all allow you to do performance, on the application to measure the performance or some third party tools as I mentioned before. Now, all that said, we have no common ground to talk about what it is we're trying to do when it comes to performance, measuring the performance and then optimising those issues that we found through measuring.
So in order to measure our performance, we could technically go through a lighthouse and do an audit and basically start measuring our performance optimization.
But, when you're here talking about, there're so many APIs which are available through, basically, so you can implement those and use those APIs in your application, within your application to measure the performance.
So the first one is the some monitoring APIs. So monitoring APIs are basically a huge range of categories, but here we're talking about user timing, performance timeline, navigation timing, resource timing, and long task API.
And this should be enough for us to get us started. There are other, APIs as well.
Well, let's just go through these and see what they're offering for us.
So User Timing API basically is used to allow you as a user or as a developer to put some code in your application to create performance marks, what they call it. So imagine the performance mark is like a snapshot in time. So at point in time, which we call the performance mark. So you can create different marks in different times and then performance measures.
And we talked about what are the performance measures. And all of these basically using most of these APIs are accessible in the performance object within the basic clients side code that you are on. So just to give you a bit of an example, this is how you can create a mark for basically, for your application.
So first we video feature detection, if performance mark is not undefined, which means that the browser supports the User Timing API. Then we can create the mark and then do some heavy work, or do some other operations where it takes some time. And then we can create a second mark and third mark and so on and so forth.
Now, you can also create measures.
And measures are basically difference between point A and point B in time.
So imagine that you have some work to do.
You basically create a mark at the start of the task. You create a mark at the end of the task, and then you create a measure, which is the difference between those two points.
So it will give you a time difference between the two. Now, in terms of clearing the marks, you can also clear the marks after.
So although when you use all of these APIs, you have to basically clear these objects from the memory, because these are not the type of objects that should be... That could be basically garbage collected this easily. JavaScript doesn't know, JavaScript engines doesn't know what to do with these objects, if they are... if you're creating these marks throughout the, application and you're reusing those potentially globally throughout the application. So there will be remaining there and they take memory. So all this clean up after yourself.
And in terms of browser support, this particular API is pretty good.
So we only have some of the, for example, the clear marks and clear measure, the mark and measure, they're all supported by all the browsers at the moment. We'll get to a point where we talk about other methods on the performance object, which are not supported by some of the mobile browsers. So the next API we'll talk about is the Performance Timeline API.
And the Performance Timeline API's are some extensions on the performance object.
And basically, they add some observers to the performance APIs.
The observers basically, allow you to observe on the marks and measures that you've created.
So they will allow you to basically call for example, or getEntries method, and getEntries method will return all of your marks and measures and then you can perform some actions, for example, on those.
So getting all the marks, for example, you can look through all the getEntries, objects that are returned to getEntries and then go through and figure out which ones are the marks.
And basically either clear them, or if you want to create measures or do other operations with them.
In terms of PerformanceObserver's, well, you can definitely create some, basically a PerformanceObserver on a set of entries.
So when you get the entries, let's say you wanted to observe all the marks.
So you've wanted to observe all the frames. You could differently create an observer on those type of objects.
And the PerformanceObserver, callback will get called every time basically a mark is created or every time a frame is created and so on. So you can definitely have a global handler instead of using, for example, one method pair, or entry. You can have a global handler, which basically is handling all of those.
You can also have...
You can also observe a measure.
So every time a measure is created, the application can basically get triggered and then you can send those measures or marks into the server side, for example, for your analytics. And that's how the PerformanceObserver is used. So PerformanceEntry has a bunch of fields.
So the first one is an object.
It's got a name, it's got an entryType, it's got a startTime, it's got a duration.
Every performance object has all of these properties. So in terms of the browser support again, it's pretty good. It's really stable API at the moment.
So all the major browsers are already supporting all of that.
So definitely feel free to use it.
And, this is a really great point to start measuring your task, like how much a task is taking or how much you're rendering. For example, time takes and so on and so forth. When it comes to another API, which is the navigation timing API.
So beforehand we talked about how we can measure, for example, longer in tasks using the User timing and Performance Observer API.
But this time, we're talking about the navigation timing. Navigation timing, for example, the page load, the request, basically the request response time to pager render time and so on and so forth.
This is really helpful when it comes to measuring the performance.
So as an example, when we want to calculate the total page load, we get the performance.timing.
So all of these are exposed through timing object on the performance.
Again, as I mentioned before, all of these are put in the performance object in the window object.
So the timing here, we get the timing.
We can call it the perfData or whatever else you wanted to name it.
And then, you will have access to other properties which all properties have a timing to allow you to calculate other properties.
So for example, for page load time, you can say, hey, give me the loadEventEnd.
And then we can then deduct the navigation stuff from that to get the page load time.
There are heaps of examples on the MDN documentation or on the browser on the API documentation, if you're really keen to study the API itself, but I'll give you some really useful examples here as well. So calculating request response time as I mentioned before, you get the timing object from the performance, then you go through responseEnd, and responseStart. And if you basically deduct those, then you get the difference which is the actual response time of that particular request.
If you wanted to calculate the page render time, you can basically get the DOM complete and then, basically, deduct the Dom loading event or time from that to get the difference, which is the page rendering time.
So the time to play around, the API is fully supported so there's no, basically there's nothing that prevents you from using this particular API.
However, this API might get deprecated at some point in future in favour of a newer API, which is yet to be decided, that's the APIs in a draught stage.
You can also get the navigation properties if you want to, and then convert those to JSON, and then send it back to the, for example, the server side for doing some analytics or logging those inside your application.
When you get one of those entries, you have a bunch of fields, and you can see that all of those properties that we use to calculate differences, you can see all of those listed in this.
So if you get that object at any point of time, you get this list of properties and then you can basically start playing around with this to get different measures. So it's a really helpful API.
The next API we're talking about is the network request timing.
The network request timing is basically working on high resolution timestamps.
So what it does, everything in terms of the timing, they all work on higher solution timestamps. So when it comes to that, it means that they have a really good precision.
So the point or the point in time, it's basically in terms of milliseconds, so you have the ability to do a really high resolution time difference.
We're getting the calculations on a high precision on the client side.
Resource loading timestamps are basically exposed through networks request timing, and you can also do resource sizing .
So we can measure the size of resource using this network request timing API.
So let's see this in action.
If you think about, the events that basically happen until you get a request and response from the server, everything start with the redirect.
Then you have the ability to, for example, check the application cache if there is anything cached, go through DNS, for example, TCP request response, and all of that basically have been mapped to a property on the object that we talked about. So this time, for example, you have startTime, redirectStart, redirectEnd, fetchStart, domainLookupStart, and so on and so forth.
Or requestStart and requestEnd.
So, all this is a mapping between each of these events. So if you wanted to, for example, calculate the response time as you could see on the previous slide, you could see that now you can say, hey, requestStart minus requestEnd minus responseEnd minus requestStart. And that will give you a difference between from when the request was sent until the response, when you came back from the server.
But this time you can also get, for example, how much TCP were hand checked or how much the DNS was resolution to, and so on and so forth.
And that's why it's called network basically static API. So calculating the redirect time, it's really easy. As I mentioned before, you just get the redirectEnd, and redirect...
Basically reduce the redirectStart from that, and you get the difference, which is the redirect time.
So I won't go through too much of these example we'll get to more interesting APIs shortly. But basically, MDN documentation again, is a really good place to find out more about, what is achievable through these APIs.
If you wanted to calculate the resource size, which is another important metric in terms of how much each resource...
How much resource are you loading from your network. This is encoded snippet, which basically shows how to do that.
So you can get the transfer size, and encode body size and decode body size, objects or fields from the perfEntry, which you can get by calling the get entries by type. So in this time, instead of using mark or a measure, they're getting all the type of resources.
And for those resources, we can then calculate the resource time while using the property of transfer size.
So it's a really good API in terms of, if you wanted to monitor or load, how much resources are you loading, or how much traffic is going between clients server.
And the last API we talked about is the long task API. So what is a long task? Every task, which takes more than 50 milliseconds is basically counted as a long task when it comes to client side performance.
Well, most of the time it's...
They allow you to use...
This API allows you to measure, for example, what tasks are taking more than 50 millisecond so that they can flag those and do something about them. Now, let's see in action.
Imagine that you're creating your PerformanceObserver. And this time, instead of using, for example, metric or measure or mark or measure, we are using long task of entryTypes.
So that's another entryType which is added for us. We can then create a PerformanceObserver on that. And every time a long task is basically executed or any task, which goes above 50 milliseconds, this callback function gets called.
And then you have the ability to look through those entries and basically log them, or do whatever you wish. This API is in the draught state, so it's not... It doesn't have the great browser support like the previous APIs, but it's still supported in Chrome and Edge on chromium and some of the mobile browsers as well.
Now, this API, is really helpful when it comes to measuring the performance, but you need to be careful. Firefox, I'm not sure when they are...
When they will be adding, Safari, I don't know. I don't think it will be adding this soon, but it's a really, really great API when it comes to measuring the performance.
So we can definitely use it in Chrome and Edge. So not as if basically let's say we use all of those APIs and measure or find some areas where now we need to improve those.
So what do we do? Normally, when we come to performance optimization, there are a heaps of techniques, which is used to increase the performance of a website.
And I have a few blog posts, a few talks, and a workshop on that separately.
So what I'll talk about here is some of the APIs again, which is available to us on the client side to leverage and improve the performance.
So let's see what are those.
So we're gonna study or go through four APIs throughout this talk.
So first one is Network Information API.
The second one is Page Visibility API.
Then we go through Resize Observer API, and the last we go through Intersection Observer API. Now, let's see what are these and what are the use cases? So Network Information API is a great way to detect network condition changes on the client side. So let's say, someone is riding a train and then they go through a tunnel. Now their network is 4G before that, but now it might be 2G or there might be even flat. And Network Information API gives you the ability to detect those changes and adapt yourself to those.
So let's say you're doing your progressive web app, you're creating a progressive web app, you can basically figure out what is the network condition, or what is the network speed and then on your ServiceWorker, put the logic to handle different kinds of situations for offline or low network speed.
So let's see, again, this is a exposed through navigator or connection objects, so this particular API is exposed through that. And let's see how we can basically figure that out. Now, this is API, unfortunately it's not fully supported so you need to do a bit of a feature detection to see whether the browser that you're currently using supports that particular or not. And it's sort of always called a connection... In Chrome it's called connection, in Mozilla it's called most connection, in Web key, or Safari, it's called Web key connection. So you might get different naming, that in itself it's a really disappointing fact that not all of them are adhering to the same name. But anyway, once you've done the feature detection and you've got your network or connection object, then you can go through and check for the effective type, for example, to see whether it's 4G, 3G, and also check the speed and so on.
And then you can also, get the...
Add an event listener to the change event on the connection object to basically for your handler to get triggered every time network conditions change.
For example, one of the examples to use the Network connection API is, let's say you have a...
You enabled pre-loading video, for example, on your website. So a user comes to your page you're pre-loading a video for them.
So the next or consequent pages that they'll visit, the loading would be faster.
So you don't block the rendering until the video loads. So you can put the logic in there to check for the effective type and if the effect type is, for example, slow 2G, then you can set or you can stop the pre-loading and save some data for the user or basically, help the user experience to be a bit better. Now, in terms of browser support is not a great support at the moment.
So all we need to...
All you need to do is the Chrome it's mainly supported apart from the ontypechange, in Edge it's an Edge Chromium. Some of the properties have been supported, some not. In Firefox, Internet Explorer, there's no support at the moment.
And in Opera and Safari.
Again, in Safari, no support in Opera and some of the objects have been added for you to test. So before we go through the next one, which is the page visibility, let's go through a demo. Lemme bring up VS code Window and go through this application that I've created for you to see how can we use the Network Information API to improve the user experience.
So what I have here is a vanilla JS application. So this application is pretty standard vanilla JS application.
It's got a server component, which is written in experts JS, and basically, just creates a server which serves our files. And in our public folder, we have our main application and that application has a service worker.
And inside the service worker, we're basically hooking into the fetch events here. And, if the user is sending a get request for any particular image, so here I'm checking, for example, all the images that is being requested every time the user's making a fresh request.
If the network connection is a slow 2G or 2G, then I am basically circumventing that request and sending a preloaded image or SVG, which is super small, it's like a K SVG instead.
So instead of using the normal images on replacing all of the images with placeholders.
So, let's see in action, let's see this in action. If I now run NPM, it start here on my app.
This will start my web server and I then can come here in my browser.
I'm basically, typing this HTTPS local host 3000, which is a port that we basically have set for our application.
Now, if I...
This application takes a bit of a time to load, but basically, if you can see that there's an image here, which is a train image for this, plan your journey page.
And then there are some images here and also here at the top.
Now, what I wanna do here is I wanna open up the network tab and change my network setting in... So I'm using Chrome by the way.
If you're using your Firefox, if you're using Edge, you need to check whether first API is supported or if it's supported then basically, check how we can change the network settings in those. But I'm just gonna set this to, for example, slow 3G. And when I set this to slow 3G, if I now refresh my site here in this case, as you can see my images are being replaced by displace holders, so they're not actually loaded anymore.
So here, here, and here.
So it's a really great feature and it allows us to do sort of implement some of these techniques that I've just showed you to be able to improve the user experience. So let's go through our second API.
I'm just conscious of time.
So the next API we review is the Page Visibility API. This API is sort of very similar to the previous API. It helps us to react to condition changes on the user side, but this time it only allows you to do some actions if the user is already interacting with the application or is seeing the application or not.
So let's say you have two different tabs open. If the user has two different tabs open, and basically you're showing a video, for example, on the first tab or whatever the tab they're already in in your application.
But, they go through and they open a new tab so that your tab is not visible anymore.
This API lets you hook into that event.
And you can take some actions on basically on top of that. Now, in terms of use cases, you could basically stop and start video playbacks. You can pause image carousels if the user is not seeing the page.
You can prevent server calls to be fired, to save some data on behalf of user.
And you also can switch off sound, so you might have seen this in a music playing websites where, if you have, for example, your Web Player starting and you move away or you lock your application or you basically lock your mobile phone, they stop the music just to, the user doesn't need to go through you're loading all of that music.
Now in terms of the usage, you can see that on checking the hidden to see whether it's defined in all of the areas, that support.
And then we then go through visibility change, and hook into the visibility change.
So this, piece of code here is basically detecting the visibility change events names.
So again, all the browsers have got different namings for these particular events.
So we need to detect the event name.
And once we have detected the event name, we can then, add an event listener to that on the basically, the handler or pass the handler to the document.
And once we've done that, that handler gets called every time the user is seeing the page or not. So let's go through a demo.
Again quickly, here, we're gonna have to stop this one this time. And what I have to do here is come and check out my other commits, which basically, has the visibility API.
And here again, we need to build the application because every version has a different sort of features.
So what I've done in this demo is I added a page which basically has a link to a video.
And that video is playing or is on auto play by default. So when we open the page, that video gets played. Now, if I open a new tab and navigate to that new tab, the video playback stops behind the scene and I can then move on to...
So let me just show you this in action.
So we run the NPM start command, and then we come to our browser window.
Now, let me take the app online again, and refresh the application.
And if I now, come to...
Here if I come to history, you can see this video, which is now playing.
So as you can see, this is now basically playing the video. Now, if I do that, sure to hear the sound of the video itself.
And if I open up a tap here, basically the video stops. Now, if I come back the video again plays, and we can see that the message here is also being printed. But if I come here, the video stops.
So it's a really great feature.
It's a really great way to make sure that you're not wasting users data, especially if they're on a mobile device. If they are interacting with your application and they're not seeing your application, they're gone on a different tab or they don't see the application because they've now again in the browser. The next one we are going to review is the Resize Observer API.
Resize Observer API is sort of on a similar nature. This time, it will allow you to react, or basically fire an event if the page or if the container is resizing.
I remember back in the old days, I was basically trying to figure out, then the page was resized and that was really painful because the window resize event is basically triggered a lot.
So the application become very slow if you're performing an action that event handler, but this time, using the Resize Observer API is pretty simple. Again, on the Resize Observer API, you have the ability to, for example, change the font size if the container is, smaller or it's bigger by the...
Because of resizing.
Or, as you're saying in this example, the border radius of the container, you can change that to be a rectangle or to be a circle when they resize the element.
Now the fact is that this is not a great example to be shown, but I wanna show you an example of a better examples throughout the demo.
Just before we go deep go into the demo, let me just talk about the browser support. So it's currently browser is supported in Chrome, Edge, and Firefox, just not in Internet Explorer. And Safari also, supports this great browser... Great API as well.
Now, let's go through our demo here.
I'm gonna stop our server and basically once I've done that, I'm gonna have to come here and check out another one of our commits.
And this time, what I'm gonna do is, basically, I wanna do NPM run build the pages.
So we have to wait for the build to happen again. Well, let me just go through what I've done here. So we have an About page in the application. And that About page has some text in it.
And one of them here put a slider on our About page, which basically resizes the page or the container, which contains that text.
And once that happens, we then change the font size to match the size of the container.
So let's wait for this to finish.
Okay, so NPM start, so I'm gonna start the server again, and then I'm gonna jump into our application here.
So before I come to our About page here, you can see that...
Let me just refresh this one, because now it's changed. So you can see that default font have now increased it a bit to match the size of the application or about this adjust with here, which basically resizes this element. But we can see here, it's already triggered. So I'm hooked up to the resize event.
And if I basically make this smaller and see that the event is triggering here, but also the font size is changing. So as I go make the basically div smaller, the font size is getting smaller too, which means that if they are seeing on a mobile device, it's not gonna be the scroll too much.
And it basically reflects with the size of the elements. So that's how useful this API is.
This is just one of the examples.
Make sure that you go in and check out the API and find out more useful scenarios for that. So let's jump back into our slides and let's go through the last API in this talk that we talked about.
So the last API is the Intersection Observer API. This one is my favourites because it allows us to do a lot of stuff.
Now, Intersection Observer API, what it does. It does...
Well, you could imagine you have a container or the document itself or the viewport.
Now, you might have an object or an element, which is not visible now.
But as the user scrolls down through the page, at some point, that element is gonna be intersecting with the viewport or with the container that you had specified.
The Intersection Observer API allows you to capture that moment and trigger an action on that.
It allows you to basically create an intersection observer on an element, and then you pass it a target. And once that target is in, basically, inside that element inside the box of that element, then your callback function will get called.
So what are the use cases for this particular API? If we have the image Lazy loading, which is one of the really useful features, which you will see shortly in a demo.
You also can implement the infinite scrolling. You can monitor the ad revenue reporting like when a particular advertisement is appearing and user sees that without the need to hook up into all sorts of different events.
And also, you can prevent long running tasks or animations. If the, that part of the page is not visible yet. So that's also really a good use case for this as well. Now, when you wanted to create your intersection observer, you're gonna have to pass it some options.
So the options has three properties, the root, which is, basically the element that you want to monitor. That can be any element, that you'll specify or if you pass it, no, it will be the main document.
You can also specify root margin.
So basically this is talking about how much margin around the element you want to be monitoring and the threshold like how much of the target element you want to be appeared inside the root element until your callback is called.
Now, in your callback, you're gonna have to loop through, you get a list of entry and you have to loop through those and get the, basically, properties.
And as you can see here, there's the intersecting properties, which is telling you whether that, the target element of yours is intersecting with the parent element or not.
Now, let's jump quickly in a demo.
This is our last API.
So I've already implemented that.
If I come into image gallery here, and if come to our network, you can see that I've got some images loading.
So image one, two, three.
And this is a page where there are basically five images put in this page.
Let me show you the code.
So, you know what I'm talking about here.
Let me just go through the pages here and bring up our gallery.
So as you can see here, let me just close this one for a second.
Let me just zoom in a bit.
If I do a bit zoom in here, that should be better. So we have this page and in this page, this is the template for the page in the template.
And we can see that there's a h1 tag, and there are five different images.
So image one, to five.
But, I've only a specified the source for the first three. So these three images will be loaded.
But as you can see here, I've got a class of lazy loading for these two images, image four and five, and instead of source, I've given it the data source.
So this one doesn't load the image.
And you could see that in the next four tab, this particular one, didn't actually trigger, and these two images were loaded.
Now, what I've done here in my after render method, I've basically created our intersection observer, have passed of past the null as my root.
I don't want any basically root margin to be there. And I want to recently consider 20%.
So if the item is 20% inside my target limit, which is the document, then I want my callback to get called.
And if the basically intersection has ratio is greater than 0.9, which is 90%, then I want say you have control over here as well. Then I want to say, give me all the...
So here, remove the lazy loading and replace the source with the dataset.source.
So we are replacing the source of that particular image with the data source, which DNA was, the attribute that we added.
And here, I'm just getting all the images which have lazy image class and then creating an observer for all of those.
So I'm looping through those and creating an observer for all of that.
Now, if I go back into the page itself, you could see that these three images have been loaded because they have the source attribute.
And if I now slowly scroll down here, you should see image four now appearing.
So this is a request for image four, so this, the lazy loading is working.
And now you could have the image five loading here. So we can see that this is a super useful API as well. Now, going back to our slides, this was all the things that I wanted to talk about in this talk folks.
Thank you for listening.
Here is a reference slide for you to go through all of these stuff that I've talked about. Have blogged extensively on very API specifically. So I've had a list of different APIs, and also on the MDN documentation if you go to web/API. Now, there's an extensive list of all the APIs that are available for you to use.
So I hope that this talk has given you enough pointers to go and...
For you to go and play with those APIs and those amazing APIs and enjoy the rest of the conference.
Thanks for joining my talk.
I'll be sticking around for any questions that you might have.
Thank you for joining and see you around later.
As web applications become more complex, with a corresponding increase in required bandwidth and bundle sizes, to meet users’ expectations the need to consider web performance has never been more important.
Yes, there are third-party tools that can help with performance but what about what is available “out-of-the-box”? In this talk we will look at some of the browser APIs which can greatly assist in implementing techniques to improve web performance.
From Network Information API, to Device Memory and Performance APIs, these are all right there in the browser and a great set of tools with which to design our apps from the ground up with performance in mind and the means to identify where we can focus to help our users.
Tuning web performance with just browser APIs
Yaser Adel Mehraban, Lead Consultant TelstraPurple
New web performance APIs allow us to tune our sites with native tools, rather than having to rely on third party tools.
First of all we should set a definition:
Performance optimisation is the act of monitoring and analysing the speed and interactivity of the application and identifying ways to improve it.
This can be on both the server side and the client side; but this talk focuses on the client side.
The process for web performance is easy: measure some metrics, make changes to the site, then take measurements again to see if it made things better.
Some actions are done in the lab (localhost, dev environment, sometimes third parties) or in production. Ideas should be tested in the lab, tested in production, then taken back to the lab environment to continue improving things.
This is not all about hitting 100% in Lighthouse, it’s about user happiness. Performance optimisations can take a lot of time and money, so if users are already happy you may not want to push beyond that into low ROI work.
Metrics:
- Perceived load speed
- Load responsiveness
- Runtime responsiveness
- Visual stability
- Smoothness
Three reasons to care about performance:
- Conversion
- Traffic
- UX
The classic example of impact is that Amazon found that every 100ms delay cost them 1% in sales… which at their scale meant $330m/pa.
Common ways to measure performance:
- Browser devtools
- Lighthouse
- Third party tools
Monitoring APIs:
- User Timing
- Performance Timeline
- Navigation timing
- Resource timing
- Long tasks
User Timing
- Performance marks
- Performance measures
- Accessed on the
performanceobject in the client side
This API lets you set marks during execution of your code, then create measures between those marks. You can also clear these marks, because these might not get garbage collected effectively so clean up after yourself.
Browser support is good for this feature.
Performance Timeline helps you manage and observe your marks and measures.
performance.getEntriesPerformanceObserver
A PerformanceEntry looks like this:
{
  “name”: “measure-1”,
  “entryType”: “measure”,
  “startTime”: 22.68000000003667,
  “duration”: 0.025000001187436283
}
Again, good browser support for these features.
PerformanceNavigationTiming
- total page load time
- request response time
- page render time
const perfData = window.performance.timing;
const connectTime = perfData.responseEnd – perfData.responseStart;
const renderTime = perfData.domComplete – perfData.domLoading;
Lots of examples of how to use these on MDN
Excellent browser support, although the API might change in future.
You can also send the information to a server in JSON.
const [entry] = performance.getEntriesByType(“navigation”);
console.table(entry.toJSON())
The data is quite rich and you can draw lots of insights from it.
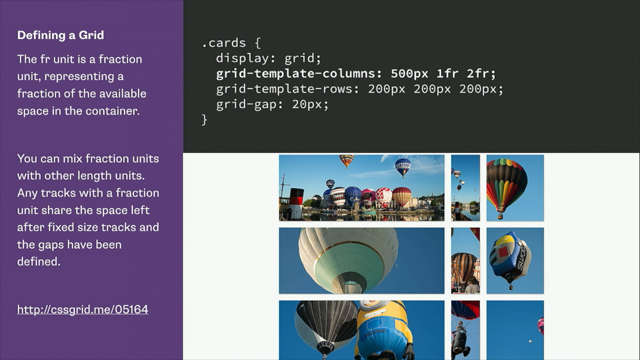
Resource timing – Network request timing
- high-res timestamps (ms)
- resource loading timestamps
- resource size
The last API for today is Long Task:
- Tasks running for 50ms or more
- Culprit browsing context container
- Attributions
This lets you flag tasks that are taking too long, using the longtask entry type.
NOTE this API is in draft, so its browser support isn’t as good as the other APIs.
So let’s say we’ve used all those APIs to find some areas to improve.. there are some more APIs we can use to make those improvements.
- Network Information
- Page Visibility
- Resize Observer
- Intersection Observer
Network Information
- detect network condition changes on the client side
- preload large requests
- exposed via
navigator.connection,navigator.mozConnection,navigator.webkitConnection
Early days so mostly works in Chrome at the moment.
(demo of using this in action, sending lighter images to slower connections)
Page Visibility
- watch for when a page is not visible to the user
document.hiddendocument.visibilityStatedocument.onVisibilityChange
This lets you know if the user is currently using the page or not; and you can do things like pause media, stop pre-fetching data, etc.
Resize Observer
- monitoring object sizes in a performant way
ResizeObserverResizeObserverEntry
This lets you react if the page or container is resized – this gets away from having to manage and debounce the page resize event which gets fired a lot.
Intersection Observer
- Observe changes in intersection of an element asyncronously
IntersectionObserverIntersectionObserverEntry
One example of this is that an element that is initially off screen lower down a page will fire an event once it intersects with the viewport.
Use cases: lazy loading images, infinite scrolling, ad revenue reporting, prevent running tasks or animations.
To set up your intersection observer you will need to pass in some options: root (target element; null for the whole document), rootMargin (space around the target element) and threshold.
(demo of lazy image loading)
- developer.mozilla.org/en-US/docs/Web/API
- yashints.dev/blog/2020/06/22/intersection-observer-v2
- yashints.dev/blog/2019/11/18/network-info-api
- yashints.dev/blog/2019/09/29/navigation-timing
- yashints.dev/blog/2019/09/05/resize-observer
- yashints.dev/blog/2019/08/25/native-lazyloading
- yashints.dev/blog/2019/05/11/offscreen-canvas