The State of JavaScript
(upbeat music) - Hi everyone.
My name is Houssein Djirdeh and I'm the developer advocate on the web team at Google. This talk is The State of JavaScript in 2020, and I hope I can give a decent overview of the language that many of you are probably using on a regular basis. JavaScript continues to evolve and change every year with new APIs updates to the specification, improvement to web standards and so on.
If I wanted to go in depth in the entire landscape of the JavaScript ecosystem, spanning node, web, and other environments, that would probably warrant an entire book. So to keep things focused, this talk will only cover JavaScript on the web. But even with this, we'll still only be scratching the surface. And I hope after this talk, many of you would be inspired enough to dive in and explore things yourself.
Before we start talking about trends and stats, let's quickly address the data source from which this entire talk is using.
HTTP Archive is an open-source attempt to track how the web is built.
And it does this by crawling, analysing and storing data of over 5 million URLs every month. These monthly datasets are massive, as you can only imagine when storing information of millions of sites.
Due to resource limitations however, only one page on each of the websites in the dataset is actually tested by HTTP Archive, and that's the homepage. It's always important to keep this in mind when diving into the data and attempting to come up with any conclusions or patterns, because this is an important caveat.
So it's great that a tool like HTTP Archive is publicly available to anyone and everyone. But how can we actually read data from the project? There's a few different ways.
One of them is by using BigQuery, a data warehouse tool that makes it possible to perform large, big data analysis.
Instead of having to download all the raw data yourself, HTTP Archive is available on BigQuery, allowing you to run complex query on the dataset and resolve them quickly, thanks to BigQuery's processing power.
If you don't feel like running queries yourself, and will like to just see some high-level trends on different aspects of the web, the HTTP Archive website itself also provides many useful reports with graphs that chart all kinds of information every single month.
There are reports for the web as a whole, for JavaScript, images, loading speed, and the list goes on. And finally, there's also the Web Almanack. And I didn't wanna steal the web report created by Rick Viscomi a developer programmes engineer at Google.
It's a comprehensive and detailed report that accurates a lot of information from HTTP Archive, but also combines it with the expertise of the web community in the form of Web Almanack.
The first edition of the Web Almanack came out last year, and there are a total of 20 chapters that cover many different topics, such as page content, like JavaScript, CSS, markup, media, fonts, and so on.
And even the other important aspects of user experience like performance security, SEO, and e-commerce. the whole Almanack is extensive and I highly recommend taking a look if you're interested in understanding the current state of the web.
For the first edition of the Almanack, I wrote the JavaScript chapter with the help of many other contributors and reviewers. This talk will follow the same structure of that chapter, but I've recruited and reanalyzed all the stats and trends for 2020.
All the data used for this talk is from to HTTP Archives, July, 2020 dataset.
We've covered the basis of how HTTP Archive works and talked about how it tests millions of sites every month. But to explain things in a little more detail, however, the data that Web Almanack provides from HTTP Archive and JavaScript chapter and all the other chapters is possible because of the tools used on every CRO. For instance, the majority of the metrics provided by HTTP Archived and consequently, the Almanack, comes from WebPageTest, a popular performance testing tool.
HTTP Archive uses a private instance of WebPageTest with private test agents running actual browsers on desktop and mobile.
But WebPageTest isn't the only technology used. Other tools include Lighthouse, an open source audit tool built by Google and Laplight, a tool for detecting what technologies are being used on a page.
Although HTTP Archive makes up the backbone of the entire Almanack, there are areas that reference real-world user experiences, and that comes from the Chrome user experience report. Now, this is all a brief breakdown of some of the data sources and technologies used by the Almanack, but for the purpose of this talk, we're only gonna be analysing JavaScript data with trues specifically from HTTP Archive, thanks to WebPageTest.
Okay, now that we have a good background of how HTTP Archive can be used to analyse trends in the web, Let's start diving into some juicy JavaScripts statistics. This JavaScript is the most expensive resource we sent to browsers.
having to be downloaded parsed, compiled and finally executed.
Although browsers have significantly decreased the time it takes to parse and compile scripts, downloading an execution have become the most expensive stages when JavaScript is processed by a web page. So how many JavaScripts do we actually use? taking a look at a distribution of JavaScrips bytes per page shows that at different percentiles, the numbers are drastically different.
At the 90th percentile all in site that ship more JavaScript than 90% of other sites.
Over a megabyte of JavaScript is transferred per page. Keep in mind that this is final transfer size. So this stays compressed and minified resources into account.
At the 50th percentile, we use over 400 kilobytes of JavaScript.
In other words, 50% of all sites ship more than 400 kilobytes of JavaScript on both desktop and mobile.
Looking at these numbers, it's only natural to wonder if we're shipping too much JavaScript.
But what is too much? That entirely depends on network connections and devices used by consumers.
One thing that really stands out from this chart is that although we're sending more JavaScript to desktop devices than we are to mobile, the difference is not that significant.
Even at the 90th percentile we're only looking at roughly a 5% difference between desktop and mobile.
Remember a low-end device will need more time to process the sealing on a JavaScript as a high-end machine. Although we just saw that we're not sending that much different amounts of JavaScripts on mobile versus desktop.
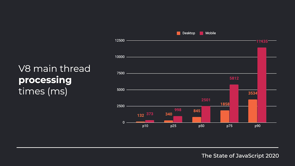
Can we get an idea of the current processing times on the web? We can get an approximation of this by analysing main thread processing times for V8, the JavaScript engine used in Google Chrome. And every percentile processing times are longer for mobile web pages than on desktop. And the difference grows at higher percentiles. At the median, the total main thread time on desktop is 845 milliseconds.
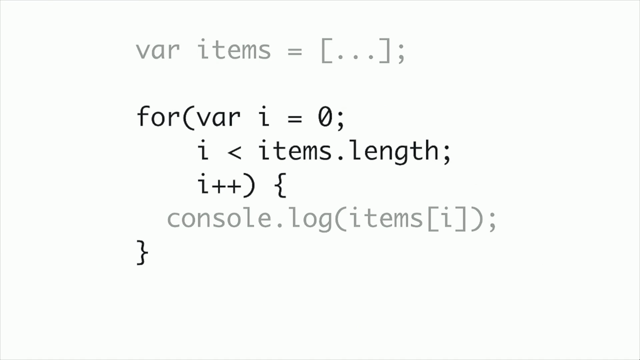
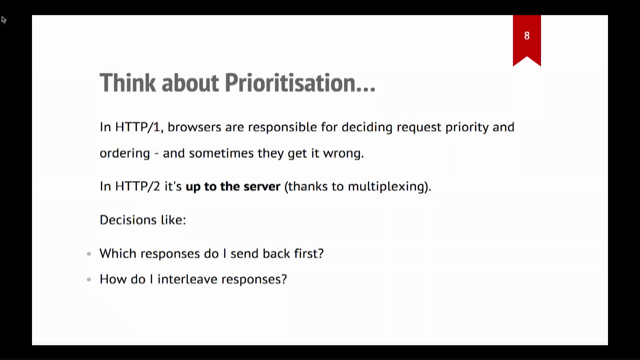
While mobile is at a much larger number, 2.5 seconds. Another avenue we're exploring, we're trying to analyse the amount of JavaScripts used webpages as the number of requests shipped. With the onset of HTTP/2 with multiplexing, multiple requests can be streamed parallel using a single connection over a single origin. Meaning that sending multiple smaller chunks can sometimes improve page load over sending a larger monolithic bundle.
Breaking it down by device client again, we can see that at the median, 20 requests are sent for mobile and 21 for desktop. In all percentiles, there's no significant difference between device type.
To take things a step further, it's important to address how much JavaScript on a web page comes from third-party sources, as opposed to the first-party code that we offer. When we say third-party, we mean JavaScript from any external third-party source, such as ads, analytics and social in media bots for example.
In terms of number more third-party requests are sent than first party at every percentile. And the difference grows at higher percentiles. Just to reemphasize this, we fetch more scripts for third-party code than we do for the first-party code that we offer.
This chart shows results for desktop, but the numbers are about the same for mobile. Now let's look at the difference of first-party versus third-party JavaScript in terms of bytes distribute.
Significantly more third-party code is sent than first party at every percentile. Taking a look at the median over half of all sites ship almost 90% more third-party code than first-party code. And this only further proves that third-party code can be one of the biggest contributors to JavaScript bloats the web today.
Download times are one of the most expensive stages during JavaScript processing.
And resource compression can be one of the most effective ways to minimise download time.
Many hosting platforms, CDNs and reverse proxy servers already encode ACES with compression by default. But is every site compressing their JavaScript code? If you look at the state of script compression today, Gzip encoding is used with roughly 65% of sites and Brotli on almost 20%.
Although the majority of sites are compressing their JavaScript resources, it's still interesting to see that over 15% of sites aren't.
That's a significant percentage of the entire web. Aside from overall JavaScript shipped over wire, there are other interesting data points that we can explore through HTTP Archive, but on the markup side as well.
For instance, JavaScript modules or ES modules are a rattly new feature supported all major browsers that provide a capability to create scripts that can import and export from other modules. How many sites were actually using type module for scripts on their page.
For both desktop and mobile, the number is about .8% of all sites.
So less than 1% of sites currently use NID of model support, which means that many sites are most likely still relying on older module loads like require JS for example.
What about source maps? In many sites, scripts are minified, or even initially used a superset like TypeScript that compile to an output that can look noticeably different from the original source code.
Source maps are additional files that can be used to tell a browser how to map final code output to its original source, which can make debugging and analysing a lot easier. However, there are many people who feel like shipping source maps to production may not be ideal.
I would rather only enable them for the development environments.
There's no right or wrong here and everybody's use case is different.
But I thought it would be interesting to see how many sites actually ship source maps to their production output.
And that number is about 14%.
In other words, for both mobile and desktop, 14% of sites include a source map for at least one script on their page.
Another very interesting data point that I have actually been looking into for quite some time is the usage of certain JavaScript libraries and frameworks in the world.
There are many different tools that can be classified as a library versus framework, and that's a discussion of its own, but React, Angular and Vue are arguably some of the most popular clients that frameworks use today to build single page applications. In HTTP Archive, the usage of either of these frameworks makes up a 6.5% of the entire dataset.
Instead on contrast, 83% of sites use jQuery. Now this is not to say in any way that usage means importance or preference in the ecosystem because that's just not the case.
Most front front-end developers today would not likely use jQuery for a new site that they built. But the very interesting thing about the data is that it shows how expansive that jQuery became and how many sites still use it to some extent today. If you're interested in looking into real world user experiences and data specifically on sites that use frameworks, I built a dashboard called Perf Track that actually dives into this.
Now this is a core part of my work, it's something I find very interesting.
So if you do too, feel free to take a look. The first edition of the Web Almanack was a massive commitment.
There were a total of 93 contributors ranging from analysts, authors, developers and so on. Remember the Web Almanack is an annual report, and we're always looking for more people to help. If you're interested in any capacity, consider joining the team and helping out in the years to come.
I hope you enjoy this talk as much as I enjoy giving it. Again, everything we just covered only scratches the surface.
HTTP Archive and the Web Almanack are goldmines of information that I hope more people can start taking advantage of. My name's Houssein, thank you for watching. (upbeat music)
How are we actually using JavaScript today? Which features are widely adopted, and which less so? What performance impacts is JavaScript really having on page load times?
In this presentation Houssein Djirdeh details how we’re really using JavaScript today.
The State of JavaScript
Houssein Djirdeh, Developer Advocate Google
JavaScript constantly evolves and the full JavaScript ecosystem would probably take a book to cover. So Houssein is going to focus on JS on the web – although it will still only be scratching the surface.
1. Google’s BigQuery data warehouse tool – allowing any query without having to download and manage the (extremely large) raw data yourself
2. Preset monthly reports covering high level trends
3. Almanac – yearly analysis starting from 2019, with community input into the analysis
1. WebPageTest a performance testing tool
2. Lighthouse a performance and profiling tool
3. Wappalyzer which detects the technologies used on a page
Some areas are also informed by the Chrome UX Report.
This talk focuses on the data from WebPageTest.
So much do we actually use? The biggest sites (90th percentile) send over a megabyte even when compressed for final transfer; and at the 50th percentile it’s still over 450k.
The impact of that is seen in V8 main thread processing times, where mobiles are significantly longer; and the gap gets bigger the more JS is sent.
- number of requests shipped – with HTTP/2 more parallel connections can enable faster transfer by sending small chunks
- first vs third party requests – most sites are making more requests to third parties than they are making requests to deliver their own code! This trend is backed up by data showing we also send more bytes of third party code.
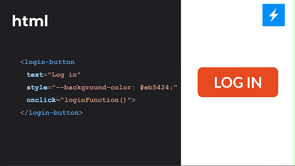
- Less than 1% of sites use
script type="module" - 14% of sites ship sourcemaps in production (for at least one script on the page)
- Market share of libraries and frameworks – React, Angular and Vue make up just 6.53% of sites in the archive, while a whopping 83.16% use jQuery.