(audience applauding) - I am way behind on my book reviews, so now that I know somebody was actually reading them, I'm gonna have to get going, I'm like seven months behind. Does anybody know who this is? Yeah, can I hear it? - Yes! - No, the name. (all laughing) No, I'm, yes, no.
Margaret Hamilton, right? All right, so this is Margaret Hamilton, if you don't know who she is, you probably should because we would probably not be in a room like this, in a conference like this, doing what we do if it's not for her.
Software engineering did not really exist as a discipline when she got started, programming was considered to be significantly lesser than anything related to hardware work or anything like that, and it was her, in large part, that really pushed for software engineering to be a discipline, to be treated as something with a little bit more respect. She's also got one heck of a resume.
In the late 1950s, her husband went to Harvard Law School and she wanted to find a job to help support them and their daughter.
So she saw an opening at MIT and she took it, and her first thing, her introduction to computers was working on building a program that would do weather analysis and prediction inside of MIT. Two years later, she was working on software to detect enemy aircraft. Now, I guess when you get started on weather systems analysis and prediction and move to enemy aircraft, you're probably looking for something a little bit more exciting, a little bit of a challenge.
So when MIT opened up another role to write software to put people on the moon, she switched over into that.
So she started off by writing software for the unmanned Apollo missions, eventually building up to what she is most well-known for, which is leading the team of engineers that built the software that guided Apollo 11 and got Neil Armstrong and Buzz Aldrin to the moon. Now, Apollo 11, the spacecraft was comprised of two modules, the first was Command Module, you see here it combined with actually the service module to make the CSM, Command Service Module.
The Command Module was where the crew sits during the mission, that's where they spend the bulk of their time, it's where they fly out, it's when they make the return trip, they're in there. The service module, which is sort of the big garbage-can-looking part underneath it, that was kind of a dumb box, but very important, that's what housed the water, the electricity, the oxygen, all the stuff, kind of keeps them alive. Then there was the Lunar Module, the Lunar Module is what actually makes the final trip down to the moon once it gets close enough, and it's actually what comes back, returns them to the Command Module so they can make the trip back.
Now, the Lunar Module and the Command Module, it was really important that they get the navigation right and make sure, 'cause there's a lot of variables, they're up in space trying to get people on the moon for the first time, it's a lot of risk here, so they needed like precise calculations, they needed computers that they could rely on. So both the Lunar Module and the Command Module had and Apollo Guidance Computer, an AGC, that was used to help make the actual navigation and do the calculations.
The AGC, by any measurement possible, was far from being powerful.
This thing had four kilobytes of RAM, it had 74 kilobytes of ROM.
Just to put that in perspective, from a RAM perspective, that is 0.1% of the iPhone 11 RAM, that's what we're working with here.
Now, when you have constraints like that, you don't have a lot of wiggle room, you don't have a lot of time to waste bytes. So you can actually grab the code, the code is sitting up on GitHub, an intern from NASA put it up a few years ago, you can download it, and if you do, you'll find that there's a folder for the AGC for the Command Module, and there's another one for the Lunar Module. For each of them, the code inside of it turns out to be about 1.7 megabytes or so.
There's a lot of overlap between the two modules, a lot of it are shared, and that 1.7 is greatly inflated because each of the different modules, or parts of that system, are heavily commented with all the comments that were written out for documentation purposes, so it's actually significantly less than that. To me, that's an incredible feat of engineering. Less than 1.7 megabytes of uncompressed code to program software capable of landing people on the moon. The median mobile site ships 1.8 megabytes of uncompressed JavaScript. (audience laughing) Now, I know it's different, right, different languages, all sorts of different things we could come up with, but I still find that incredibly humbling, 1.7 megabytes of scripts to land people on the moon, meanwhile, 4.2 megabytes of script to let people view questionable dog facts.
(audience laughing) Gotta give a hats-off to Harry for kind of pointing out Imgur's performance issues, he posted a tweet with a waterfall of the mobile site and it's a lot to take in, it's a very, very long waterfall. We ship an incredible amount of JavaScript. And JavaScript is, byte-for-byte, the most expensive resource we have.
The wonderful thing about JavaScript, the amazing thing about JavaScript is you pay a performance penalty at least three times, probably four times, there's a whole memory discussion, we were having this discussion yesterday, kind of with a few attendees and stuff, JavaScript memory, I suspect memory issues are lurking about wild on the Internet right now and we just have no idea because the tooling and the monitoring isn't there yet. So we'll ignore that for now.
But you have the network costs, you have all that stuff that's being passed along the network, that means you've got network transfer, you've got the data costs related to that, you've got the time there, and then you've got the on-device cost because once it's on the device, we've gotta parse, we've gotta compile, and then we've got to execute the JavaScript. So three times we're paying for the JavaScript that we're sending down.
I wanna start with the network quickly.
The median mobile site, if you look at a compression, we're sending down about 378 kilobytes on mobile. This, by the way, and it's not exactly the Web Almanac, everybody's been kind of referencing them, I grabbed the data updated, like the Web Almanac, I think is based on July-of-this-year data, and I grabbed the latest, because I'm just annoying like that.
But I totally was able to cheat because the Web Almanac has all of the queries for each of these things, so I just grabbed the query and my SQL skills suck.
So still hats off to them for pulling this off. But this is what it looks like for desktop and mobile distribution for compressed. Again, this is kilobytes of JavaScript with gzip or Brotli applied to it.
Now we know kind of, there's gonna be a time constraint, right, passing this over the network, but what always interests me is what the data cost perspective was.
There was a great talk at View Source here in Amsterdam a little while ago, by Kenji from Google, and this, I thought was a fascinating little bit of story, this is data that Chrome has from their metrics, it's showing the page-load time for 4G-capable devices in Japan.
And what's fun about this trend, really interesting, is as you see as towards the end of each month, the page-load times continue to get slower and slower, like there's a dramatic and steep difference at the end of each month, and it's repeats consistently. And if you look at similar statistics from them on the number of page loads per users on a 4G-capable device in Japan, you'll see that the engagement goes down towards the end of the month.
So as the month goes on, engagement turns less, people are using the Web less and less.
So what's happening here is data caps are kicking in. Now, in a lot of places, U.S., we've got contracts all over the place in the month, so I don't think you'd see a good at quite as clean pattern, but it looks like in Japan, they must have contracts sort of standardized to start towards the end of the month and towards the end. And so what happens is those data caps kick in, something we've probably all dealt with, you start to get throttled, and as you get throttled, people use it less, the page-load time suffer. I just think it's fascinating because we've sort of pivoted a little bit from data being a number that we like to center on, but this is really interesting, hardcore data that shows that it actually actively impacts the way people use the Web.
Now, if you look at the scripts and stuff, I think Annaley alluded to it, a few people kind of mentioned it, I think yesterday for sure, gzip, like simple compression, stuff that we've been talking about for 14, 15 years, and yet, it's still something that we should be focusing on at least trying to improve that last little bit. The latest run of HTTP Archive shows that 67% of JavaScript resources have gzip applied, 16% have Brotli, Brotli being the newer gzip on steroids kind of a thing, and 17% of those requests come around uncompressed. Now, 17% maybe not terrible, depending on how optimistic you are, for me, that's still a little too high for my liking, and I do run into this fairly often on stuff that I'm working on.
Usually, it's in API responses or things that come back from Amazon S3 buckets, because Amazon has three people post their resources up, and unless you've got CloudFront or some other CDN configured to serve that up and apply the compression on the fly, you have to pre-compress the resources.
So a lot of time people are putting minified but not compressed resources in an S3 bucket and then just serving it without gzip.
It's a really easy thing to zero in on.
Chrome, I am in love with their filtering, and they have this filter that will check for any resource that has the response header contents encoding, if you put the little hyphen in front, that negates it. So one of the first things I do with pretty much every site that I've ever audited, at least since they shipped the feature, was filter this down right away to see we've how many of these are coming across without gzip or Brotli applied.
Right here is an interesting example, actually, this is a script that is being loaded from Pinterest through Google Tag Manager, through some other container, it's like one of those things, you gotto get four requests to get to this particular script, but I noticed just the other week when I was trying to find a good example of something without gzip on, that this was being served uncompressed.
So I contacted, anybody last year saw Michelle in the Pinterest talks and stuff, great, great presentations.
So I contacted one of them and I said, "Hey, what's going on?" And Michelle got back to me, and she looked into it, and it turns out that this is coming from an S3 bucket, they serve the content, or they post it up there, minified, not gzipped, and then they have several CDNs, three, at least, that are serving this content, depending on the scenario, and one of those CDNs, who I will not call out on the stage because this could entirely just be a configuration issue, was not actually compressing on the fly.
So whenever this resource comes across through that particular CDN, it comes across as 45 kilobytes instead of like the 10, or 12, or whatever it was otherwise.
I think they're working on fixing that, but it's not quite there yet.
The good news is whenever you find a situation like this, it's pretty easy, typically, to take care of it from that perspective.
If you've got a CDN, it's a box somewhere, it's a configuration change, it's usually fairly mundane from that perspective, so getting gzip on there shouldn't be particularly challenging to help close the gap there a little bit.
The other thing that's interesting to me here is the 16% Brotli adoption.
Brotli is supported in, if you look at the corner there, it's 92% of browsers. Just as an aside, by the way, if you are using this, I definitely recommend you test your own based on your own data.
You can import Google Analytics data right into CaniUse, and it'll look at your stats and then give you a market share based on your own users. So I recommend looking at that.
Global stats are great for talks, but stats based on your market is definitely better for your own decisions. But 92% of the market share supports Brotli. Brotli is also one of those things, it's not particularly difficult to turn on in most cases, if you've got a CDN that's providing it, it's a box somewhere, probably that you're taking, if you're doing it on your own, you could, again, apply the pre-compression, go the pre-compression route, if you're a MPM kind of person, Webpack has compression, Webpack plugin, there's plugins for Rollup and Parcel, that'll do things. There's an engine X module that will do this for you. Basically, the way this will work is it'll do the compression, it'll compress things in Brotli, and then in this case, we're also creating the gzip-compressed version. Here's where we would upload that to the S3 bucket and move forward.
The one thing, (chuckles) there's one caveat, first off, Brotli does, in general, Brotli is good for performance. And generally, we're seeing around a 20% improvement over gzip, whenever anybody's written a case study about this, but, and there is a big but, Brotli is a resource hog, so if you were doing anything dynamically compressing with Brotli, you have to really make sure that you are set up to support it.
And some of the CDNs can maybe do it, some of the more typical everyday systems that we're running probably can't.
I was talking to Josh Deltener who works at Real Truck, and they tried turning it on dynamically and their response times went balloon, from 300 milliseconds to 12 seconds.
And I actually looked at some.
He ran Siege against it to do some load testing as well off of their production environment, 'cause I was like, "That seems like a lot," and it was a lot.
Even when running Siege with like one concurrent user like simulated, just keep hitting it over and over again, response times on their local machine went from like 0.3 seconds to 2.9, or three seconds like that, for the response. So it is very resource-intensive.
So from dynamic compression, you probably don't wanna do that yet, unless you're really, really set up to deal with the resource hog that it is.
That being said, turning it on, the other thing that, you will get an improvement in data cost, data reduction. Keep in mind that it may not show up in the metrics in terms of like raw performance, like page load or things like that.
LinkedIn reported a 3.6% page-load improvement from their 20% fewer bytes, Instagram saved 20% bytes and saw no improvement that they could say that it was statistically significant at all from a page-load perspective.
Still worth doing, I think.
I suspect if you mine their data hard enough, you're going to find some subset of the users that are benefiting from this and getting an improved experience.
But it's worth noting that 20% bytes does not mean 20% faster for you. So from a network perspective, I'm gonna zero in a little bit more on sizes and stuff here as we move forward, but I kinda wanna now focus more on the device part because the network stuff, it's almost, I don't wanna say like a vanity metric, but it is, to some extent, like a little misleading, like we can say 378 kilobytes on the network, and it doesn't sound too awful, but the reality is that most of the cost of JavaScript isn't the network cost, most of the cost is on the actual device.
Increasingly, the sites that we're building are not network-bound, they're CPU-bound.
And when you look at what this translates to onto the device, it's a much, much larger chunk, it's much more problematic.
So again, going back to our data on the kilobytes of JavaScript that we're shipping down, this is the network cost.
Now, if we figure a conservative factor like, based on the studies of gzip, we're talking about a five-to-7X factor.
Let's go small, let's say that gzip wasn't giving us the greatest compression, we're just going to be conservative with this number here. This is what that looks like on the device. I have one number off, I see there, the P75 looks like that's a little off, so just that down to skew in a little bit.
But if you look at the numbers here, you'll see that we ballooned from that 378 at the median to 1.8 megabytes. This gets worse when you start to look at, if you look at what the frameworks are doing, it's like pages that are using a framework. Well, actually will build to that, first let's do the main thread processing times. So this is the on-the-device cost in terms of the weight, this is what that translates to in processing time. This is based on HTTP Archive runs based on desktop and mobile, this is so we've got like a simulated Android device and a Chrome desktop thing running V8.
During the page-load process, at the 90th percentile on mobile, it is spending 14 seconds just doing JavaScript processing work based on this data, that's a lot of time just to deal with all of these bytes. I also wanna point out the difference between mobile and desktop here, because processing is one of those things, this is a really great argument for why we have to have multiple test devices, why we have to actively be testing on different hardware, because the difference here and the median for mobile is about the 90th percentile and desktop, that's the kind of discrepancy we're talking about. So if we are building on our MacBook Pros, or on our Windows laptops, or whatever it happens to be, we are going to miss almost all of this performance overhead, we're just going to look it over because it's not there for us.
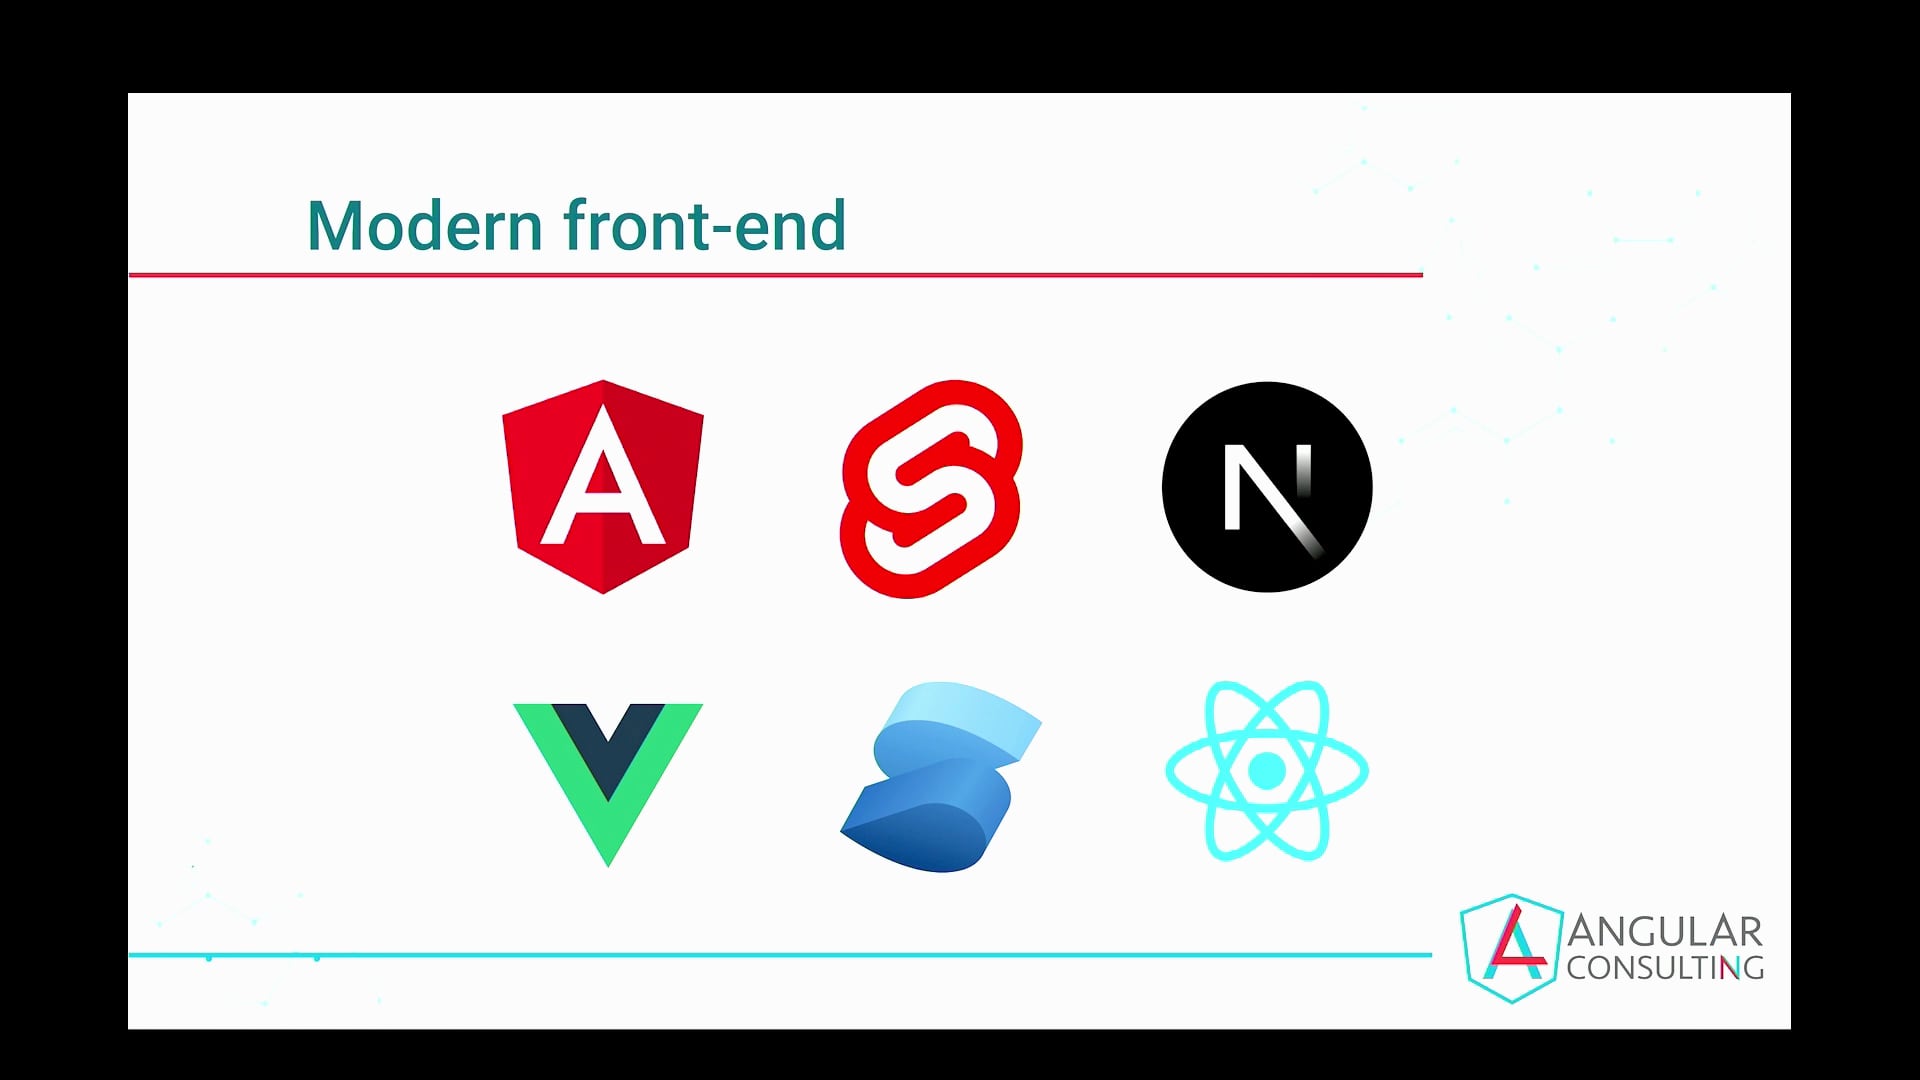
Things that look okay on an actual mobile device are going to be just destroy the entire experience. And here's where I get a little excited, here's where we get the JavaScript framework perspective. This is what happens to main thread processing time as you start to use some of the major frameworks. So the blue is all, that's everything frameworks not framework, so I didn't like take all the framework-generated traffic out of there to like make it look really small or really performance, that's the sites as a whole. With jQuery, you see that there's a little bit of a difference, it's not huge, the 10th percentile, I get that sort of head, maybe that gets the neck, if we're using code alias thing, I guess it's probably the neck of the system here. You'll see that there's a little bit of a difference there like about almost twice as slow, but once we start to get into the 50 and 90th percentile, it's fairly even. What jumps out at me is what happens when we use SPA architectures? View, and in particularly React, that 28 seconds of processing time on a mobile device is scary to me.
But just as scary, even though the number's not as big, is where that 10th percentile is, because again, that should be close to our baseline, that's close to the best that we're getting out of a React application, and we're still spending 3.5 seconds processing JavaScript during the page-load time. Like that, to me, is scary because I feel like it's safe for us to expect more of our tools, I think it's safe for us to say that we should expect our tools to provide a better experience by default, and make it harder for us to regress performance versus in a situation like this where you can't argue it any other way, you're starting out behind and playing catch up from the very beginning. Now, all of this processing translates into long tasks on the main thread.
So (chuckles) this is a thread from a 4X throttle on the MacBook Pro.
If you are ever doing any sort of profiling on your computer inside of Chrome, I absolutely recommend putting a 4X or 6X CPU throttle, even better, just connect your mobile device and do it off of there, but this is a 4X throttle, this is a React-based sites.
You can see the multiple long tasks, anything that's flagged with red, Chrome is letting you know that's a task that takes over 50 milliseconds, which means it's blocking the main thread, it's potentially slowing down any user interaction. This is a fairly common pattern, we're up front on an SPA architecture, you have a massive block of chunk of time that's evaluating that first script, that main bundle, and then you can see fairly clearly here, as you look down this flame chart a little bit, this is all the hydration process, this is React getting up, getting set up, getting everything hydrated. I know there's been work done to get progressive rehydration and things like that, to be more of a thing inside of these frameworks so that hopefully, we can start to break some of this hydration process out a little bit and just do some at a time, I don't know how much of these problems we're inventing, only to have to fix, but that's kind of where we are here. So these long tasks are absolutely one of the first things you should be tracking, particularly if you have any sort of JavaScript different application or site. Observing these is fairly trivial, you use the performance observer.
What we're going to do here is we're just grabbing all the entries, and at the end, we're saying, "Observe for long-task entries in particular." Once we grab one of those entries, then we beacon it off to whatever analytics system we want, so that we can actually parse it and figure out what to do with it.
Now, the interesting thing, I think, with long cast, is I don't think the community has really figured out exactly how the best way is to keep tabs on long task and like how to actually pull that back into user metrics. There's a few different approaches that people are doing. So this is a totally fake thread, doesn't exist, but in this situation, we've got a bunch of different JavaScript execution, each of these chunks is JavaScript execution occurring on the main thread.
From a long-task perspective, we have four of them, we have the 200 millisecond, the 150-millisecond chunk, the 300-millisecond chunk, and the 100-millisecond chunk. The long-task API is not gonna tell us anything about the rest of the execution, just those tasks, partly because you can argue that 40 milliseconds or 30 milliseconds is less concerning from a performance perspective, I guess, mostly because it's a security issue.
If we start to get too granular with timing information, we expose all sorts of issues.
Number of long tasks is actually a metric that is recorded inside of SpeedCurve, they collect that in the sort of the real user-monitoring. I don't believe it's available inside of mPulse, at least I haven't been able to find it.
That's one way you could look at it, like what are the number of long tasks that I have on a given page load? Another way of looking at it is what is the longest, again, another metric that SpeedCurve exposes. So in that case, I'm not gonna see anything for long tasks, all I'm going to get is 300 milliseconds.
So I'm gonna sense that the longest one was this number. Finally, the one that seems to be most common, mPulse calls it LongTask Time, I think, actually, they have it as one word, SpeedCurve calls a JS CPU time, but this is a total of all the long tasks.
So in this case, we're adding all those numbers together, and we see during page load, we had 750 milliseconds of long-task time.
Chrome, interestingly, inside of Lighthouse, which is synthetic, not real user-monitoring, but inside of Chrome, interestingly, they've taken a slightly different approach with their total blocking time.
It's similar, and it sounds like it should be the same thing, but it is not.
Total blocking time doesn't give you the full total of those long tasks, what it does is it looks specifically at the chunk of a long task over 50 milliseconds. So in other words, we're not getting 200 milliseconds for the first one, we're getting 150, 'cause that's the amount of time that it blocked beyond that 50-millisecond threshold. So this is another way of looking at it.
Any RAM provider could also give you similar information if they started to instrument that way, or at least expose the data that way, I should say. I'm not sure yet if I like the total blocking time versus just knowing the lump sum, I feel like I kinda want to know the total, but that's just me.
It's worth trying this out and kind of, if you have access to something like SpeedCurve, or if you have access to the raw data, checking out and seeing which correlate best to your business metrics, in my experience, it's the long task time, JavaScript CPU time, whatever you wanna call it. Typically, there's a correlation between the number of long tasks, even the longest long task has a nice correlation to business metrics, typically, but it can also be a little bit more sporadic depending on the client that I've worked with, whereas long-task time is always related.
This is a chart showing conversion rates compared to the long-task time.
And you can see that the number of sessions, like we peak pretty early when we've got a low amount of time, and as the long-task time gets longer and longer, the conversion rate falls off a cliff.
This is something similar from another client, they use the SpeedCurve, this is the JavaScript CPU time versus the bounce rate, and again, as the CPU time increases, the bounce rate goes up and up.
These are pretty standard typical results, which is why, to me, like tracking your long-task time is like a bulksome is pretty predictable, like Start Render. I feel like Start Render is one of those metrics that almost all of you, if you go back and tie that to a business metric, you're gonna find a correlation.
Sometimes there are other metrics that like go sporadic, but Start Render long-task time, these are pretty safe bets if you're looking for a place to start.
All right, so we know how to measure the long task, we know how to kinda get a sense of how bad things are from that, we know we're shipping too much, the real question is, how much is too much, like, okay, if we all agree that, I hope we all agree, that shipping that many megabytes of JavaScript is not great, and spending that many seconds during the page-load process, processing that JavaScript is not great, how do we figure out what a good number is, what does a good number look like? Let's science it up a little bit.
How many of you have upgraded your phone in the last six months? Okay, keep your hands up, in a year, two years? All right, now we've got most hands up.
In the U.S., the average U.S. consumer upgrades their phone once every 32 months, almost a full three years, they go without upgrading. So there's a lot of old phones that sit around. So when we're looking at specs of something new, like, even relatively new, the Pixel 3, I haven't quite done the Pixel 4 thing 'cause I've heard bad things, but, like that's a pretty new device, that's a pretty powerful device, but those specs are gonna be far outweighing anybody that like most U.S. consumers are going to be doing. The average purchase price of a smartphone, according to Statista, is $214.
And that number is greatly inflated by the number of iPhones, like the number of people who have had to take out a second mortgage to get one of those.
You pull that out, the cost drops quite a bit. Again, if you would assess by like an audience like this, that maybe the iPhone adoption is pretty high, but that again, turns out not to be the case. Globally, according to the IDC, 85% of shipments of mobile phones that are being purchased, or 85% of them, are Android devices.
So if you were just going to throw out a guess and say, "Okay, what is an average person using the Web "coming on to us, "like what are they using to access the Web?" you'd have to say it's an Android device, it's at least a year old, that's actually a pretty conservative estimate, and it's probably 200 bucks or less.
And you can confirm this.
One of my favorite things to do for picking out test devices is go to Amazon and look at the best sellers. And this was when I pulled the, like this is like a month ago, maybe, when I looked at Amazon for the best sellers in terms of cell phones in the U.S..
I really like the $29 TracFone, 'cause that one's gonna perform really, really well, but yeah, you have to go to like the eighth most popular device to get something that's actually $200 or more here. This is always a great place, again, like I highly recommend testing on real hardware, getting yourself a nice little device lab and test devices to put things on, huge proponent of testing on the crappiest, cheapest device you can possibly do it.
The more powerful device, the more likely it is to hide all of these performance issues that we're missing right now.
So if we start with that baseline, that $200 a year-old Android phone as the device, Alex Russell did something similar, and then he added in, let's say that it's a slow 3G network, based on the number of connections that people are using to access the Web globally, that's a lot of 2G, a lot of 3G stuff, even in the 3G and 4G situations, often that times that network is throttled or congestion is slowing things down.
So if you start with these numbers, Alex did some math and figured out that that means that if you wanna hit a four-second time interactive, if you want your page to be available and ready to use in four seconds, you have about 130 to 170 critical path resources. Now, that's not including images, like you're getting a little bit of like leeway here, that's things like CSS, HTML and JavaScript. That means like from a JavaScript perspective, you don't even have this much available to you to hit that kind of a target.
The more JavaScript you have, the less your overall budget should be in this case, but I'd say fairly conservative, like, I'm trying to be nice, maybe we got 100 kilobytes of JavaScript that we can use, again, that's all over the network in this situation, but maybe we've got 100 kilobytes of JavaScript we could pass down and get interactive within that four-to-five-second range.
So that would be the aggressive, but hitting that sort of median range, if we wanna have a decent performing experience in terms of overall size of the JavaScript for an entry point.
But what about the individual bundles, that's the other thing I hear a lot, like as people are doing, anybody who's got a React view, something with Webpack, Parcel, Rollup, right, that's spitting out bundles, like a lot of you, okay. So the other thing I hear a lot is like, "Well, "what should we be targeting "for the individual bundle sizes?" And again, I think we can kinda science that a little bit by looking at script-loading behavior, particularly in V8. So what happens, right, so we're parsing along the HTML, we come across the script tag, we make a request for that script, and then we have to parse and compile that script and execute it, right? So that parse and compile, which traditionally has taken place on the main thread, causes a little bit of a bottleneck, we don't want to have to wait for that to happen for people to be able to do user input, that's a whole chunk of time that people can't do anything. So most, like V8's doing it, in certain situations, if the script is above a certain size, SpiderMonkey over and Mozilla is doing it as well, they're pushing that parse and compile off onto a separate thread.
This at least opens up the main thread during that parse and compile time, so that if the users are going to interact with the site in any way that it's gonna be able to respond.
But the one thing that was always troubling about this, right, is that you have to wait for the entirety of the script to actually be downloaded before the parsing can occur. So if we have a 200-kilobyte script coming down a 200-kilobyte bundle, that entire bundle has to be downloaded before the parse/compile happens, and then we've got the execute after that.
It doesn't have to be that way anymore, script-streaming, which is something that V8 does, is not something that SpiderMonkey does, they've talked about it, but they're actually in the midst of like building out a whole new parser, so they've kind of deprioritized that for now. But with script-streaming, what's happening is you're actually getting chunks of that JavaScript back, right, and so what script-streaming says is, "Let's not wait until the entire thing is down "before we start parsing," like parsing JavaScript is a fairly linear thing, "we can wait until we've got about 30 kilobytes or so, "and once that 30 kilobytes arrive, that's when we can start "kicking off the parse and compile." So we can parse and compile like in parallel to a lot of the download time.
This means that, and parsing is pretty quick now, so this means that often, by the time that the JavaScript is downloaded, we're pretty much able to execute very quickly after that. Where this gets really interesting to me, is when we put them in like combination, this idea of being able to do the parsing on the fly and being able to open these up into separate threads so they're not on the main thread doing the activity, because now what happens is inside of V8, if there's request for two different scripts, and those two different scripts happen to be in a way that we can actually put them off-thread, like async, defer, I think they're trying to do that with synchronous scripts, although I believe certain situations they don't, somebody from V8 or Chrome can correct me after. But what will happen here is, we'll actually open up two different threads, each of these threads will be responsible for parsing and compiling both of these scripts. So we can now parse the two scripts kind of in parallel as they're writing back from the network.
This means that instead of having one 200-kilobyte bundle, it's probably advantageous to us to actually have two slightly smaller bundles that are being pulled off and then parsed, potentially in parallel, as that content is arriving. So realistically, if we're talking about what our bundle size is, we should be looking at that 30-kilobyte sort of limit, which is where the script streaming kicks in, and figuring out like, how close can we get to there without going, like there's a little bit of overhead anytime you're doing something like this, so I don't know if 30 kilobyte itself is like the most optimal target.
So I'd give a little wiggle room on top of that. So I wanna make it very clear though, the thing here to say is not, the takeaway is definitely not inflate your scripts so that you get script-parsing, like streaming, that's not that takeaway in any way, shape, or form, smaller is always better, but if you are trying to get bundles to maximize like the potential of streaming and all of this stuff for the parsing, you probably wanna keep it within that 50-to-100-K range. If you start to go up above this, you probably wanna start breaking those out again to more manageable sizes so that you can get some of that parsing in parallel again. So that means we're looking at a setup of probably 100 kilobytes in total, and somewhere to 50 to 100K for each individual bundle, that's what we should be targeting.
Is anybody looking at this right now who has their own codebase and you're like ready to kick me off the stage, right, like you're feeling like cold sweat's kicking in? These are great numbers.
If you're in a situation now where you're like, "Hey, we're gonna do a real architecture tomorrow "and start ship, like, start from scratch," great, put something like this and then try to hit those goals. Most of you are not in that situation, most of us don't get the opportunity to do a complete fresh reset, most of the folks that I work with are on the very opposite end of the spectrum, they've shipped something out with multiple megabytes of JavaScript, and we have to chip away and chisel away at that iceberg to kind of break it down.
So I wanted to go quickly, there's not enough time to like give you a comprehensive how-do-you-reduce-the-size-of-your-bundles, because frankly, that's a multiple-day kinda topic, there's a lot of different avenues to explore, but I wanna give you one example of one company that we worked with, who started out with a 2.6 megabytes vendor bundle in their Webpack application.
So 487 kilobytes on the network, 2.6 megabytes when it was actually on the device and needed to be parsed and executed.
As you can imagine, this meant that we had a nice long, massive evaluate script, long task early on, it was really slowing things down pretty dramatically. I am a huge, there's like five, six different tools, I don't know, that you can use to like analyze Webpack bundles, and there's similar tools for Parcel and Roll up, my favorite is still Webpack-bundle-analyzer, it gives you this beautiful color interface that you can kinda click around and get a feel for, and the boxes are all sized by the weight, to give you some sort of a understanding of how big things are.
And the first thing that jumped out right away in the vendor's bundle is this AWS SDK, which is yeah, that's 1.8 megabytes, by itself, as the parse size and gzip size 245K.
AWS SDK does not support tree shaking.
So all the stuff that those bundle things are trying to do for you, like to shake off all the code that you're not using, it doesn't work here because they're using common JS, so we can't tap into that tree-shaking functionality. It turns out that in their documentation, on a page in the middle of their long list of different pages, and in the middle of that particular page, there is a one-liner, about pulling in just what you need, and that you can just pull in the actual service itself and it won't bring in the entire AWS SDK library. So for us, what that meant is switching from this, where we were importing the actual AWS SDK, to requiring just the individual service provider that we actually needed.
We made this change, literally like a two-line change, I think we changed one more thing later on in the file, and that drops from that 1.8 megabytes down to 194 kilobytes, for the parse size.
That was, just to reiterate, that's like a 1.6 megabytes saving from a one-line change inside of your editor. So it pays to read the documentation, even if that documentation is extremely verbose, and the information you need is hidden very, very deeply inside of it.
I think if you have a very large bundle, it's likely that you have some low-hanging fruit like this, I'm often able to find like a few hundred kilobytes pretty quickly through something like that. Most of your optimizations though, in the long haul, are not going to be such a big long, like massive chunk all at once.
So from there, we kinda chiseled down the rest of it like, we looked around, vue-apollo was looking like that, it was a little heavy at 52 kilobytes, we thought that seemed a little excessive.
We went over to Google, this wonderful tool, where you type in search query and tells you what other people are looking for, and we found out that everybody had been complaining about this. And so on GitHub, there was actually work already been done on a newer version of the library, that actually what they did is they took some of the dependencies, some of the dependencies that vue-apollo library depended on, and they have a roll-up build.
And what they were saying is, "Let's mark these as external, "like, instead of bundling this "all inside of that one library, let's make it "so that this stuff can be externally included "so that Webpack, or Parcel, or Rollup, or whatever, "has the opportunity to install, and tree-shake, "and make sure that you're not pulling in "duplicate versions of things." So we just upgraded the version.
We had to upgrade nuxt Apollo, this was a Nuxt application, and nuxt Apollo was what was pulling in vue-apollo. But once we did that, that dropped that down to 27K on the device, so a 15K savings right there.
The other thing that really jumped out is they had this ui.com and .js.
This is a Storybook, UI components, very popular, and again, this in particular situation was a view application, so this was a vue-storybook instance.
And they had all these components that they were pulling in and it was creating a very, very big file.
So we ran Webpack bundle analysis on the actual vue-storybook instance itself, and it became pretty apparent why this was so large. Vue-swiper-js is massive, it turns out, but you'll also notice the actual components are a small part of the weight here.
What we have is we're pulling in mostly vendors and then the vendors that we are pulling in, we're pulling in duplicate copies of them.
We've got core-js included twice, we've got I think, Vuetify, Lodash, we've got multiple things that are coming in multiple times over the course of this bundle, and it's all getting pulled into this one lump JavaScript file.
So when the Storybook instance is being consumed by the main application, there's no intelligence there, the main application cannot say, "Hey, we're already using vue-swiper elsewhere, "let's not pull it into this bundle, it's already there, "there's nothing you can do about it." So we needed to prune this down, and so that the main application could actually make the decisions about what libraries to pull in, and stuff like that. So the first thing we did is, for the core-js, yarn and NPM deduplication was not working for us so we used Webpack aliases to resolve the core-js library to one instance. So what this is, is anytime anywhere in this application that we pull in core-js, we want it to resolve to the core-js that sits inside of node modules directly.
That way, if there is another dependency that's pulling in as a sub-dependency, we're not gonna include that library at all, it's always gonna go to this one.
This alias thing, by the way, is the same way that if anybody he's ever done anything with Preact, this is how you pull Preact in instead of React, you alias to Preact, and pull that in.
So the other thing that we wanted to do is, again, the vue-swiper was huge, it turned out, we already use that in the main bundles, the main application, we also had all these other vendor bundles that were duplicate code from the main application, so we wanted to mark all of those as like, let's not include that in the bundle. So again, going back to the Webpack configuration, similar to what Rollup was doing with the vue-apollo thing there, we have the externals declaration where we're saying, "Hey, all of these libraries, don't put them in the bundle, "we don't want them there, "we're marking these as external dependencies," which means, "hey, we're getting this from somewhere else, "Webpack, don't worry about it." This could work for, for example, if you're loading, you shouldn't, but if you're loading jQuery from like a third-party CDN directly in your site, then theoretically you can mark it as an external dependency Webpack ignores that you're good to go, that kind of thing. In this situation, we were already pulling in these libraries in the main application, we don't need it here, so we marked 'em as external, and these two changes to the configuration reduced that by another 59K.
So from just this short little list, we were able to go from a 2.6 megabytes on the device down to 898, a 66% reduction.
Now, as you could probably guess, I'm not happy with like 898, I'd love to go a lot smaller than that, but the rest of this is a process, like we've taken care of a lot of the low-hanging fruit. Now we've got things like being a little bit more intelligent about how we're handling that vue-storybook instance, so that we can do a little bit more intelligence on the Webpack side of things to be able to weed things out again, we have some refactoring of the actual components themselves, they're still a little hefty, we have a little bit of change that we're gonna be doing on some of the bundles, as far as the main application, to sort of approach the splitting a little different, like lazy-load a few components here or there, it's an ongoing process.
There are very few overnight success stories when it comes to this kind of thing, it's really about maintaining and iterating. And this part is, to me, one of the most important things, like I've done a ton of audits, I've worked with a lot of companies, and it's always deflating when you make these massive improvements, and then it regresses, like if you're not doing things outside of just fixing those issues, those performance issues will come back to haunt you. So it's critical that you lay down the groundwork to make sure that, "Hey, if we've got this weight off, "let's keep it off, and let's help us "get to a point where we're even lighter." To me, I'm like, "Let's go all over kill mode." So from my perspective, this is the way I like to do it, in an ideal scenario, an ideal workflow, you are warned or blocked on install, if the bundle is large, you are warned or blocked in your code editor, you are blocked on PR, you are blocked on deploy and you are tracked on deploy.
And yeah, I know it's a little aggressive, but that's the way I like to do it.
Like, to me, the more checks and balances you have in place, the better, and the closer you do it to the point where the developer is about to start writing code, the better. If I'm at the point where I'm deploying and that's the first time I'm running into anything that gonna block my system, I've probably written a crap load of code at that time, and now you're suddenly telling me like what I've done is too slow, and I've gotta refactor it all, I'm gonna miss deadlines, everything like that. If you catch me right away, when I'm like, "Oh, I need to write this thing, let me install AWS SDK, "oh, crap, it's like 350 kilobytes," I'm gonna be able to figure that out right away before I've ever written a line of code.
There's a lot less lost time and energy and resources there. And the nice thing is, all of these are realistic options, you can do all of these things, relatively easy. Is anybody familiar with Bundlephobia? So Bundlephobia is a really nice site, I love it, and I particularly like all the things that are built on top of Bundlephobia, but Bundlephobia lets you look up any NPM modules or bundles and you get information around like what is the size, what does it look like when it's gzipped, is a tree shakable, and just as importantly, you get to see similar packages and get kind of a feel for like where their weight comes in. So one of the things you hear a lot if you've ever talked to anybody, like seen a talk on this kind of stuff, like bundle analysis, or read anything about this, they'll talk about like moments and swapping moments out for date FNS, or something like that, Lodash is another one that gets picked on a lot. But this makes it very apparent.
So if, at the point that I'm looking at potentially trying to pull in a module to do something, I'm getting information about similar modules that might be laid to wait, I can use that to help me make my decision. But again, it's the tools that are built on top of Bundlephobia that have me really excited.
There's a bundle-phobia-cli, and one of the things you can do with the cli is you can have this Bundlephobia install command, you can actually alias this so that instead of running NPM install, you're running bundle-phobia-install, and what this does is it will first, before it ever installs it, it will enforce a limit on the size.
So in this case, the size threshold is 100 kilobytes and it's saying, "Wait, no, "the library you're trying to pull in is 375K, "I'm gonna break it, you can't pull it in." These limits are configurable inside your packaged JSON file, so you can have your own custom limits for your team. Like I'm not going to pull in a third-party component that is larger than X.
If you want the ability to overrule that sometimes, you can also run that in bundle-phobia-install interactive mode, that's that -I, and that gives it more of an interactive situation where you can say, "Yeah, you know what, "I'm still okay with pulling it in." So AWS SDK, I think, is a valid situation where that might be this case, you might need to use the AWS service unless you're using Cognito stuff, there's not really an alternative library that works really well, so you might need to overrule that budget in this situation.
But at least it's a little bit of friction, it's something that's stopping you from just haphazardly, NPM-installing 500 kilobytes of script.
Inside the editors as well, VS Code, there is import cost, which is built on top of Bundlephobia, so whenever I'm importing something inside of VS Code, I'm seeing right away what I'm adding to my application in terms of weight, so again, if I've somehow managed to make it past install, or if I'm dealing with components or modules that were there from beforehand, I'm still getting alerted about the information there. Then, of course, having it on the PR side of things, like bundlesize, bundle-buddy, there's all sorts of different options there for what you can easily hook up to your GitHub instance or your continuous integration environment, and they can warn you when you are exceeding a bundle and break the bill, break the PR, that kind of thing. It is critical, you'll note here that they have a threshold, like a four-kilobyte threshold, don't underestimate the importance of having a threshold. I've talked to one company who was really excited because they they were like, "We've rolled out a thing "that breaks the build "if it goes over like the bundle limit." And I'm like, "Oh, that's great, yeah." And then the first developer who ran into it broke the build by 82 bytes, because I believe just a rounding error.
So they fixed the rounding error and then the next person broke the build because the sub-dependency somewhere added one kilobyte of script to their thing. It's okay to have a little bit of a threshold for those sorts of situations just so that like you're not running into one or two kilobytes of a third-party dependency being pulled into your application because of a new version suddenly causing everything to break.
I think that's okay, you just wanna watch it so that it doesn't creep up.
So I do have like a hard stop at some point, but you keep a threshold for at least the everyday work. So to me, it's all about introducing this friction wherever we can, because the default stance matters. And our default stance right now makes it way too easy to add more and more JavaScript to our sites and applications.
We need to flip the script and make it difficult to ship something that performs badly and easier to ship something that's more performing by default.
'Cause we built a Web that largely dismisses the affordable typical smartphones and the people that use them.
And I don't think we've built it that way because we're bad, not all of us, no, I don't think we've built it that way because we're bad people, I don't think we built it that way we don't care, I've yet to meet anybody in all the years that have worked that was like, "I don't care if the site's crap, "I just wanna ship stuff," I don't think anybody's ever vocalized that to me, but it happens because we can, because the hardware, the networks, the things that we work on, we don't notice the issues, and the tools that we use don't make it very apparent that there are a problem, we do it because we can.
So I'm all about bringing back those constraints. Our technology doesn't constrain us enough, so we need to enforce those on ourselves, we need to provide those constraints through budgets, through alerting, through those checks and processes, encouraging us to chip away at the piles of the script that we're sending down right now so that we can create faster, lighter experiences by default that stay that way.
Thank you.
(audience applauding) - [Tammy] (mumbles) Okay.
- I'm walking away from him.
- All right.
Thanks Tim, that was awesome.
Okay, so we've got a few questions.
- Bring it. (Tammy laughs)
- The first, has Tim been working out? We can skip that one, obviously, obviously. - All right.
I was gonna say I'm giving somebody a 50, who was that? - [Man] It's the tight sweater.
- Yep.
- Okay, so, moving along, somebody asked, "Doesn't the the Japan data caps chart "suggests that we are still data-bound, "maybe in addition to CPU?" - Yeah, so I think it does suggest that we are data-bound, which I think is something we're significantly overlooking right now.
I think it's great that we've moved away from traditional metrics like page load and stuff as we've started to recognize that those aren't very representative of the user experience and that there are other metrics that give us better insight there, but I feel like data sort of got swooped in, not like on purpose, but just maybe it was because of all the perceived stuff, it just kinda got forgotten a little bit to some extent. I do think it suggests that we're data-bound that there are still lots of areas in the globe, lots of people under certain situations and types of contracts where data is a primary constraint for their ability to access the Web reliably. That being said, if that was, when I mentioned that I thought most sites are CPU-bound, I think that's still the case for the dominant amounts of people coming to those sites and applications, that it's still probably, in most scenarios, most of the sites I profiled, the issues, the primary issues are now on the device. Like there's a bunch of network stuff that can and should be taken care of, but the bulk of the page-load time is spent with the JavaScript processing and all that kind of stuff.
So that's where I think the CPU-bound stuff comes from, but 100% agree that data is absolutely still an issue. - So someone else asked, "How were you able to notice "that the AWS SDK did not support tree shaking?" - Because it wasn't working.
(all laughing) We pulled it in, and we were trying to do everything that was right for anything like that, but if you're receiving the full library coming in there, like there was nothing broken down about it, it's the full distribution, the AWS SDK is a little less obvious than like Lodash. Like, if you pull in Lodash, without tree shaking, it's very apparent in Webpack-bundle-analyzer because you see a big box that says Lodash, and that's it. Whereas with tree shaking enabled, you see Lodash, and then like little boxes for all the different parts of Lodash that you're pulling in.
So AWS SDK is not bundled the same way, so it wasn't quite that obvious from that perspective, but it was just more like, we're pulling in 1.8 megabytes of script.
If that's with tree shaking, it would have been really bad, yeah.
- All right, so we're out of time.
- Okay. - But you're easy to find.
so people can find you. - I am surely, yeah.
- During the break, so in here around.
So thanks, Tim, that was awesome.
- Thank you. (audience applauding)