Lessons learned from performance monitoring in Chrome

(applause) - Hi everybody, I'm super excited to be here. This is such a great conference.
Thank you all so much for coming.
So first I want to give a little bit of background on myself. My computer is- Okay, so I just love this framing that Emily had yesterday. So I asked if I could borrow the slide.
I, years and years ago, used to be a front end engineer, and I worked on web performance.
And I got to do web performance for Google Docs and Google web search, and it was tons of fun. But then, eight years ago, I moved to this mysterious Isle of Browser Vendor. And I still work on performance, but I've been doing it in definitely with a different point of view.
So I wanted to tell you a bit about the work that I've done. And take a trip to my little corner of the Isle of Browser Vendor.
So what is my corner? I've worked on mostly for several years, I lead performance testing in Chrome.
And recently I trained, change roles, on to the Chrome speed metrics team.
And that's the the team that tries to make performance metrics, not just for Chrome, but also for web developers, like first contentful paint, largest contentful paint, time to the interactive, things like that.
So here's our agenda for our trip to the Isle of Browser Vendor, or just my little corner really, there's a lot going on in this island that we really won't be able to get into.
So first we're going to talk about metrics and the work that the speed metrics team's done. Like, what makes a good metric? What are the use cases for our metrics? And I'll go over an example of developing one of these metrics.
Then I wanted to go back and talk about, once you have a metric, you want to monitor it, you want to monitor it in the lab, and you want to monitor in the wild, and go over a little bit about the lessons I've learned over the years. Another thing that I've done is when regressions slip through our lab, try to help figure out how to track them down in the real world. So some things I learned there as well.
So let's start with metrics.
So you're probably familiar with this, it's just the Chrome Dev Tools performance panel. We have our own performance tool, but it has a lot more information that's just confusing. So I thought this got the point across really well though, is that if you think about metrics you can make there's so much in this panel you could measure. Like how much time all those different subsystems, all those different colors are different subsystems. How much time was spent in each? What are the long tasks? When did the layout and paint occur? How many bytes of JavaScript? How many network requests? It's really overwhelming.
And in fact, in Chrome, we have actually thousands of performance metrics. So the thing that we've been working on the most over the last several years is really focusing down on really good top level metrics, and trying to get the whole team and eventually web developers rallied around those. So what is a good top level metric? First off, we really want to measure key user experiences. We don't want to measure just numbers that don't necessarily maybe they correlate to the user experience, we want to measure the actual user experience. And the experiences we're most focused on right now is loading web pages, responding to user input, and smooth scrolling and animations.
So I'll talk a little bit about what we feel, after working on this space for a couple years, makes a good top level metric.
There's a bunch of properties, and sometimes they can really be at odds with each other. So we try to keep these in mind when we're doing designs. First, and most importantly, a metric should be representative of an actual user experience. So I'm using representative in this sense to mean, what are we trying to measure? Are we trying to measure, some good things to try to measure might be like, how long does it take to respond to a user input? Something that's not as representative is like, how long does it take to parse the HTML? Second, they should be accurate.
So if representative is about what the metric aims to measure.
Accurate is how well it does that.
So we use a lot of filmstrips in measuring accuracy, like looking at, runs of various sites.
And we do a lot of studies of larger amounts of data to validate.
Next a metric should be interpretable.
That means the value of the metrics should be really easy to understand.
So for example, if I told you that the main content of your site loaded in 500 milliseconds, but then it took two seconds to respond to the first input. You don't really need to know much about my metrics to understand that first input was a problem, but the site displays content pretty fast.
So one thing that's interesting is that a metric can be interpretable without actually being simple. Simple as about the way that the metric is computed. Speed index, for example, is not that simple. It's the average time of things displaying on the page. But because it's a time and a point in time, you can kind of understand what, it is even if you're, you can understand how to optimize it, even if you're not fully certain why it's at that exact point and not like two milliseconds left or right. I should go back actually.
Why is it important for a metric computation to be simple then, if can be interpretable? The reasons are, there's a couple, one is that if it has a complex implementation, every time that you have to add to it or improve it, or handle an edge case, it gets more and more difficult to fix things, just like any other type of code.
The other thing is ideally that we will be able to give these to web developers. So part of that would be going through the standards process and making sure that other vendors were able to implemented it.
The simpler it is, the more possible that is. If the other vendors were not able to implement it, we want it to be polyfilled.
And the same thing, it has to be simple.
Next, a totally different thing.
The metric should be stable.
For us, this means that, let's say you have the same web page and the same version of Chrome, everything's the same, you run the metric 100 times, you should get very similar values.
If your values are bouncing up and down, there's a lot of noise in the metric, lot of variation, it's going to be really hard to tell if there's a change in the metric.
Did you make it better or worse, or is it just noise? Related, but not quite the same is whether a metric is elastic.
So if a metric is elastic, a small change in performance corresponds to a small change in the metric. And a large change in performance would correspond to a large change in the metric.
Some times when something is not elastic, it's because of what we call a cliff in the metrics. So for example, time to interactive, we're looking for the time when, so we say like 50 millisecond bits of JavaScript, that's okay. But more than that is not okay, the pages is not interactive if you're gonna try to click. So what if a page has something that's going between 49 and 51 milliseconds? That cliff of 50 can really change the time to interactive and make it not elastic.
Next, ideally, a good metric is real-time.
This can have a couple of meanings.
First, it just, the overhead of the metric can't be so high that it's not possible to calculate live.
So for real user monitoring, if the metric overhead, if it takes 10 seconds to calculate, we're not going to be able to report that.
Another possible interpretation of real-time that we have to think about is in a Web Perf API context, can it be calculated before the page is unloaded? For example, what if we wanted to give you an API that told you the longest delay for user input? Every time we get an input, we know it's the longest one so far.
But until the page is unloaded, we don't know which one was definitely the longest. So we have to think about that as well.
Next, good top level metrics, we say there should be as few as possible.
They should be orthogonal.
We just mean that they should be different. If we have multiple top level metrics measuring the same thing, that's a real waste of energy. So now I'm going to go over the use cases we have for these top level metrics.
First off, the lab.
We were running benchmarks either locally on your machine to debug and improve performance, or we're running them on continuous integration. One thing to know about the lab is that there's a lot less data generally than there is for real user metrics.
And that means that it's very, very important that things be stable and elastic.
A big value of the lab is being able to really reproduce and pinpoint changes in performance. And the more stable and elastic a metric is the better it is for lab.
Sometimes that puts it in odds with being simple and interpretable.
Lab metrics do not require real-time.
So let's say you take a trace of Chrome, and then you spend 10 minutes processing and you get your metrics, that's maybe okay for the lab. You have to have some kind of movement on your continuous integration.
But the time can be a lot longer than it can be if you were in a Web Perf API or RUM context. One thing that's really complicated about the lab is understanding performance of user input. And so, you might think, okay, we want to see how long it takes to respond to a click. We'll load the page, we'll wait be three seconds, and then we'll click.
Then you have this arbitrary three second rule for clicks. And when people regress your metric in the lab, maybe they'll say like, "Oh, wow, it's really important "that I don't do extra work before three seconds, "I'll move it back." And they're not trying to game the metric but it'll shift the way things perform anyway. Maybe three seconds wasn't the right timing, maybe at 2.5 seconds, or 3.5 seconds, there's this big chunk of work, in that your page is actually not responsive. So you can think about different ways to handle this like, well, what if we randomize when the input was, Oh, no, that our metric is not stable, it's going to vary when the input was.
So the way that we actually handle this is we try to think of ways to look at, what are all the possible times when the user could have produced an input? And what was blocking the main thread at that point in time. So that's how we come up with metrics like time to interactive and total blocking time. The next use case is Web Perf APIs.
So Web Perf API is an API that web developers can use in their web page, or that our analytics providers can put into JavaScript so that more people can access it.
It's really, really critical that when we expose something to Web Perf API it's representative and accurate. It's a big cost to telling developers there's, an important performance metric if it's not going to be actually important or accurate. It needs to be real-time, it's just not really possible to make an API where it's not real-time.
And you do have a large volume of data.
So you could sacrifice some interpretability, or stability or elasticity.
But again, it's critical, they be simple, so that other browser vendors can implement and they can be polyfilled if possible.
Clear definitions are really critical too.
The last use case is our own real user monitoring. So the Chrome user experience report actually comes from Chrome's real user monitoring where we're trying to understand, how does Chrome perform in A B tests? How does Chrome perform just overall in the wild? And of course, we still care that metrics are representative and accurate, but we have a ton more room to experiment.
We could just mark a metric as experimental, and look at outliers as they come in and try to understand it.
So we can do a lot more frequent integration with internal real user monitoring, then we can with Web Perf API.
So that was a lot about metrics.
I wanted to give an example to clarify some of the things I'm talking about. The example is the largest contentful paint metric my team developed recently.
So first, we have some very key moments in the the page load.
This is the user experience part of the page load that we're trying to measure.
First off, something paints on the screen.
This pages is probably going to load, something is happening, I clicked the link. That's currently captured by first contentful paint. Then the main content of the page is actually loaded. I can tell if this is a useful web page.
And finally, I can click on things.
I can interact with the page scroll.
That tells me more if it's usable.
So the goal first contentful paint is to really figure out this main content loaded part. Can we get a metric that gives us that? There's been some prior work you're probably aware of in this area.
The first metric is speed index.
It's the average time at which visible parts of the page are displayed. It's representative and it's accurate.
It's really interpretable because it's a point in time. One really awesome thing about using the average time at which visible parts of the page are displayed, is sometimes you have a race condition between one piece of the page or another, or you'll have some shifting in the page.
And this really smooths that out so that it makes the metric very stable and elastic, which is super cool.
In fact the only thing I don't like about speed index is that it's not real-time.
We've tried to put it into Chrome directly and we just can't maintain it in an efficient low overhead way. So another attempt at this is the first meaningful paint metric.
This metric is a heuristic, it's kind of complicated. We take the first paint after the biggest layout change in the page as representative 'cause we're trying to figure out, when is the main content displayed? It's interpretable because it's a point in time. And it's much faster, it's real-time, so that's really great.
But the big problem is it's not very accurate. Because it's a heuristic, and it's kind of complicated. It produces weird outliers in about 20% of the cases. And it's really hard to fix it because we don't know what exactly about the heuristic made it good for the the 80% of cases.
So changing it for the other 20% is really difficult. It's also not simple, stable, or elastic.
So first, we set out with a list of priorities. Out of our metrics, we always prioritize that above everything else being representative and accurate. We really, really cared about getting a real-time metric. If we're not going to have that as a requirement, we would just use speed index.
The metric needs to be interpretable.
People need to understand what it means.
Like, "it took x seconds for the content to display." As opposed to, "Your score is 72." And it needs to be simple.
So ideally, we can put it in standards and polyfill it, things like that.
So the main insight that someone on our team had is that we can get paint events in real-time, we can get them very quickly.
Could we just use the paint events to try and figure out a way to make a metric that's simple and accurate? So we brainstormed and we came up with a bunch of ideas. What if we took the largest text paint in the viewport? What if we took the last image to paint in the viewport? What if we combine those together? And we implemented all of these things the largest, the last, the images, the text. And one of them, or both of them.
And we tried them all out.
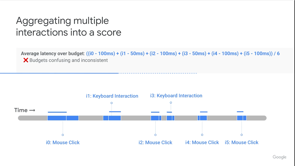
The way that we did this, is we built a tool. So let me go over the screenshot because it's a little bit confusing how our tool works. There's two rows, the top row, interspersed you can see the metrics and colors, like last TFP, with screenshots of the page.
So you can see what was painting at the time. And then this bottom row is the actual paint events. So what we did was we got these types of film strips from over a thousand sites.
And we looked at the metrics values, and the layouts and the screenshots.
Debugged to make sure, first, is the metric doing what we intended it to do? Are we actually doing the last text paint or whatever. And then which one is best.
The largest image or text paint in the viewport was that. So yay, largest contentful paint.
But actually, it wasn't quite that simple.
It would be great if we could just define it like that, but there were some edge cases to handle.
So the first one is splash screens.
This is a film strip of Twitter loading.
And you can see they have their their logo and then a loading spinner.
And then finally we get some dialogues but we get the the main text of the name of the conference.
And at that point, the pages is, the main content's loaded. What we realized was that basically the logo, and the spinner, if we just invalidated those as candidates for largest contentful paint.
When they're removed from the dump, we actually get largest contentful paint in the right place for this page and looking at lots and lots of different filmstrips like this, it worked really well.
So we invalidate elements that are removed from the DOM. Then there's a similar case with background images. I actually can't find a lot of great examples of pages with background images that are just super simple. So here's one that's more typical.
On the left is the pages actual background image. And then on the right is three filmstrips.
So here is the where the first contentful paint is. It's actually not the background image or anything, it's just some stuff that happened to load. Here's where the actual background image paints. And that would have been our largest contentful paint. But then later on this logo paints, and that should be our real largest contentful paint. And what we found with these types of pages that if we just invalidated the background image as a candidate, that we generally get these types of results with the best largest contentful paint.
Then there's also, you could see, this is another example of a screenshot and it doesn't quite line up with our tool. It's kind of a janky tool, sorry.
But you can see all the reds are text paints. And what you might think of, as a user, as a paragraph, is pretty different than how things actually paint. So we aggregate to block level elements for text paints to make this a little bit more normalized.
Another problem is that, especially pages with an infinite scroll, you're looking at a feed, or a timeline.
And as you scroll, new images or new texts keep coming into the background.
Not the background, the foreground.
And they continually update the largest contentful paint. So we actually stopped measuring largest contentful paint at the first user input to deal with this.
So we did a lot of filmstrip validation.
But we wanted to, after we looked at the thousand film strips, and then looked at them many, many times as we get through each of these edge cases. We really want to make sure that the data is accurate, that it works on a larger data set.
So I've also been doing Big Query queries on HTTP Archive. This is the largest contentful paint versus speed index, which we know we really like, as a great main content painted metric.
And you can see there's a point eight three correlation. Which we're really happy with, it correlates really well to speed index.
But what about orthogonality? Does it just, all the performance metrics just correlate? So no, they don't, which is good.
This is the same type of query, except we have largest contentful paint, and first contentful paint.
You'll notice there's this diagonal line here. That's because the largest contentful paint can't be before the first contentful paint. But on the other side of the line, there's this big spectrum of, sometimes the largest content paint's really close and sometimes it's really far away.
And there's not as much of a correlation.
So it's definitely a different metric.
So that was our metric stop on the journey to Browser Vendor Island.
I hope it was useful.
When we look back at how we developed this metric. I think the big gap is not being part of a broader community not involving the web community as much.
So we'd really like to fix that for next time. Here on Browser Vendor Island, we're a little outdated with our communications, so we have an email address, and that's my team email address.
If you'd like to be involved in performance metric design, please let us know, we're really excited to work with the broader community more.
Give it a couple of seconds.
I also have the slides online if you don't have time to take a picture.
Okay, so with that, I'd like to switch on to monitoring, We have metrics, but then we need to actually monitor them, both in the lab and in the wild.
To make sure that performance doesn't regress. Otherwise, why do you have metrics? So I'll talk about this, I see monitoring is a stage. You go into the lab, then you do A B testing, and then you do real user monitoring.
So let's start with the lab.
And by this I mean again, performance benchmarks that you either run locally or run on continuous integration. So there's some pros and cons about lab testing. The coolest thing about lab testing is it's super fast. You can run a benchmark locally or kick off web page test, or have something on your continuous integration. The goal of our testing is repeatable results. So a regression is detected, you can repeat the tests until you find which changed did it.
Then you can keep repeating the tests with the debugging tool until you find what part of that change. And it's really great for repeating and debugging. Another cool thing about lab testing is you can try out performance ideas that you could never ever launch.
Like, what if we just cut out half of our code? We did an experiment on Chrome, where we just cut out massive amounts of code and does it change different metrics? So you can do things that are really experimental and out of the box.
The huge limitation with lab testing is that it's just impossible to model every user to your site. You're always going to have gaps in the difference between the lab and the end users. So that obviously means that some regressions are just not going to be caught by lab testing. But it also means when you're doing those fun tests locally, trying to come up with an idea for performance improvement. Maybe locally, you get a 50% performance improvement. But usually in the wild, it's going to be less because you're going to naturally optimize to the test. And in the wild, you're going to end up with a different configuration, or many, many, many different configurations. So I've been working in the lab testing space for a really long time.
And I kind of feel like the problem, just really the big problem in this space boils down to two competing goals.
On the one hand, we want our test to be reproducible. We need to be able to detect which change caused the regression, and then what part of that change and just repeat, repeat, repeat, until we can make sure we we've addressed it. But on the other hand, the tests need to be realistic, otherwise we're not really using our time well. I'll talk about realism first.
So this is a slide from a Google IO talk by the V8 team, and it is about how they changed around their benchmarks. The colors are the different subsystems of V8. And at the top, they have synthetic benchmarks, octane, speedometer.
And you can see those pink bars are super long in the synthetic benchmarks. So if you're thinking about optimizing V8, you probably want to make that pink bar shorter. Maybe you could take the orange bar and make it a little better, and that would be a pretty good trade off, over all it would be much shorter.
The problem is that on the bottom of the chart, we have 25 top sites, and that pink bar is super short in most of those sites. So depending on which benchmarks that you're using, you would do really different optimizations. And we really want to get things as close as possible to this bottom set as as we can.
So how we handle that in Chrome's benchmarks is we test on many different hardware configurations. We actually record real websites and then replay them. We don't have as many lately, we've been slowly winnowing out synthetic cases, and really focusing on actual web pages.
And we simulate a bunch of different network conditions. So back to reproducibility.
Most of the time I spent was on improving reproducibility. So I have a couple slides on how I did that. And I'm hoping that it translates a bit.
The first thing that we've never been able to really get good reproducible results in VMs. We use real hardware.
And we even take that a step further, we buy all the hardware in the same lot.
And sometimes we even tie it to the exact same device, but if not, we have one configuration, it's got the same OS, Everything about it is the same.
It's the same hardware lot.
On mobile, it's really, really important to make sure that the devices are cool.
If you're running on real devices.
The battery can, if the device gets hot, that changes a lot of the performance metrics. So you can just use ADB to check the the battery and CPU temperature, and wait until it goes down before you run another round of the test.
Next, just super important to turn off all background tests on the machine you're running on.
And we have a lot of work to reduce randomization. So we record and replay real web pages.
If you're working on a web page, that doesn't make sense, but maybe it would make sense to freeze some parts of the page, like third parties. One thing that we do on our recordings is we also freeze JavaScript APIs to introduce randomness. So math.random(), Date.now(), things like that. We just make them return the same value, so that makes the page more stable.
And we simulate network conditions to make it more consistent.
Another thing that's really important for reproducibility is what we call diagnostic metrics.
Remember I said we had thousands and thousands of metrics and we're trying to focus on the top level. We still do have thousands and thousands of metrics. And the reason we have them is so that, when one of the top level metrics regresses, we can go and look down the line at how all of the other metrics changed.
So for pages that, for load times, a lot of the changes in Chrome that affect load times are in the CPU.
So one of our diagnostics is, what's the CPU time to first contentful paint? What's the CPU time to largest contentful paint? And that helps us narrow it down, like, "Okay, "how does that break down between subsystems?", et cetera. Another metric that we have, that we found incredibly helpful, has nothing to do with Chrome.
We actually measure which processes are running in the background, and we count the number and then we have a list. So let's say that your performance test is running, and there's a big spike and it goes back down and you're sure that was noise.
You just look at that place in the graph.
And you check your diagnostic metric for what processes, like, are there more processes than normal? Then you look at what they were.
It's a really good way to find things to kill, because there isn't a great list of background processes you should probably kill. So this is a note about looking at timelines. We use this thing called a reference build. So in this image, the yellow is the actual build we're testing that's tip of tree chromium.
And the green is just the same build of Chromium being run over and over again.
And we can see up here, and over there, we just got some blips, and the blips happen in both of the builds. So we don't really worry too much about that. It's impossible to get rid of all the noise. But we do see that the yellow one actually, at the end there, it hops up, and the green one did not. So we know that that's a real regression.
It's just this super simple, really visual way to check for regressions, and just sort out the noise. But I think one of the biggest things we've done to improve reproducibility is just to improve how we do change detection in general. So specifically about comparing two versions, you see, we ran version A and version B, and version B is higher, but how do we know it's not just noise? Maybe they're the same and there's just noise in the test. Well, we can add more data points, right? Now we have more runs of version A and version B, and it looks like version B is still worse, but I don't know, should we take the average? Well, that kind of smooths it out, and naturally, we could do the median, but I don't know. One thing I've heard is that you could actually take the smallest number from each round and say, "Well, the rest are probably more noisy." But the big thing that we did, that made the biggest difference in being able to really understand whether these two sets of points were different. Is to try and think of performance as a distribution. And it's actually usually not a normal distribution. It's usually like a long tail, or bi-modal or tri-modal. And if you have these two sets of points, you want to know whether they're in the same distribution. Or you can at least see with the hypothesis tested, they're not in the same distribution.
And that's what we do.
So the the biggest point here that I wanted to make is again, going back to them not being normally distributed. The T test is not a good hypothesis test for this. But there's many others that handle that type of data. Well we use Mann-Whitney U, but any of these, or others, should be fine. So next, the next thing we do on Chromium, we have lab testing.
And that gives us some initial data and protects us from regressions.
But we have several other steps and the the biggest thing that we do to both prevent regressions and to test performance improvements, is A B testing. And I did want to point out, from Simon's talk, when we do A B testing on web properties at Google, we always do server side, so that we can really know how that impacted performance and be able to understand performance changes better. So pros and cons of A B testing.
They're really great for actually predicting the real world effective of performance optimizations you can see out in the real world, how does a random sample of of users, how are they affected. And if you launch new features for A B test, you can see for sure, they're not going to regress your key performance metrics. The biggest limitation is just that it's hard to A B test every single change. And if you do start to get closer in that direction, it's hard to manage all the A B tests.
The other thing I wanted to say about A B tests is it really should be called controlled experimentation. Instead of an A and a B, we usually have a control group, and then any number of variations.
Why would you have variations instead of a B? I'll give you an example from many years ago. I was a front end developer.
And we wanted to know, how much does extra JavaScript impact our page load time? How much overhead do we have? So we added 10 kilobytes, and 20 kilobytes, these were big numbers at the time, and 50 kilobytes, and compare them to the control to see what effect it had. I find that method is really valuable in performance a lot, to compare multiple different implementations. So another thing I wanted to know is that, if you have something you're launching via user opt in, that is not the same as a controlled experiment. Whatever made the user click the box to say, "Yes, I want to try this." is probably something different about that user. And there's more that's different about those user groups then you can imagine.
Another example from way back in the day, before SSL everywhere was a thing.
I used to work on a site where we had a settings page and you could click it to get the SSL all the time and we're thinking about launching it to the world and my director asks, "Annie, how much slower those users?" And I looked, and they were 250 milliseconds, they're 250 milliseconds faster.
And no matter how I slice the data or anything, they were just faster.
And you know, it's not really possible, you have the handshake and everything.
SSL is going to take longer.
But there was something about the users that knew that they wanted to go into the settings page, and they wanted to tick that box.
Maybe they wanted to buy better hardware, maybe they wanted better internet connections too. But there's a lot of bias in opt-in.
So back to experiment groups.
Some best practices are to just use equal size groups. And then one thing that we see happening a lot is at the experiment end there's some weird thing that we didn't expect, and we're like, "Well, maybe Group B is just weird. "Or maybe they're slower at the 90th percentile." And the way to address this is before the experiment starts, you can pick the groups and not change anything. And see if group B was maybe different before the experiment started, we call it a pre-period. What if the experiment's going and you need more data? you can just keep running over a long time period, that is more data, or you can increase the group size. So those are the the big options that you have. One thing you might consider before increasing the group size is again running a pre-period.
So now, the last part I'm going to talk about is real user monitoring.
The good thing about real user monitoring is it's the absolute ground truth for what is the user experience, as well as your metrics can measure it.
But it's really, really hard to to reproduce. It's really hard to debug.
And by the time you detected a regression, your users are already feeling that pain.
So why is it so hard? There's a lot of reasons but I just listed a few. So your user base is very diverse is one thing. So maybe just a subset of the population is experienced a problem.
But it's hard to tease that out.
There's mix shift effects.
What this means is similar to the opt-in you could have some kind of bias in the population of your site. For example, if a new country comes online, and they have lower end devices, you might see you're, as those people are coming online, your performance numbers get slightly, slowly, worse and worse.
And there's lots of different ways that this can happen. And it's pretty confusing.
There's also lots of things out of our control on Chrome, like Patch Tuesday kind of throws everything in, a wrench and everything on Windows, it's not just that, Windows is updating and it might be different, but there's also people restarting their computers has an effect on performance.
So that there are things that are out of control entirely. And then when we finally get to the root of the problem, you wouldn't believe, in every project I've worked on, it's not just Chrome.
How many times it's actually just a change, especially performance improvement, just a change in metric definition? So start there, look at things that could have impacted the way that you're measuring. So what can you do about all of it? Some other people have suggested, and a lot of this, I would refer back to Emily's deck, it was really awesome. So I actually cut this short on my slides, I say to use percentiles here and monitor the median for the regular user experience and also a high percentile. And those are great to monitor but the chart that Emily showed with the heat map, that shows both how much, how many people are using your site, and also what's the distribution? Understanding how the distribution of performance is changing is really important.
What can you do about that mix shift? Your population is changing.
So the first thing, the turning it on and off again, of real user monitoring, is checking for volume change. Like how many people are accessing the site? Did it go way up? Did it go way down? Then you can try splitting the data.
We find it really helpful to split by country. We always split by platform.
We look at Windows, and Mac, and Android separately. And then further we split by device type.
So either device year or actual devices.
And then I cut this section really short, because I really, really liked what Emily said about thinking in terms of traces and not events, when you're trying to break down a big metric into small ones.
The big thing that you need to be able to do is you have this shift in the 90th percentile. Okay, how did the breakdown of that metric look before and after the shift? So you have to associate all of the different metric breakdowns together. And if you put them all in one trace all together, or some other way of linking them together, it's going to be a lot easier to do that.
But the big thing I would recommend is to try and forget about all that stuff as much as you can by trying to just make them a little bit more like A B testing.
So when you're launching new features, always launch things by A B test.
And then you can just get really clear numbers on whether that was a problem or not.
The same thing for when you launch your product. You can watch it as a canary and look at, okay, on 1% of the population that has the new version, are they different than the 99% and then 2%, 3%, and kind of look at it, as it rolls out, is it different? Okay, but what if it's rolled out and you're still not sure? You could use a hold back, which is just taking like maybe 1% of the population and giving them the old version.
Okay, so that is my trip to where I live on the Browser Vendor Island.
My takeaways are that metrics are very hard, but we would love your help.
And please email us if you if you want to contribute to designing new performance metrics.
Big takeaway is that we want to focus on user experience, as opposed to the smaller bits.
They're just there to help get the overall experience. And that lab testing is great for quick iteration. But for really understanding what's going on in the wild, I think A B testing is the way to go.
Okay, thanks everybody.
(applause) - I love talks about performance metrics so much. That was great.
It was, and it was like a perfect mixture because it validated some things that I thought I knew, but then introduced me to some new things as well. So thank you very much for that.
Okay, so we had a lot of questions.
We'll try to get to as many as we can.
So we'll start off with this one.
It says, first off, thank you for your work. This is from the audience on metrics and monitoring. We're all benefiting greatly from it.
And second part, what are some of the more experimental metrics right now? That you're excited about.
Some things that are on the horizon.
- So Yoav, and I, I think Yoav's here, still are just starting to experiment on, what can we do for a single page app navigations? My team is also starting to look at abort metrics, which is not a performance metric.
But it's really important for understanding, are users happy? Are they, abandonment, are they leaving the page? And there's a separate team that works closely with us that's doing, trying to do better scrolling and animation metrics.
- Cool.
So are those things you're directly involved in? Or you're kind of just adjacent in terms of these? - I'm directly involved in the first two and then scrolling and animation, I can at least tell you who to talk to you. - Okay.
And so what about cumulative layout shift? Hearing some talk about that.
Is that something that you're involved in? - It is my team, but I didn't work on it directly. I'm really excited about it.
It's our first really user experience metric that's not performance related, that we're trying to get to developers, and see if it can make a difference.
I think it's a pain point for a lot of people. They start to load a page and it moves around and things pop in.
And so we're really hoping that the cumulative layout shift can help raise visibility there.
- So would you mind, I don't mean to put you on the spot. But can you maybe for people in the audience who are less familiar with what cumulative layout shift is. Because it was just announced, right? - Yeah - As something that you folks are working on. - So layout shift is anytime that the page layout shifts, so in some frame, you're moving to the left, you're moving to the right, you're moving up or down. Things are moving, but you're not scrolling or interacting with the page. Cumulative layout shift is the cumulative amount of shift that you have over the page load in general, or over the time. I'm not sure actually what the end point is. I think it's for the whole page, like the time you're on the page.
- There's a, Paul Irish presented about that. Didn't he, at the dev summit? - I believe so, yeah.
- So if anybody who's interested in learning more about that there's a.
- There's definitely slides on CDS that explain it way better than I am.
- Oh, I don't know if you're going to be able to answer this one. How much of the Chrome run metric ends up in Google search? What do you know about the algorithm? - They do not tell us how they do the search algorithm. - So this is just not something that you're going to be able to like? - Yeah, they don't tell us.
- Okay, let me see.
How does largest contentful paint handle a font display swap? - So we do count the before, whatever renders first, so if the the default renders and then the font comes in. We do count it when it first displayed.
- Okay, Okay, so this is interesting question. So when you're testing in the lab, do you actually load the actual website? Is that what you're testing on? Or are you grabbing like a hard file? We use web page replay, WPR go, it's in our catapult repo. It actually records and replays full websites. So we have a recording of this site.
And we're replaying that recording with network simulation. We're not actually loading a real site, because that would have so much variability. - Yeah.
This is interesting, How much do you, I don't know you personally or you Google, work with other browsers to ensure that the same metrics can be measured across browsers. - Well, so most of that work happens in the Web Perf working group, but Yoav, who's here is really involved, and Ilya as well. I don't personally do a lot of that work, but I'm looking to get more involved.
- Cool.
So 'cause right now largest contentful paint is just Chrome only. It's not available in any other browsers.
Yeah.
Actually, I think, let me see.
There's rather a lot of questions, just trying to find ones that I haven't asked yet. - We're done.
- Are you done? - No, it's okay.
- Okay, so somebody asked if largest contentful paint can show up after, or be greater than visually complete.
- It is possible if, one of the things that's really difficult is for something like a carousel of new content coming in. So if you're continually animating or doing things that it will keep updating, so it is possible.
It doesn't generally, when I looked at the metric correlations on HTTP Archive like that scatterplot, it's rare but possible, - Okay, I was thinking another response to that is if people are, because LCP is just Chrome only, if you're looking at all of your visually complete data in one bucket, and your LCP data in another bucket, you're looking at actually different buckets. - Yeah, - Yeah.
I think we went through all the ones that I know of, that I've got on my list anyways.
So thank you very much.
This was awesome.
- Thanks.
(applause)