Machine Learning for Product Managers
(gentle music) - Thanks for the opportunity to speak to you today about machine learning for product managers. The idea of the talk came because Matt and I have very different perspectives on machine learning. Matt comes from a very technical background, whereas my background is a long time in product. And what we found is that machine learning discussion that's out there comes from those two perspectives, but there's not much in the middle.
So there's very deep technical talks about machine learning, and then there's often very high-level strategic talks about how machine learning is going to change everything. What we wanted to do was a talk that looks at the overlap about what can we actually do today with machine learning with our current products. So what we're going to cover is first of all start with a definition and then we're going to take you through the classic product management lenses and look at machine learning from that perspective. So let's get started and I'll hand over to Matt to kick us off.
Okay, so, you know, what is machine learning? This is a conversation I have with a lot of different people because there's so many hype-related terms out there. There's artificial intelligence, there's data science. People google things and they get these crazy big formulas. But you know, really for me artificial intelligence is a very broad sort of philosophical sort of idea almost. Data science is like a collection of roles in a company, it feels like these days, but really this talk is about machine learning because there's, you know a subset of machine learning and that is really, really applicable to business. And I see machine learning as like a toolbox. We have a collection of problems that we can know how to solve, given certain datasets.
And so when we talk to people about a particular problem they might have, we sort of reach into this toolbox to try to find something that helps.
So we want to go through a bit of an example to start things off.
And so this is a bit of grounding.
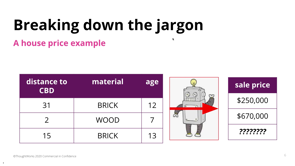
I guess, you know, let's say we wanted to build a piece of machinery that predicts the price of a house.
So there's sort of a couple of different parts here we have. You know, we've got this robot in the middle that's somewhat representative of the software we want to write.
I'm going to call that a model.
And what that model does is tries to map between things that we might know about a house, like these sort of things: distance to the city, maybe what the house is made of, how old it is, and try to predict from those things what a sale price might be, say if it went to auction next week.
So the question becomes like, how do we do that? How do we build a bit of software that does this sort of thing? Well, in a lot of machine learning use cases, we use a technique that's called supervised machine learning.
It's called supervise because we sort of train this model. We supervise it by giving an examples of things that we sort of know the answer for.
So what we sort of do is we collect some sort of a priori info about a whole bunch of houses that we might know the price for.
And then the problem becomes not to directly learn or to specify this sort of mapping between these things we know and the price, but to more give examples to a piece of machinery that might then be able to learn for itself. So the really important part about this is that it's all conditioned on the idea that we have access to this data.
And so there's this interesting relationship that'll be a thread that we talk about during this talk, which is different data that we have access to results in a different model.
And that's a really important critical thing, because for a lot of software we write it's very deterministic, sort of have a really good control of things, but this dependency machine learning of a particular dataset can really be critical to success.
And also how sort of things work in general. So what we're going to talk about first is the idea of technical feasibility.
Let's explore some of those things I mentioned, the idea of datasets and models, sort of complexity. This slide we've got sort of these two axes. This is a common sort of way that I think about machine learning, this idea about what sort of data we have and how much we have, and how what I call complex the model is, like what sort of capacity that model has. You can think of it like how big is the piece of machinery is brain.
And there's this really interesting relationship which I think is quite intuitive that in general is a big rule of thumb that says the more data we have available on a problem, the better result we're going to get from this piece of machine learning.
So that's really critical because it means that we don't sort of ever build one piece of machine learning. It's not like we instal the machine learning model and it's sort of done.
It's very much an iterative process where as we collect more data or we make the data more complicated we have the opportunity to sort of rebuild this model in some way to sort of ask from the model more and more complicated questions.
So there's a couple of different dimensions that play in here.
This idea that more data means a better result in some way. What does more data mean? Well, if I think about this table of data here, this idea about things that represent a house that I'm trying to predict from, the simplest one, in terms of more data, it's just more rows, simply more examples of houses when we know the prices.
That's a really clear way of getting more data, and that feels intuitive because the more sort of examples you see of something the better the result might be in terms of how will we generalise to new things. Another interesting dimension of this data is you can think about the comps, like what sort of things do we know about each house? In this example, we've got things like how far it is from the city or what it's made of, but you could also imagine that there's a bunch of stuff which helps us predict the price, like how many bedrooms there are, or does this house have a pool.
So there's also this idea about what sort of information we have on each house. And that's on the data side, I think what's more interesting in relationship to the product is the idea of the complexity of the model. And that's often, not always, but often driven by the complexity of the answer we're trying to get. So in this case, we're talking about what's the predicted sale of a house next week or something. But it might be that the data we've collected or the type of question we're asking can't be necessarily answered from this dataset. So we have a lot of flexibility on this right-hand side, this output side to ask different questions of the data. So maybe this data is really good for saying how many days is it going to take to sell this house that went onto the market, or maybe even a more granular question, or less granular, like will this house sell in the next month? So this complexity of the question we have is also important because the less complex the question we have, the less data we have to have to build a model. So, when we're thinking about products and machine learning, it's important to think about, can we if we need to reframe our question? Is there a simpler version of the question we're trying to ask the machine learning that gives us a better result? And so it's a thing that we have to trade off a lot. As we get more data either by purely number of rows or more complicated data, we can start to ask more complicated questions of the machinery. And I think another thing that's critical that people don't realise is that it's not just one machine learning model in a company. It's not like we instal one piece of software that does this.
We end up with lots and lots and lots of these models that sort of interact in complicated ways.
And it's never just one input and one output. We might have some input which goes to a model, which becomes output, which becomes input for another model. And all of these things might be doing different things with different responsibilities.
And so it's quite complicated, but it's never the case that it's just one single model sitting off to the side. So, if we think about this idea of different types of models and different data requirements that happen, there's quite a continuum of where does this model come from? You know, a while ago, it used to be that you were sort of on your own and you'd have to build this thing from scratch, but more and more as common questions asked of common data, this becomes more and more a commodity in a sense. And nowadays there's cloud services that we can use that very easily represent things that 10 years ago were very difficult to build. So you've got a choice to go with.
Do I just use an existing cloud service, which is maybe trivial to use, and it has some very, very low cost, but doesn't give you any differentiation across the market? The other end of this is if you have very unique data in some way, or a very unique type of question of that data, you might have to build something a little more bold bespoke.
And, you know, there's a big continuum between. You don't have to necessarily just use the cloud service. You might use something that they provide, and then sort of do some tuning on top of it to make it a little bit more specific to your dataset. And these things are very rapid and they change very quickly.
One of the best examples I know of this is this idea of object detection in an image. So here's an image.
Nowadays with computer vision we can draw these bounding boxes around salient objects in the image in real time. Now 10 years ago, people didn't even know how to do this. It was inconceivable that we could have this technology. Five years ago people were having to build complicated pipelines to do this.
These days, it's a small fraction of a cent. You send this image up to the cloud and you get something back.
So everyone has access to this now in some ways. So you've got this interesting balance between what is really quite a new technology and how do you integrate it, but how do you integrate it in a way that maybe is a little bit different to your competitors? The next we're going to go to customer value. - Okay, thanks Matt.
So I'm now going to look at the next product management lens, which is customer value.
So we're going to go back to the matrix that Matt talked us through earlier, and add another element, which is the bubble, which represents customer value.
So the first thing I'm going to say is pretty obvious, and it's just basic good product management, is that we should always be thinking about the value we deliver to customers.
But I think often because of the excitement we have around the technology for machine learning it's easy to lose sight of this.
And so what we're looking for is, as we tick tack up that matrix and both increase the size and complexity of the data estate and develop the model capacity we're looking for an increase in customer value that matches that investment.
And really importantly, we need to set a baseline at the beginning.
So before we even establish a machine learning experience we know what it would look like if it was a non-machine learning one.
So if it's a recommender, what happens if we just have a simple rules-based system that just says products in the same category at around the same price point? And that gives us the baseline for measuring that customer value.
And when we do that, we find that often there's a kind of sweet spot in the middle going from bottom left to top right.
And the most valuable thing we can do is to stay in that sweet spot and increase value as we add to the data estate, improve the model complexity.
We'll know when we're moving out of that because you're not increasing the customer value. So if that's on the horizontal axis, it might be that it's redundant data and you see really kind of extreme versions of this where organisations just hoard a lot of data that doesn't actually add value.
On the vertical axis it might look like over-investment in the model where you're doing something that's exciting from a machine learning perspective, but maybe isn't delivering the customer value. So with that in mind, we'll look at three anti-patterns that we see in trying to develop that customer value in line with the investment in the technology. So the first of them is a fairly obvious one, which we've called the stalled value trap.
And that's really just where you're no longer getting a growth in value. So you continuing to invest, you're moving across and upwards, but there's no increase in value.
At this point, we should stop and solve another problem, because there's so many opportunities that can be addressed with machine learning. The next one is the hype trap.
And I think this is common where the organisation or the founder or the CEO just really wants to see some machine learning implemented.
And what this can look like is that the non-machine learning solution is actually a pretty substantial value bubble. And the investment might eventually get us to it and maybe even slightly increase it, but it hasn't justified the cost that's required to get us there.
And then the last one, the moonshot, is perhaps not really an anti-pattern in that it's a valid choice, but it's important for us to consider whether it's right for the organisation. And what that looks like is that there's no payoff until there's been really substantial investment, lots of data and a real complexity in the model. So this might be things like autonomous driving and despite all the investment that the industry has put into that, we're still not there, but clearly a lot of great companies believe we're going to get there.
And they're prepared to take that moonshot. What we would counsel is that we should understand whether it's right for our organisation before embarking on it, because you don't want to stop until you've got to that top right corner.
So what we do advocate is a portfolio of approaches. And so, like you would have a a product portfolio for a set of products, it makes sense to have different investment approaches.
So that might be an incremental one, which if we go back to the automated vehicles example, maybe this is developing lane changing technology. And then meanwhile, another part of the portfolio, we're investing in a more moonshot approach, which is actually developing level one autonomy. Okay, so hopefully that's given a view of how customer value can be considered with machine learning.
The next thing we look at is commercial viability. So I'm gonna let's stick with the two axes that Matt introduced.
And the first one I'll look at is the horizontal axis, so the data estate.
And there's two the big costs that we want to explore, and I should drop a caveat here, which is mileage may vary. It's very hard for us to really talk with great confidence about cost, but we do see these two patterns.
So one is around the hardware costs and data storage. And this isn't significant in the early stages of developing the data estate.
So it only grows as we get towards the end of that axis when you're getting real high volume data, and particularly data that's been drawn off the actual use of the product.
The bigger cost is the people cost and in data engineering. So it's often the case that the data of the organisation isn't in a great state and you actually have to put a fairly big upfront investment in order to get it into a position where you can do anything.
So that's the horizontal axis.
The vertical axis, in terms of developing the model capacity.
Again, we can look at it in those two pieces, the people and the hardware costs.
This is the probably one good news on the cost slide is it may be free to get to that very first step.
So as Matt said, machine learning as a service may be an important cost in order to get that basic experience.
You're then likely to incur some people costs in order to to implement a more generic model, but then you will see it really blow out into that custom space, so where you're actually trying to develop something that's original.
It's high risk and likely high cost.
On the hardware side, the compute costs grow as you move up that axis in a fairly linear kind of way. So, that's commercial viability.
Let's move on to the next classic product lens, which is usability.
So usability in is obviously really going to depend on what the application you're building is. But there's a pattern that I think is worth noting that we think applies to most machine learning based products.
And that's the idea of having an interface that's robust to failure.
So, there's always the challenge of developing the machine learning experience up those two axes.
And it's important that the UI you create reflects where you are.
So the example that we've got here is from the YouTube recommender, and what it does is it doesn't presume to completely solve the user's problem of what's the next video I should watch.
It kind of augments that experience.
So it says on the right, here's half a dozen videos that might be relevant.
And it mixes in different alternatives there. So that if the user is interested in just straight football, or broader sport, or humour, or a particular player, they've got options and they can choose from that augmented experience.
As we get more confident with the machine learning experience we can be more presumptuous in terms of the interface we build.
And so the auto-play features is example of that, where we see that as up on the top right of the matrix where we really automating, and rather than just augmenting that navigation, we're actually saying we think this is the one video that you should watch next.
So those are the four classic lenses that people like Maddy Cagan would talk about. The other two things we want to cover: what's the strategic context, and then what's the delivery context.
So I'll do the strategy piece.
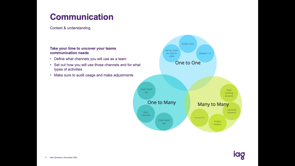
One of the things that makes machine learning very exciting from a strategic point of view is this double flywheel effect that we see. So a lot of products will have the flywheel that you can see in the centre, which is that they create a good experience, this drives usage, which then generates revenue, which they can then invest in improving that experience and that attracts more usage.
So that kind of revenue based flywheel is common to a lot of products.
What's interesting about machine learning is that it then has this second flywheel, which comes from the unique data that is generated from that usage.
So by using that product, it creates unique data that only this product has access to, which can then be fed into the model innovation, which further develops the experience and hopefully generates more usage.
And the wheel continues to turn.
So that's why from a strategic point of view, getting there first with a machine learning product can create this unassailable competitive advantage. And with that in mind, it's interesting to look at what we think of the two main categories of machine learning opportunities.
So the first one is about value creation.
And the definition of this is where you're actually building a new product experience using the machine learning technology.
So examples might be voice or self-driving vehicles. And this is interesting because there's this real potential for the flywheel.
And given that potential, there's value in getting there first.
So there is some urgency, but there's also risky, and there's that moonshot risk that we talked about earlier. The alternative place to look for those value opportunities are around efficiency. So that's reducing costs and improving efficiency. That might be things like fraud detection.
It's more incremental.
You're more confident that you'll succeed, but it's less likely to have that flywheel effect that creates the urgency, but also the really big payoff. So the final piece we'd like to talk about is delivery. And I'll hand back to Matt for that.
- So there's a couple of different patterns and ways of working that we've seen in companies that are either small or large, and it sort of follows two axes.
The horizontal axes here, it talks about the complexity of the machine learning that's being used. And I really like this series of terms that comes from quite old statistics, this idea of descriptive, prescriptive, or predictive, different versions of machine learning.
So descriptive statistics is when we're building things like dashboards.
So if I have a large amount of data and I want to sort of summarise it in some way that I can aid humans in their decision-making. So, you know, big dashboards showing graphs, the distillation of complicated data into small data, that's the descriptive statistics.
And people will often move from that to this idea of predictive.
If I've got a whole bunch of data, then, it's really handy for a business to be able to predict the future.
So this is where a lot of the first dipping of the toes in machine learning comes in. Can I predict some of the things that are in these descriptive statistics, because if I know about them in the future, it's really handy.
And often as you get better and better at this, why do you want to predict the future? It's because you want to sort of change some leavers upstream in your system.
You want to be able to change things that are happening so that you can say that my predictive model says we'd make more money if I made more, say, widgets now than tomorrow, I should make widgets now.
And so the third round of this which is a little bit rarer is this idea of prescriptive, where we're actually handing over some aspect of the business to this machinery to act on our behalf. They're the three ways that we see the complexity growing. There's also this idea about who in the company is doing it. You know, it's very common that because this is quite technically challenging, there's maybe a single team, maybe some sort of centre of excellence that's sort of starting with this.
And eventually they might grow into some sort of cross team capability, or there might be some sort of mandate from a very high tech company to do this company-wide. And, you know, there's three arrows we've drawn on here that are sort of interesting ways of doing this. And two of them are in a way, failure modes. This arrow that's going straight up, this idea of descriptive statistics that are across the company.
This is very common.
We've got a lot of teams that are doing simple things, so to speak, and maybe failing is a bit harsh there. It's basically the first step that we see.
One of the other areas we've got here is this one that's completely horizontal.
That's this idea that there's a single team that are doing very complicated things, have deep expertise in an area, but they're the only people doing it.
And this is a big mode of failure.
Having a few people that are able to do amazing things, but no one else is really not a long-term way to do this. So the ideal state is this diagonal, this idea that maybe you grow single teams doing simple things, but you really want this capability across the world.
And one of the best ways of doing this is this idea of capturing that expertise, not necessarily always in people, but in tools and process. So it's a very important point to make.
And that is the end of our talk.
Machine learning offers huge potential across digital products but it continues to come with so much hype that it leaves us with more questions than answers. What new thing can we build we couldn’t before? How do we introduce intelligence into existing products? How much data do we really need?
In this talk Mat and Matt given an overview of practical concerns in building machine learning powered products through a set of standard product management lenses including customer value, commercial viability, technical feasibility and end usability.
They step back and consider the strategic implications of Machine Learning and the potential to build sustainable competitive advantage, before diving into the practicalities of establishing ML product teams.
Machine Learning for Product Managers
Matt Travers & Matt Kelcey – Product Principal and Principal, Machine Learning, ThoughtWorks
Keywords: Machine Learning, User Experience, value creation, efficiency, commodity models, bespoke models, UI, data estate, data complexity.
TL;DR: The Matts explore Machine Learning through their respective lenses of technical expertise and product management in an attempt to map the overlap between the two and what each viewpoint might bring to create a fruitful collaboration. Matt K explores what machine learning is and its current technical feasibility in terms of types of models and their relevant merits as well as correlations between levels of complexity and volume of data, particularly as these impact delivery and the teams who drive delivery. Matt T explains how and why good product managers need to ensure that customer value, usability and strategy are as much a part of the process as the technical aspects, and uses a risk/benefit analysis to compare various approaches and chart potential pitfalls vs proven success strategies.
[Matt T speaking:]The genesis of this talk is that Matt T and Matt K have very different perspectives on machine learning. Matt K comes from a very technical background, whereas Matt T’s background is in >strong>product. The majority of broader conversations about machine learning comes from these two perspectives, but there’s not much in the middle. It’s either deep technical conversations, or high-level strategic discussions about how machine learning is going to change everything. The Matts wanted to do a talk that looks at the overlap about what we can actually do today with machine learning with our current product.
What we’ll cover today: A look at ML through six product management lenses.
- What is Machine Learning?
- Technical Feasibility
- Customer Value
- Commercial Viability
- Usability
- Strategy
- Delivery
Over to Matt K: What is machine learning? MK: There are many hype related terms out there around ML: Is it artificial intelligence? Data Science? Artificial intelligence is a broad, almost philosophical concept and data science is a collection of roles in a company. This presentation is about machine learning and particularly a subset of machine learning that is really applicable to business. Mat sees machine learning like a toolbox. We have a collection of problems that we know how to solve given certain data sets. When presented with a problem, they reach into the toolbox to find a solution.
We’ll start with an example to ground the conversation. Let’s imagine we want to build a piece of machinery that predicts the price of a house. Two parts to this would be: The robot in the middle representative of the software we want to write. Let’s call that a model. This model tries to map between things we might know about a house ex: location, materials, age and try to predict from these what a sale price might be. The question becomes: how do we do this? How do we build this software? In many machine learning use-cases, we use a technique called Supervised machine learning. So named because we train the model by giving it examples of things that we know the answer for. We collect a priori info about a set of houses, The problem is not to learn or specify the mappingbetween these things, but to give examples to a piece of machinery in order that it might learn for itself. This whole premise is conditioned by the fact that we have access to this data. Different data results in a different model. This is a critical insight – much of the software we write can be deterministic, but the dependency of machine learning off a particular data set is critical to success and how things work internally.
Technical Feasibility. MK: Let’s begin by exploring some technical aspects like data sets and models. A common set of axes to begin when thinking about ML is to look at what sort of data we have and how much of it. How complex is your model? What capacity does it have? Put another way: How big is the piece of machinery’s brain? This is somewhat intuitive, but in general, there is relationship between the amount of data you have on the problem and the quality of your results. This matters because we don’t ever build one piece of machinery. Not a matter of installing the machine learning model and walking away, but rather an iterative process. As we collect more data or more complex data we have the opportunity to rebuild the model in some way and ask from it more complicated questions.
More data = better results. There are two dimensions at play here; volume and complexity. Ex: Returning to the house price model, one conception of more data is simply more rows (volume). More types of material, distance, and age. Again this feels intuitive: the more examples the better the results. The other way we can glean more data is by adding columns (complexity). More categories of differentiation can be added, ex: how many bedrooms does the house have? Does it have a pool? Results are impacted by not only how many houses you compare but also what kinds of information you have on each house.
On the data side, what’s more interesting in terms of the relationship to product is the complexity of the model. This is often driven by the complexity of the answer we are seeking. It may be that the question you are asking can’t be answered from the complexity of this data set. This offers lots of flexibility on the RHS/Output side to ask different questions of the data. Maybe this data (on the house) is helpful in answering: How many days will it take to sell this house? Or: Will this house sell in the next month?The less complex the question the less data you need to build a model. In terms of products for machine learning, it’s important to think about: Can we, if needed, reframe our question? Is there a simpler version of the question we are trying to ask? that gives us a better result. There is a trade-off between volume and complexity of data and the complexity of the questions you can ask.
It’s also critical to understand there is never just a single model or one piece of software for machine learning. They end up with lots and lots of models which interact in very complicated ways. Never just one input and out output. Might have input which goes to a model which becomes output, which then becomes input for another model. All the models are doing different things and have different responsibilities.
In thinking around different models and data requirements, there is a continuum of: Where does this model come from? Until fairly recently, you had to build your model from scratch. But as common questions are asked of common data, models have become a commodity. Cloud services and existing models provide a commodity set of capability but don’t differentiate across the market. If you have unique data or a unique question to ask of that data, you may need to build something more bespoke.This gives more flexibility, but comes at a non-trivial engineering cost. You can also use a combination, taking a commodity model and customizing it.
Choices between commodity or bespoke models are further complicated by how rapidly the technology is evolving. Ex: Object recognition technology. Very common and simple to do now. Ten years ago it was inconceivable. Five years ago it was a complicated process. Now, it costs a fraction of a cent and is easily accessible via the cloud. Interesting balance between a relatively new technology that anyone can integrate, but how do you integrate and differentiate relative to your competitors? These are questions to ask when thinking about what kind of model you need to build/use.
Customer Value. [Back to Matt T presenting]. Returning to the matrix between volume and complexity, let’s add another bubble to represent customer value. A basic tenet of product management is that PMs should always be thinking about the value they are delivering to customers. But this sometimes gets lost in the excitement around machine learning. As we increase the size and complexity of the data estate and develop the model capacity, we need to be looking for an increase in customer value that matches that investment. It’s important to set a baseline from the outset. Before even establishing a machine learning experience, understand what it would look like if it were a non-ML one. Ex: If using a recommender, use a simple rules-based system: Products in the same category at around the same price point. This gives you a baseline for measuring customer value. Often there will be a sweet spot between adding to the data estate and improving model complexity. Too much data that isn’t relevant or add value or over-investment in the model without a customer value correlate takes you away from this sweet spot.
Anti-patterns to be aware of when trying to develop customer value in line with investment in the technology:
- The stalled value trap: You’re continuing to invest and moving across and upwards, but seeing no increase in value. At this point you should stop and solve another problem.
- The hype trap: This is common when CEOs want to see ML but overestimate its utility. Simple rules-based systems already deliver high value and a major ML investment is required to match customer value.
- The moonshot: Not so much an antipattern as it can be a valid choice, but there is no payoff until substantial investment (see: autonomous driving). Value relies on complex models and high volume and complexity of data. This strategy is high risk, with no feedback on progressing customer value. Assess whether it is right for your organization.
What the Matts do advocate is a portfolio of complementary approaches. This is the most reliable path. Just as you would have a product portfolio for a set of products, it makes sense to have a set of different investment approaches.
Commercial Viability. Let’s stick with the data estate and ML model capacity axes as frames for understanding how to manage costs. Two major costs and emergent patterns to explore here (NB: Your mileage may vary!): The data cost structure around the x-axis (the data estate) is comprised of the cost of data engineers and the cost of data hardware and storage. Storage is cheap in early stages but the cost grows as complexity and volume increase. The bigger cost is the people cost in terms of data engineers. Often company data is not organized or accessible and you often need to put in a big investment up front to get it into a position that is usable.
On the ML Model Capacity axis, compute costs can be significant but typically have gradual linear growth. Data scientists are expensive and can be explosively so during the transition from generic to custom models. Something original is high risk and high cost.
Usability. Usability depends on the application you’re building, however there is a pattern that applies to most ML-based products. Having an interface which is robust to failure. There is a challenge to developing the machine learning experience up the two axes. It’s important that the UI you create reflects where you are. Ex: Youtube doesn’t aim to solve the user problem of: What’s the next video I should watch? But rather, augments that experience. Gives a selection of videos that might be relevant and mixes various alternatives so that the user can choose from the augmented experience what option they want to pursue.
There is an important difference between augmenting and automating. As we get more confident with the ML Experience, we can be more presumptuous in terms of the interface that we build. Ex: The autoplay feature in Youtube automates rather than augments, confidently assumes you will want to see what it plays next.
Strategy. One thing that makes ML exciting from a strategic point of view is the double flywheel effect. Many products show the revenue-generating flywheel of: Creating a good experience – drives usage – generates revenue – improves experience – attracts more usage. With ML, another layer is added through the unique data that is generated through usage. Usage – generates unique data (volume and complexity) – fed in to improve experience – attracts more usage. Strategically, getting there first with a machine learning product can create an unassailable competitive advantage.
Two main categories of ML opportunity: Value creation vs efficiency. Value creation – building a new product experience through ML technology. This creates new customer value which can be monetized (ex: voice services, self driving vehicles). The flywheel potential means there is utility in getting there first which creates some urgency, but this is also a risky strategy. Alternatively, we can look for value opportunities around efficiency, which can reduce costs and mitigate risks (ex: process prioritization, fraud detection). More incremental progress but also more proven as a road to success.
Delivery. [Back to Matt K.] There are a couple of patterns we see across companies both small and large which follow two axes. The horizontal axis characterizes ML in statistical terms: being descriptive, predictive, or prescriptive. Descriptive applies to things like dashboards: a large amount of data that you want to summarize in ways that can aid humans in making decisions; the distillation of complicated data. People often move from this model to a predictive model. You want to change some levers upstream in your system, change things that are happening in future. Thirdly, prescriptive, where you effectively hand over some aspect of the business to act on your behalf. These are the three core ways that complexity grows.
On the Y axis of complexity, we look at who is doing this. Quite common due to the technical challenges to have a single team working on the problem (‘centre of excellence’). They may then grow into a cross-team or in very high tech companies the mandate may be to do this company wide. Three vectors of note. Descriptive statistics lead to many teams doing simple things,which is inefficient. Conversely, a single team doing very complex things can silo the project and is not ideal. The ideal is a progression over time and capturing expertise not necessarily in people, but in tools and process.