A New Measure of Responsiveness
Hi, everybody.
I'm really excited to talk to you today about the work my team has been doing to measure webpage responsiveness.
We've been working on an experimental new metric, which we hope will one day replace First Input Delay as a Core Web Vital metric.
Since we're thinking about the long-term goal of Core Web Vitals in mind, I wanted to start with a quick recap on the Core Web Vitals program.
The goal of Core Web Vitals is to measure the user experience of web pages.
We do that with a focus on three guiding principles.
First off, each metric should apply to all web pages.
It's really important to us to have broadly applicable metrics that can be shown in all sorts of tools and dashboards.
Second, each of the metrics directly measures a key aspect of the user experience.
Generally, that means we want to measure what the user actually sees.
Like when the Largest Contentful Paint appeared on the screen, instead of a proxy for user experience, like main thread blocking time.
I'll come back to that one in a bit.
Third, every Core Web Vitals is measurable in the field, so you can get the ground truth of what users experience on your site.
As you know, users in the real world have a variety of different devices and they use your webpage in different ways.
And we really want to capture what they're seeing, not just what you see on a specific device locally.
As we dig into the details, I'll explain why this can be tough to debug for user experiences that occur after the page is loaded and give some tips to help you dig in so that your users can get the best experience possible.
No matter when or how they interact with your page.
And that's what we want to measure.
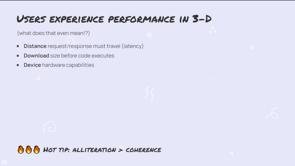
How long does it take a webpage to display an update to the screen after the user taps, a touchscreen, types a key, or clicks a mouse?
Here's an example.
The user clicks the menu icon, and the menu appears, we know from user experience research that users expect a response to this kind of top really quickly within 100 milliseconds or so.
But what if the web page needs to get data from the server or do a long computation to update the UI?
In that case users still expect a quick response to know that something is happening.
Here's an example of a product page, the user taps a different color, and the page is very slow to respond.
As the image loads from the server.
It would be a lot better with a quick animation to let the user know the image is loading.
I want to give an example from my own life of how an unresponsive site can be really frustrating.
My kid has started taking obstacle course classes and he's made huge strides.
He's competing in obstacle course competitions all over the Midwest now.
Here he is at an open gym where it's easy to see what it looks like when he swings from obstacle to obstacle.
Pretty cool, huh?
But when we go to the competitions, it's a lot harder to see.
The gyms don't always have seating in view of the obstacles the kids are running.
And there are a lot of little details that are easy to miss.
Here's some actual competition footage, so you can understand how hard it is to see anything.
This obstacle is called the sky pipes.
They're like monkey bars, but nearly vertical.
And that white thing on the first and third bar.
Is a pipe that spins.
So the kids have to launch themselves up those five bars without slipping, but it's so hard to see.
Did my kid's feet touch the floor when he grabbed that first pipe, did he get to the top line or did he switch over too early?
Did he land on that red platform at the end or did his feet slip a little?
I get really stressed out because I know he's going to want all the details.
As soon as I run up to give him a big hug afterward.
Luckily, the judge enters all the scores in real time on his phone.
And I can see them on a website right after on my phone.
But I'm super distracted.
I'm trying to watch my kid continue his run and answer questions from his aunts and uncles, and also make sure I have the score rate all at the same time.
And when I tap the menu on the site, it just doesn't seem to do anything.
So I think I made a mistake and I click again, but it was opening and now it's closed.
And I still don't know if he hit that landing platform squarely.
This can happen to me two or three times before I finally get the menu open.
I know that the score's streaming dynamically, so maybe it takes a little bit of time to get the data.
But if the site just put like a little skeleton where it was going to load the content, it will be so much easier to use.
And I could be way more focused on my kid.
So that's the type of user experience we want to measure.
But how do we do that?
Let's start from what we have now.
First Input Delay.
It does measure responsiveness, but with two big limitations.
One limitation is that it only measures the First Input on the page.
When the metric was introduced four years ago, for well over 80% of page loads the First Input was the longest one due to the fact that the main thread is often very busy during load.
But over the past four years, some dramatic improvements have been made on the web.
Frameworks adopted platform changes like "is it prepending to prioritize user input while still doing other work?" And many third-party scripts have started delaying work until after user input.
With these big improvements, now the First Input isn't so likely to be the longest.
So we want to measure all the inputs on the page, not just the first.
The other big limitation is that First Input Delay only measures the delay between the user tapping the screen, clicking the mouse or tapping the keyboard and the event beginning to be processed.
That's because it's intended to capture the impact of long running tasks, which block the main thread, but as FID has improved and the long running tasks no longer block user input as often we still have big responsiveness problems on the web.
Over 70% of users have a very unresponsive interaction in any given week waiting over one full second after they interact with the page for any visual feedback whatsoever.
And that's a big deal because 90% of the user's time on a given webpage is spent after the page has already loaded.
So even if you've optimized your page load speed, and the First Input is snappy, there's still a big portion of the user experience you might not be measuring at all.
That's why we've been working on this new metric.
It's still experimental, but we're hoping that it will eventually replace First Input Delay as a Core Web Vital.
It's called 'Interaction to Next Paint' or INP for short.
Let's dig into the details of what it measures.
We'll start by looking at a single user interaction.
The user is on a mobile device and they tap the screen.
In the time it takes for that menu to show up a lot of things happen.
First, the events need to be sent to the renderer.
If the main thread is busy, the events wait in a queue to be processed.
This waiting time is the delay from First Input Delay.
Then the event handlers are run, since this is a touch event, the pointer down and touch start handlers are run, if there are any after.
Additional tasks may run.
For example, a request animation frame requested in the event handler will run here.
So could tasks that were already in the queue.
If the event handlers change the DOM, the DOM is updated.
Big changes to the DOM could cause slow downs in the renderer.
I draw this all as one block for simplicity, but it can be interspersed with the JavaScript work.
Finally, a frame is displayed to the screen, including any DOM updates.
This is when the user sees an update.
Note that I've drawn this in the same line as the other work for simplicity, but the update to the screen is actually done on a separate thread and it doesn't lock the main thread, like all the other work shown here.
But we are only halfway done.
A lot of the time, all these things happen quickly and the user hasn't even lifted their finger back up by the time that frame is presented.
When the user does lift ther finger, the second half of the interaction begins.
First, if any task snuck in on the main thread while the finger was down, we need to wait for those to finish.
So we might have more delay here.
Next, there are more event handlers to run since this is a touch event.
Pointer up, touch end, mouse down, mouse up and click handlers will all be run, if there are any.
Then again, additional tasks may be run.
And if more updates were made to the DOM, the renderer processes those.
Then another frame is presented and the user sees the full result of everything that happened in response to their tap.
The whole sequence is pretty similar for other interactions, except that the event handlers are different.
Here's what it looks like for key presses.
You can see that when the key is pressed down, there are key down and key press events.
And when it's lifted, there's a key up event.
Sometimes the interactions can overlap.
If the user lifts their finger before the first part of the interaction is complete.
In that case, the two parts of the interaction get smushed together like this.
And the second half has to wait for the first half to finish.
So you can see there are a lot of different things that can happen during user interaction that can slow things down.
So we want to measure the whole thing when the user starts to tap until they see the results on the screen.
Except for one important detail.
What if the user is a lot slower than the webpage?
Let's say the user takes a full second to lift their finger after pressing a key, but the webpage was lightning fast and handling both the key down and key up parts of the interaction quickly.
It's not helpful to report to the webpage that it took a second to respond, when the page was fast and the user was slow.
Instead we need to consider each half of the interaction separately and report what the webpage is responsible for.
In this case, we will consider the time waiting on the page for key down and waiting on the page for key up, but not the time waiting on the user to lift their finger.
So then how do we report the value for the interaction?
What we'd like to report on, is the two areas in gray here-the key down and key up parts of the interaction and leave out any time spent waiting for the user.
The two main choices are to report the total of key down and key up summed together, or report the maximum of the two, because each part can generate a frame in response to user interaction.
We think we should consider them separately and report the maximum.
If webpages shift work from the slower part of the interaction to the faster part in order to make the maximum duration shorter, the longer the time the user waits for an interaction, the longest time the user waits for an update is shorter.
So we think the metric should account for that.
So for every interaction we're recording the maximum time from user interaction until resulting update to the screen.
Now that we've decided how to measure a user interaction.
We need to figure out a way to aggregate the user interaction for each page load into a score for the metric.
We added several variations to Chrome so that we could do a large scale analysis of the alternatives.
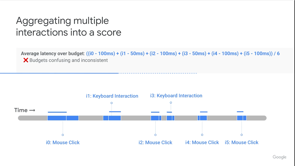
I'll use this example, timeline of six interactions on a webpage to talk through what we found.
First, we thought about measuring the total frustration the user experiences over the course of the page being open.
We took a look at using the sum of all interaction durations over some acceptable budget, like a hundred milliseconds for a click and 50 milliseconds for a key press.
This is really similar to how the total blocking time metric sums up the impact of main thread blocking work during page look, but there were some problems with this approach.
First, the developer feedback we got about these budgets was very negative.
It's easy to confuse them with the threshold for a good score and having a lower budget for keyboard interactions could discourage people from implementing keyboard accessibility.
And we also heard about interesting examples that blur the lines between keyboard and click or tap interactions.
Like when you type on the virtual keyboard in Wordle.
More importantly, the budget didn't accomplish its goal here, which was to score sites fairly, whether they had a small or large number of interactions.
We consistently saw sites with more user interactions, fairing worse on the sum of latency over budget approach, even though they didn't appear to have a worse user experience.
So we ruled this one out.
We also implemented a second approach that took budgets into account.
We wanted to see what would happen if we looked at the average interaction latency, but some interactions are very fast, no ops, like when the user accidentally clicked something that doesn't have an event handler.
We didn't want to include these in the average.
So we looked at average interaction latency over budget.
Of course, this approach still has all the downsides of using a budget in our calculations.
We also evaluated it by comparing it to the maximum interaction duration.
We found that often large interaction durations are hidden among small ones by the average.
Users tend to remember these large durations, and we didn't want the average to gloss over them.
That's why we ruled out this option.
So maybe we should just look at the maximum duration, then?
It's quite simple to calculate and understand, and it highlights the user experience of being frustrated with the longest interactions well.
On most pages, it works really well.
That's because most pages have fewer than 10 interactions.
So the worst one really stands out.
But some pages have many, many interactions, like document editors where you type for long periods or games where you're continually clicking.
The maximum interaction durations for those pages usually ended up being an outlier, which didn't stop the user from interacting a lot.
But we had implemented a slight tweak to the maximum duration, which works really well for these pages too.
Just use a high percentile.
This is effectively the same as the worst interaction duration for pages with fewer interactions.
But we found that it's much more accurate for pages with very intensive user interaction.
So we decided to move forward with this approach.
So that's Interaction to Next Paint, a high percentile of a maximum event duration for each page load, you can get the complete details at web.dev/inp.
Like the Core Web Vitals metrics we have recommended good and poor thresholds for INP.
These should ideally be met by at least 75% of your site's page loads.
We look at two things when creating thresholds, the first is user experience research.
The existing user experience research we looked at when setting the threshold for First Input Delay and the rail guidelines is still the same-users expect a response within 100 milliseconds of an interaciton.
But we also take a second factor into account when setting thresholds for metrics.
Achievability.
When we looked at what's possible on the web today, we found that devices with two gigabytes of RAM or less are not consistently able to respond to user input within 100 milliseconds, even on sites that perform very well otherwise.
Accounting for achievability on low-end devices, we came to a threshold of 200 milliseconds for good INP and 500 milliseconds for poor.
Now that we have a new metric, do we think it's an improvement over a First Input Delay?
Yes, we do.
We're continuing to research the impact of Interaction to Next Paint on web users through user experience research, and also talking to various sites about what they've learned about user impact as they improve responsiveness.
When we look at the data we have in Chrome, if we split users into groups of those who experience good Interaction to Next Paint 75% of the time, and those who do not, we see that the user's experiencing good Interaction to Next Paint load twice as many pages as users who do not.
While it's hard to fully pull apart correlation and causation, Interaction to Next Paint appears to be very well correlated with good user experience.
And it clearly meets our goals, of measuring more than just the first user input and more than just the delay.
But we also heard a deeper concern about First Input Delay from Web Performance experts that we feel Interaction to Next Paint addresses.
That concern is long tasks on the main thread.
People from the Web Performance community often bring us performance test runs like this.
There's so much JavaScript running and blocking the main thread.
It takes seconds at a time.
Why don't we have a Core Web Vitals metrics that tells you not to run JavaScript for seconds at a time?
That goes back to our goals with Core Web Vitals I mentioned earlier.
It's very important to us to directly measure the user experience.
If there is a long running task on the main thread, it may or may not affect the user experience.
Maybe it happens early in the page load and delays the page from loading it all.
That will be captured by Largest Contentful Paint.
Or maybe it happens when the user is trying to interact with the web page and the page freezes instead of responding.
That is what the delay in First Input Delay is intended to capture.
But as you'll remember, First Input Delay is capturing fewer and fewer of those delays as frameworks have adopted web platform features like isInputPending to avoid delaying user input.
And as third parties have delayed loading heavy script until user interaction.
So is the web fixed?
Or is main thread blocking still a problem ? It's a complicated question, but we believe that Interaction to Next Paint is capturing a lot more of the user pain that we're concerned about with JavaScript heavy sites.
We looked at the total blocking time metric, which sums up main thread blocking time during page load.
We did an analysis of HTTP archive, taking the total blocking time, calculated from lighthouse for 3 million sites and correlating it to both their First Input Delay and their Interaction to Next Paint from the field.
We found that Interaction to Next Paint is twice as correlated to total blocking time as First Input Delay.
So sites, which block the main thread with lots of JavaScript are performing worse on Interaction to Next Paint than they were on First Input Delay.
And although Interaction to Next Paint shows that the majority of sites on mobile have good responsiveness at the 75th percentile, if we split out the head and torso sites, we see very different results.
Only 35% are rated good.
In the long tail, there are a lot of simpler sites with little JavaScript and great interactivity, but a lot of modern sites under heavy development are starting to include more and more JavaScript, both as part of their main bundle and in third parties.
And we're seeing the effects of this in their INP scores.
Okay.
So Interaction to Next Paint is capturing a real user problem.
Maybe it's capturing a real user problem on your site.
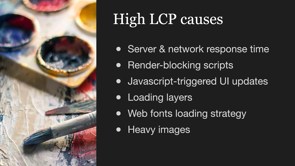
How do we improve it?
Before we can improve it we should first measure it.
What is your site's INP?
You can check the Chrome user experience report to get a quick idea.
To monitor it more closely, you can use the Web Vitals dot JS library to do field monitoring on your site, and you can use the Core Web Vitals Chrome extension to monitor your score as you browse.
You can also automate interactions with lighthouse user flows to make sure your site's most important interactions stay fast.
Once you've got it measured, you can start improving it.
As I mentioned earlier, Interaction to Next Paint is correlated with total blocking time.
If you run lighthouse and follow its advice, to reduce the amount of main thread blocking JavaScript, you'll likely find a whole lot of low-hanging fruit that makes Interaction to Next Paint better and improves the performance of your site overall.
If you haven't taken a look at what JavaScript is blocking the main thread of your page lately, this is a best place to get started.
But as you optimize more and you fix the things that are easy to reproduce in the lab, the work gets harder.
I want to go back to the third point I made about the Core Web Vitals program at the beginning of this talk.
Every Core Web Vital is measurable in the field.
So you can get the ground truth of what users experience on your site.
It's really important to focus on what real users are seeing.
So that's what we measure, but most of the tools we use to improve web performance focus on the initial page load and users interact after the pages is loaded.
When their interactions are slow, how do you know which interactions and what went wrong?
Since we want to improve performance for real users, we should start with real user monitoring.
The event timing API, in Chrome has support for interactions.
So you can see what types of interactions were slow and which elements were interacted with.
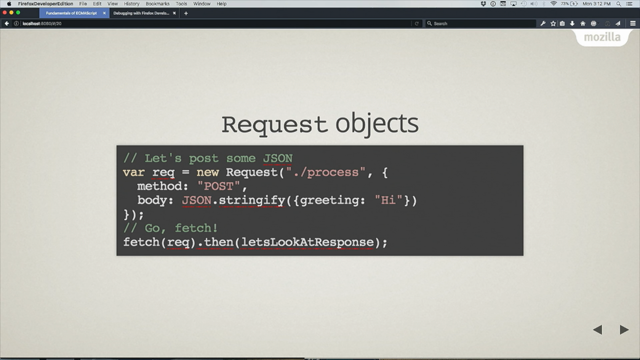
For this next part of the presentation, it may be helpful to open up the slides yourself so you can copy and paste the code I'm using.
I've learned a lot about responsiveness on the web, just by pasting some of this code into the developer console.
Give it a try.
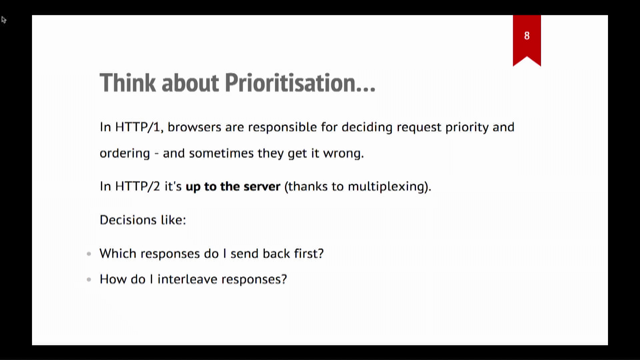
One of the most important things we want to know from the field is which interactions are slow, and digging into that means understanding which elements were interacted with.
If you check the blog post linked in this slide about debugging Core Web Vital in the field, you'll see that it uses CSS selectors to report this kind of field data for other Core Web Vitals metrics.
For example, you could report which element was the LCP or which elements had the biggest layout shifts.
We'll use the same code to report which elements were enacted with.
Go ahead and paste this in the JavaScript console.
If you're following along in your browser, now that we can identify DOM elements, we can use the event timing API to report on which interactions are slow.
As of this recording, the event timing API is available in Chrome and Firefox, but the interaction ID is only available in Chrome.
We're working on a polyfill to support other browsers as well as possible.
The code on this slide reports to the JavaScript console.
If you're following along in your browser, go ahead and paste it into a page and then interact with the page.
You can see the output for yourself, as I explain, when it does.
We're using the performance observer interface to observe event timing entries in the performance timeline.
The performance timeline is just a long timeline of every performance related thing the browser logged.
Every time there are event related entries in the timeline, our simple function will be called.
It checks to see if each entry has an interaction ID.
If it does, it prints to the console, what type of event the interaction is from, what the duration of the interaction was.
What the target of the interaction was using our CSS selector function from the last slide.
Note that the event timing API does not report interactions with durations under 16 milliseconds for privacy reasons.
So you may miss some interactions in the console due to that limitation.
One thing that's nice about the event timing API is that it attaches the interaction ID to each JavaScript event so that if you observe event timings this way you'll automatically have the start and the end of the interaction reported separately.
So what does this code log?
You can try it yourself in the JavaScript console, but here's some examples.
I press a key in a search box.
It logs a key down interactive.
And the down part of the interaction is fast-its duration is 16 milliseconds.
We can see that the target of the interaction was the element with the ID 'search'.
So it will be easier to figure out from this report that the user typed in the search box.
Note that there were no key up handlers for the search box.
So the key up part of the interaction ran even faster.
Since it was under 16 milliseconds, it was not reported by the event timing API.
Next, I tap the button to open a menu on a mobile page.
The pointer down duration is 16 milliseconds, and we can see that the target is a button with class 'mobilemenu'.
The click is the second half of the interaction.
Its duration is 50 milliseconds and the same button is the target.
Then on desktop, I click an image with the mouse to enlarge it.
I can see that the first part of the interaction took 40 milliseconds.
And the second part took 152 milliseconds.
And the target was an image with class css-pa8cd.
I found it was pretty easy to get a basic feel for how long interactions take just by playing around with a code like this on the console.
But the really useful thing about the event timing API is how you can use it in real user monitoring.
As I said earlier, there are already some really great techniques out there for reporting the CSS selectors of important elements to Web Vitals metrics.
The linked blog post goes into detail on how to get the most out of the data.
You can use tools like Google analytics and BigQuery to get the CSS selectors of the elements users are having the slowest interactions with.
And once you do that, you'll have a great burn down list of problems to debug.
So let's get started the debugging.
In order to make it easier, to understand how to debug events, my kids and I put our heads together and made a really simple game to demonstrate some issues with responsiveness.
You can follow the link if you want to play along.
Before we get started, let's add a slight modification to the code we were typing in the console earlier.
Instead of logging each interaction to the console, now we're going to add a user timing measure instead.
These will show up in the dev tools performance panel, which will make it a lot easier to understand how interactions are measured.
In our cookie clicker game we run this code when the page loads, so it's already there.
Back to our cookie clicker game.
Here is version one.
It listens for the click event on the cookie element.
When the click handler is called, it updates the score and changes the content of the DOM element that displays the score.
It's not the greatest code, but hopefully it's easy to understand.
So let's open up the game and profile it.
We'llgo to Chrome dev tools and open the performance panel.
Then we'll hit record and click the cookie.
If we click it quickly, it'll be easier to find a click in the recording.
Next, just as quickly, we want to hit the button to stop recording.
This should give us a nice short recording with just one interaction.
Now let's take a look at our first recording.
There are two main tracks to look at, to get started.
First, the timings track has those user timings we talked, we added to track interactions.
You can see that the click and pointer up interactions overlap.
They're both part of the second half of the interaction.
If you hover your mouse over them, you can see that they only took 16ms.
That's great.
That means our cookie clicker is running at a blazing fast 60 frames a second.
Next, you can look at the main track to get a better understanding of what's happening during the 16 milliseconds.
You can see that a good chunk of time was spent in the click event handler.
Our increaseScore onClick JavaScript function adds one to the global score variable and then updates the DOM.
It ran for 6.48 milliseconds.
Then more tasks were kicked off.
In purple we see the layout tasks that ran because we changed the DOM.
And then in green, we see the paint system repainting, but if it's painting doesn't that mean it painted to the screen?
Why does the interaction go on after the paint finished?
The answer is that the paint tasks are just deciding what to paint.
Once that's done the frame is sent to the compositor.
It's displayed at the current frame rate.
We're running at 60 frames per second, which is one frame, every 16 milliseconds.
So our interactions won't display to the user faster than that.
So our game is really fast.
That's exciting, but my kids are more concerned about adding new features.
You know, what would be really cool?
If the cookie changed color every time you clicked it.
And you know, what's even cooler?
We can do that easily in CSS.
Let's add it to the pointer down handler.
Now we'll open up version two and do another recording.
And now we see that there are two interactions.
The first one is a pointer down interaction.
It makes sense that this one is shown now because we just added our changeCookieColor function as a point down event handler.
But this is interesting.
The function ran in 6.61 milliseconds.
And yet the pointer down interaction took 56 milliseconds.
Where did all that time go?
I'll let you in on a little secret, we were so excited to make a cookie clicker game that we never stopped to optimize the cookie image.
It's absolutely gigantic.
And now that we're changing, it's hue, there's some extra work to be done that's a bit hard to see in the devtools performance panel.
If you see a big gap like this consider whether you might be doing some work on a large image.
On the second one is the click interaction, which still does the same work it did last time and it ran a little bit faster than.
But again, because of the frame rate, the whole click interaction took 16 milliseconds.
The third version of our cookie clicker brings more updates.
First.
Why call it version three?
When you can call it version 3.5730?
The kids are really helping me be more creative.
Second, you know what's the coolest thing about cookie clickers is that you can get an upgrade and increase your score by more than one when you click.
So let's go ahead and just give everyone an upgrade.
It increases your score by one plus a random number when you click, except we want the number to be really random.
So we call the random number generator 10 million times.
This is super cool.
And now our score is shooting up randomly.
But, it does seem like maybe all those random number generator calls are a bit slow.
You can see that the cookie clicker seems a bit out of sync now, when we click the cookie changes color right away, but then it takes a bit for the score to follow suit.
Let's look at the performance panel to see what's happening.
The same as before we had two interactions.
The first one is the pointer down interaction, which changes the cookie color.
But now the second interaction is a lot longer.
We're spending 170 milliseconds in increaseScoreMoreRandom when we spent less than 10 milliseconds in our old increaseScore.
All that additional work slows down the time it takes to display the new score on screen.
And that means that there's a noticeable delay between when the pointer down interaction changes the cookie color and when the click interaction updated the score.
I think it's time to talk to the kids about how random number generators actually work.
I used a toy app my kids and I were building, as an example of how adding lots of things to your site can weigh down the interaction time and how you can debug it.
But let's look at a real-world example of a slow interaction.
I clicked a product image and I got a long wait.
When I dug into the performance panel, I saw multiple different event handlers running in each interaction.
If you're just tracking the time each individual event handler takes to run, you'd miss a lot about how they add up.
Make sure you're looking at the whole interaction when you're measuring performance.
Here's another slow interaction from the real world.
I loaded a news article and opened the menu.
The first thing you'll notice, is that there is a lot going on here.
The biggest pieces of work are happening in those two evaluateScript tasks that ran in the middle of the interaction.
The third party scripts running on a timer.
They're not part of the interaction at all.
They just happened to run in the middle of my interaction because they are running all of the time and they really slowed things down.
The rest of the yellow tasks are the event handlers, but a lot of those are from third parties too.
Half of the ClickHandler time is spent in third party code.
Only in those tiny snippets circled in blue are the code that the site actually wrote to handle the interaction.
Make sure you're looking at the cost of third parties you include in your site.
And that's a wrap for Interaction to Next Paint.
I hope you enjoyed the talk.
The new metric is still experimental and we haven't made a decision whether to include it as a Core Web Vital metric yet.
If you have feedback, we'd love to hear it.
Our email address is web-vitals-feedback@googlegroups.com.
Page load time is an important aspect of performance, but it’s not the only one. After a site has loaded, it should respond quickly to clicks, taps, and keypresses. But this can be difficult to measure and optimize.
I’ll talk about the Event Timing API and how it can be used to measure interaction timings in RUM analytics and lab tooling. Then I’ll dig deeper into understanding where the time is going, breaking down the problems that end users are seeing and reproducing them in the lab.
Finally I’ll talk about some common problems my team and I have seen as we’ve dug into how responsive web sites are to user interactions, and how to avoid them.