Fully Scripted
Hey everyone.
I am super honored to be opening Global Scope - such a great lineup, lots of great presentations and folks coming after, you know?
And Web Directions always does such an amazing job with their events And I love events like this!
Like the single track focused on a narrow subset of the web, so you can go nice and deep on the topic.
Although I guess you could argue that today's focus - JavaScript - isn't particularly narrow, at least not anymore.
You know, if you look back at kind of where JavaScript came from, I always felt like it had the most humble beginning out of the three sort of core web technologies that we see on the front end, HTML, CSS and JavaScript.
You know - HTML, the 'OG' - kind of kicked everything off, right?
You can't do anything without the markup!
You know, CSS started with specifications.
JavaScript though was sort of the love child of two separate approaches to add scripting capabilities to the web -two different browsers, two different approaches to scripting took two different names.
There was no standardization or specification at all up front, so the JavaScript stuff kind of came along a bit more ad hoc than the other two, and you fast forward today and it is all over the place.
JavaScript no longer just runs in the browser on the person's device.
We now use JavaScript to increasingly power the backend - - running it on the server with node.
Thanks to Edge Computing and things like CloudFlare Workers or Fastly's Edge Compute or optimized edge workers, we now can run JavaScript on the CDN layer, letting us do incredible customization and personalization off of the client browser and on that CDN layer instead..
JavaScript for a while now has been powering the most popular build tools extending what developers can do.
We've seen it infiltrate all of these key parts of the stack.
You know, developers love JavaScript.
Looking back at the 2020 version of the Web Almanac - - this is a report that's put out every year powered by HTTP archive data, which catalogs millions of sites so we can see the characteristics of how those sites are built.
One of the things that the markup chapter revealed is that the sixth most common HTML element the sixth most widely used element was the script element Well first off - sixth place - - you know, depending on I guess whether you were an overachiever you were as a kid, sixth place may or may not sound all that impressive, but do consider that there are somewhere around 130 elements in the latest version of the HTML spec..
So sixth place is pretty darn good!
! Also, if you look back historically - they compared in that chapter to 2005, where there was an attempt to try and catalog again, the most common elements - script wasn't even on the list to be found.
Now it's sitting there right outside the top five, we use the script element more than we use the paragraph element, which you know, is a little bit alarming to me, right?
It's a little unexpected...
that order I would have expected to - at least those two elements - be flip-flopped, but we love our scripts and we send more weight down than ever before.
If you look at the median bytes by content type that we send to a mobile device - we send 427 kilobytes of JavaScript.
Now compare that to mark-up.
We send 27 kilobytes of HTML or 66 kilobytes of CSS.
That is a dramatic difference.
Now, the upshot of all of this JavaScript is again, we've extended what the front end developer can do.
We can touch all sorts of different areas of the stack, and we can also create some incredibly immersive and rich experiences.
Now, this example from Sarah Drasner is a few years old at this point, and yet every single time I see this, I am just blown away.
You know, the transitions are so seamless and fluid and frictionless.
You see things kind of morphing and transitioning from one state to another, which can be a really great clue to the user, like how things are changing and how data and different views are connected to each other.
It's just a really impressive view, and certainly something that 10 years ago, I would have never thought possible, right?
And this is the kind of thing we can do now because of how powerful JavaScript has gotten.
But - everything has a cost.
And one of my favorite things to say - I've been saying it for years, is that everything you add to the page better have value because everything absolutely has a cost.
And that's true for JavaScript, perhaps, especially true for JavaScript.
WebAIM, the Web Accessibility In Mind does an annual report where they look at how many accessibility errors can they identify on any given page.
One of the things they break that down by is when they can detect a framework or library is being used.
So what you see here are two different tables showing frameworks and libraries detected on homepages that they've tested, and the average number of accessibility errors.
That last column, that percentage difference is the difference between for example, pages with React running and the average page period.
So what we see here is that ery framework and library - with the exception of React - which is notable, I think, cause React, you know, tends to get beat on quite a bit when we talk about these things - but every other framework and library is widely associated with more accessibility errors than the average page online otherwise.
We see the same thing from a performance perspective.
JavaScript is very tightly coupled to how well a site or page performs, and it's easy to shoot ourselves in the foot.
Jeremy Wagner, who's got a great book coming out called: Responsible JavaScript - if you enjoy any part of this conference, I highly recommend checking that out as soon as it's available - but he looked at HTTP archive data and what he did was he broke down the Main Thread processing time by category.
So looking at HTML parsing time versus script processing versus style layout versus rendering and painting.
Now what he was after here was, you know: How do we change?
How does that differ when we look at those percentiles?
Both at the starting point and some of that long tail.
And what you see here is that at the beginning, JavaScript processing is pretty much in line with the others.
But very quickly, as soon as the 20th percentile -15th percentile actually, we're starting to see a little bit of separation there - script processing takes off - and once you get to that P 75, it is an exponential difference between that and the amount of time we spend on these other tasks.
Now, the "So what?" here, the thing that I find fascinating is that this means it is way easier to shoot ourselves in the foot with JavaScript than it is with these other tasks.
It is relatively comparatively difficult to cause all sorts of havoc on the Main Thread from anything else - from HTML - certainly certainly - but from styling from rendering or painting - script blows that away.
It's an easy thing to destroy the performance of our sites if we're not careful.
So what I want to do now with the rest of this presentation is - let's dig in.
Let's look a little bit at how we're using JavaScript, what we're using, um and what the implications are there, and then let's see if there are a couple things that we can do to hopefully offset some of the costs that we're paying upfront.
So, again, going back, let's start with the size here.
Uh The median mobile site is sending 427 kilobytes of compressed JavaScript down.
Now, this is problematic for a few reasons.
The first and probably the most basic is just the impact that JavaScript has on the initial loading state of our pages and applications.
When a browser is parsing the HTML and it finds a script element, it stops everything.
It stops parsing the HTML, it doesn't try to request other assets.
It stops until that script has been downloaded and then executed.
Now, once that script has been downloaded and executed, then it will resume parsing and continue on.
We can see the impact of that Um by using a simple example with a file that we're going to attach - a JavaScript file with a 2.5 second delay.
Now for this I'm using Slowfiles, which is a very straightforward service built by Ryan Townsend and Harry Roberts.
Um I use it a lot though.
Uh It lets you pull in a JavaScript or CSS request with a delay attached and it's really helpful for things like this.
Like I want to visualize - what is the impact from a performance perspective of loading a file in a particular way.
So I can add that delay, I can see that exaggerated impact and see exactly what's going on.
So inside of Chrome dev tools itself, um we've got this performance panel, and what we're seeing here is - we've got the Network Activity and underneath that we've got all this Main Thread activity - that's those little slivers down at the bottom.
Um So what we're going to do is we're going to zoom in here on the uh Slowfiles request.
This is our JavaScript request that I talked about - that 2.5 second threshold, or I'm sorry, delay.
Um You can see it takes 2.6 - - 7 seconds or so to arrive in this case.
So let's go ahead and zoom in on the actual Main Thread activity now.
And we're going to move all the way over to when we first find that file to see what the browser is doing.
So here we have: the request has been initialized.
We look down on the Main Thread to see what's going on, we see the request being sent, Uh and right here we see the HTML being parsed.
So at this point we see that what happened was the browser parsed the first six lines of our HTML, then it found this blocking script element and it went ahead and made the request for that script element.
Now notice what happens to the Main Thread as we start to move back to the end of this file request arriving from the network.
So again, we've got our HTML, we're going to zoom over here and try to get to the end.
Notice how there's almost nothing happening on the main thread at all until finally, that file arrives here.
Now, if we go down to the end, we can see the response received and we see the browser starts resuming the parsing of HTML finally on line seven, a full 2.7, 2.8 seconds later.
That's what JavaScript does out of the box.
It is parser blocking and as a result, it blocks display of the page and it blocks the HTML parser from doing any additional work.
Now, this was an issue that, you know, outside of those blocking script elements, sometimes it can be a little difficult to track down.
Thankfully, we've seen some improvement there from a tooling perspective.
The Chrome dev tools protocol now ships a flag in the trace to indicate whether a resource is render blocking or not.
At WebPageTest, we've started taking that render blocking flag and if we see it, we put a render, blocking icon next to it to signify that this is a problematic request.
So in this case - requests four and five - you can see we've got a blocking JavaScript file and a blocking CSS file.
So how do we fix this?
Well, the first thing we could look at is adding the 'async' attribute.
So here's our same script, but we're going to use async instead.
Now this changes that loading behavior in the browser.
Now, when the browser finds the script element, it will download the script element in the background while it continues to parse HTML.
Now, as soon as the script arrives, it's still going to stop everything at that point to execute the script.
Async means that the downloading is done in the background, but the execution still could potentially be blocking.
And once that execution is completed, then we finish up whatever parsing work we have left.
So this means that async blocks the parser when the script arrives, which means it's a potentially blocking resource.
If that script arrives before we get something out on the screen, it blocks display of the screen.
If that script arrives after we get that initial paint, well, then it was non-blocking in that situation.
So that Chrome dev tools flag that we mentioned, they're giving that render blocking status of potentially blocking for these sorts of resources.
So again in WebPageTest, if I click on a request, I can see that surfaced right now marked as potentially blocking - meaning if it arrives before Start Render, it's blocking, otherwise not.
Going the next level, taking this even further, we can use the 'defer' attribute.
So when a browser comes across a script with a differ attribute, what it will do is: it will request the script, download it in the background, and then it will continue all of its work.
It will parse the rest of the HTML.
It doesn't execute that script until all the HTML has been parsed.
It defers the execution until the very end.
From a performance perspective, this is our best approach.
Unfortunately, when I was digging into this data for the Web Almanac, in the 2020 version attribute present on 12% of the scripts and defer was present on 6% of the scripts.
Considering the massive performance improvements we can get by using these two attributes, those results are a little bit discouraging.
Now it's possible we have some visibility issues here - as I said, it can be tricky sometimes to tell if it's blocking or not, particularly if you don't spend all day looking at those kinds of things.
So I'm hopeful that by having that flag and having those indicators surfaced in WebPageTest, eventually surfaced in Chrome dev tools, almost certainly surfaced in other tools that might be consuming that same data - I'm hoping that that visibility leads to broader adoption of these two attributes, because there's a lot of low hanging performance improvements we can get from using them.
Now the other angle of looking at this 427 kilobytes of median JavaScript bytes that we send down: The thing that jumps out to me is when we dug into this, we found out that 35% of that is unused.
So in other words, we're shipping 427 kilobytes of JavaScript.
But during that initial page load process, we're only using about two thirds of that.
The rest of it maybe we need later.
Maybe we need for when a user takes a specific user interaction or routes to another page, but we don't need it right away.
Identifying this unused code is getting easier.
We have tools that you can use in your build process, like Webpack Bundle Analyzer that lets to see the breakdown.
To get that coverage, we have things like Lighthouse now shipping with the tree map plugin.
But the one that I've been using for a very long time is - a very long time - at least it feels like a long time - in real world years it's probably not that long - this is kind of like dog years versus people years.
But Bundle Wizard.
Bundle Wizard is a great utility.
You can run it from your command line, pass it through a site's.
URL, and what it's going to do is if it's going to go out and find all the JavaScript, figure out how much of that - loading it up I believe in the background on puppeteer - watch how much of that is actually used.
Then it's going to give you a report that shows you both the, where the file size breakdown is coming from as well as how much of each of those different bundles and files are actually being used during that initial load process.
So in this report - this is a Reddit report - you can see the resource maps for a few files, which is why we have those detailed blocks telling us all the individual pieces in the JavaScript file.
In the case here, what I've highlighted is this HTML5 stream player/index.JSX, which is part of the legacy comments page bundle.
And it's red, and it's red because there's not very much of that code that's actually used.
In fact, it's saying about 4% which is almost certainly just a simple little installation thing - like it's not actually doing any work right now, probably because my guess is: a) It's legacy, so maybe it's not used at all on this particular page, or it's just one of those things that's not going to execute until the user takes some interaction.
So when we see something like that, when we see these orange and red blocks, these low coverage things, those are indications that, "Hey, maybe we can take a different approach to bundling, to try and push those off to a different bundle.
Maybe we can lazy load that bit of code?" You know, something like that to break it out and get out of that initial path.
Another one of my favorite tools when I'm looking at things like this is Bundle Phobia.
Bundle Phobia is a great site.
There's actually some great tools built on top of this as well.
What it lets you do is look up any particular package or bundle.
So in this case: Moment -a popular date manipulation module, and you can see the bundle size for 'Minified','Minified +GZipped', an approximate download time - a bunch of other information.
The thing that really I like about these is that it's shows you similar packages.
So it says, "Hey, you've got Moment.
You're looking at it, but there's also these other date manipulation libraries that may be able to help you.
You know - dayJS is only two kilobytes, date-fns is 16 kilobytes." We can see that they're significantly smaller.
We also have this, a little leaf icon that indicates that it's 'tree shakeable', meaning that our build tools when configured properly, may be actually able to weed out some of that excess weight.
Along that line, it does depend on how we're importing those modules into our actual projects.
I had one client that I worked with when I was still doing consulting full-time where they were using 'AWS-SDK', and this was how they were importing it.
They were really only using the 'CognitoIdentityServiceProvider from the SDK, but by importing it in this way, the entire SDK got pulled into their bundle.
When we switched that line to this, which was we just required directly the full path to that individual provider, we ended up reducing their parsed bundle size by 1.65 megabytes.
So now, disclaimer, usually you're not going to get that massive an improvement from a one or two line change like this, but it does make a good story to tell.
Now most of the time you're going to be chipping away at that iceberg a little bit.
But this is - making sure that you're paying attention to how you're importing those modules and components is important.
The other thing that I think can help us here in terms of size is just having better defaults.
I worry a little bit that right now, our default posture is to err on the side of popularity or dev convenience, rather than what actually may be the right technical solution for us.
One of my favorite examples here is Preact versus React.
I am a huge fan of Preact.
You know, if you're not familiar, Preact is a fast 3kb alternative to React with the same basic React modern API, which means that if you're comfortable writing React, writing in Preact is a seamless transition.
In fact, it works out of the box with a lot of the React ecosystem.
That lightweightness obviously helps quite a bit from the bundle size perspective.
I did a workshop one time where we did a half day hackathon, and in those four hours or so of the hackathon, one of the teams actually went and rechanged their - like swapped out - React for Preact, and they had time to spare.
Cause I think the last hour or so was just us sharing findings from each individual team.
So sometimes that migration is very very quick and painless.
Not enough companies do this.
I feel like we all kind of reach for React way too often.
What I'd love to see is - I'd love to see that default posture is - if you're going to, or considering a React-based application, start with Preact and use it until you can't, then pull in React.
I joked the other day that I think some of this could be positioning.
You know, Preact calls themselves a fast alternative to React.
I feel like maybe React should change their tagline to be "a slow, heavy alternative to Preact".
We'll see what the branding and the positioning does there in terms of adoption.
We have seen some information on this, like some companies talk about this.
Most recently Etsy.
You know Etsy, they posted on Twitter.
One of the developers there that they've switched officially now to Preact.
They gave a lot of information around why they made that decision, why they made the switch.
Of course what jumps out from our perspective of our conversation here is that Preact bundle was about 6KB gzipped versus 38.5 KB gzipped for React.
It's not just about the bundle though.
Again, going back to Jeremy Wagner - who we mentioned earlier - he wrote a great article on CSS Tricks where he took an example, he built a mobile navigation and he had it triggerable in three different ways.
You could - one version was triggered by a React component, one by a Preact component, and one by vanilla JavaScript, just 'addEvent Listener'.
And what you see here is the time that it took for that navigation to open as measured inside of Chrome dev tools.
So Preact is in most - across the board here is what?
Three to four times faster - the code that it took to execute to open the navigation.
And vanilla JavaScript's even faster than that - half the cost of Preact - sometimes even lower.
So it's not just about the bundle size, but about that execution size.
And this is an important piece.
I think we talk a lot from the performance perspective right now around how to reduce our bundles.
How do we get our JavaScript sized down?
And that's all great stuff, that's important, but it's not just about the size, it's about the execution as well.
How much time are we spending on that main thread - going back to Jeremy's chart from earlier - doing processing, doing code execution?
Because that stuff blocks the user from doing things they want to do.
I did some research into this a little while back where I looked at a bunch of URLs on HTTP archive to try and see, you know, what's the processing breakdown based on the things that we use?
And so what you see here is a graph that shows a breakdown of the mobile processing time on the main thread related to JavaScript.
For all sites - just sort of as a comparison point - and then for sites with jQuery detected and Vue detected and Angular and React.
So the line all the way to the left signifies the P10, the 10th percentile.
To me, this is like pretty much the best case scenario.
The overall median is about 356 milliseconds.
And you can see that with each framework that we're using, it's getting a little bit slower and slower.
With React, that 10th percentile, that best case scenario is 2.7 seconds.
The 90th percentile is where it's really concerning to me.
That's where we see, you know, the overall is around 10.4, 10.5 seconds, but then you jump up into something like React again and we're seeing about 20.8 milliseconds, or I'm sorry, 20.8 seconds for actual processing time on the main thread on a React-driven site.
Now to be fair, this chart is looking for: Does this framework exist?
When I was showing this data to someone they pointed out, "Well you know - what if they're in the middle of a migration?
What if there's multiple frameworks?" So I decided to look at the processing time when only one framework was detected.
The interesting bit about this is React to gets worse at the 90th percentile when it doesn't have jQuery next to it, it turns out react and jQuery are paired.
A lot.
A lot of people are making that migration.
The 10th percentile, it gets a little faster, about 300 milliseconds faster.
The 90th percentile gets a good four to five seconds slower.
So it's actually worse when it's on its own.
So we spend a lot of time with these sites, with these sort of modern spa, virtual Dom driven frameworks, a lot of time processing and executing that code on the main thread.
And so, as a result, when I'm analyzing sites, I see a lot of them.
Um This is again, Chrome dev tools.
All that yellow is script execution, script related work, and the ones that are flagged here with the little red triangle, the little red ones.
Those are long running tasks.
Those are tasks that take 50 milliseconds or more.
Um This is a react driven site.
I have about a four X CPU throttle off my MacBook pro.
So it's still a pretty powerful thing, but you can see there's multiple long tasks all over the place.
And this is a fairly common pattern that I see with single page applications in particular, we're up front.
We have a really massive task as you evaluate your primary bundles.
In this case, that 2.5 second task, you know, that's react getting it, things set up hydrating, the dominant situation.
Um You know, I know there's work being done around progressive I'm Hey, hydration, progressive hydration and react.
So we can break this up uh but only hydrate parts of the Dom.
Um But sometimes I feel like, you know, we're inventing problems to fix them kind of a thing, but um certainly one of the first things you should be tracking on any JavaScript driven site is this long task behavior.
So you can do that using an, a performance server.
Um Here we can set it up to watch for long tasks and then beacon them off to analysts.
The primary way of looking at long that data right now is to look at total blocking time.
So total blocking time looks at all of the tasks on the main thread, specifically those long tasks, those things over 50 milliseconds or so, and it only gives you the total of the chunk over that 50 millisecond threshold.
So for example, instead of looking at this 200 millisecond task as 200 milliseconds, it reports it as a 150 milliseconds.
The 150 millisecond task becomes.
And so on and anything under that 50 millisecond threshold is ignored.
So in this case, we have 550 milliseconds on this example um for the main thread for total blocking time.
Now, one of the things that you'll see if you start digging around the web, our total blocking times are pretty slow.
We don't do a great job with this metric.
Unfortunately.
Now that unfortunately, this metric is primarily used in a synthetic setting in the real user data, what we're using, what Core Web Vitals, you know, the initiative from Google, what they've incentivized is the First Input Delay.
And I think that's a step back from total blocking time.
Um To be fair.
I did not anticipate that when it first came out, I don't think that anybody did.
Um But I do think now in retrospect, having seen this metric out for a bit, it's actually a yeah.
Back in terms of accuracy in terms of impacting how things are impacting the actual user.
So if you look at the I'm here, First Input Delay is measuring between the point where that browser receives the first user input.
And when the browser is free to start responding to that user input, the key there is start responding to the user input.
Um We'll come back to that in just a second.
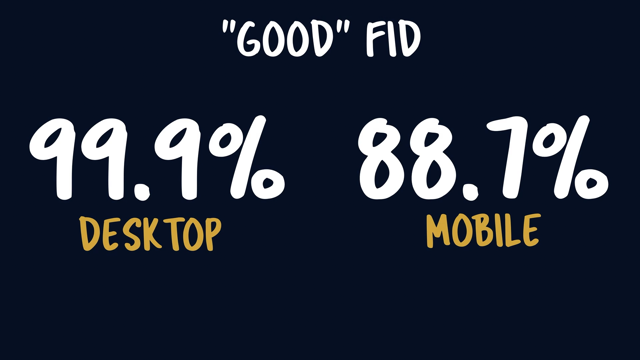
If you look at truck's data Google's Chrome user experience data right now, 99.9% of desktop URLs.
Get a good First Input Delay score.
88.7% of mobile pages.
Get a good First Input Delay score.
Those numbers look great.
In fact, compared to Largest Contentful Paint in Cumulative Layout Shift, the other card, Web Vitals, we are ACEing the fit comp thing we are doing great at this particular metric, unfortunately fits a bit of a fit.
Here's an example of a case board interaction from another post on web.dev.
Um You can see here.
What we've got is we've got a long running tasks.
That's the purple and you can see where the user presses a key for this key down delay.
Let's focus on that.
The keyboard interaction up front here, they press the key.
Now there's a key down event.
That key down delay is that's short short, little sliver there between when they press the key during that one task that was running to when the browser was able to start handling it.
But notice that you have these key down handlers and key press handlers, that fire as well as part of that event, none of that is captured right now by First Input Delay.
So we have the actual duration of the event is substantially longer than the actual delay that we're making.
To put this in a real example.
Uh This is from an application that uh my wife was using one night and she was like, this is really slow.
And so I'm a nerd.
So of course I fired up the performance panel.
Um This is a click event.
It takes 1.1 minutes.
That's right.
1.1 minutes on a Mac book air.
So not a uh underpowered machine.
The First Input Delay came in around 30 milliseconds.
This whole 1.1 million, as far as this metric was concerned, or 1.1 million felt like 1.1 million there's 1.1 minutes.
As far as the metrics were concerned, just didn't show.
So there has been work inside the performance working group, and Chrome has been involved in this to come up with a better way.
Instead of looking at this delay, look at that entire duration.
This is called the event.
Timing API.
The idea being here is if we could look at when the event is first triggered or requests to when that event actually completes, we get a much better picture of what actually happened and how much that actually.
Slowed the experience down from a user perspective.
So if we switched to event timing API from First Input Delay, we go from about 30 milliseconds to about 66,000 milliseconds for this particular interaction.
I cannot wait until we get event timing, API rolled out there.
And And I I assume at some point I would highly anticipate it's going to replace First Input Delay as a Web Vitals.
When we get that, it's going to be a much more accurate view of how our sites perform in the.
And generally speaking, that's just, it's a trend, right?
Better metrics, equal, better understanding.
Anytime we get some better level of tooling, some better level of metrics.
Um We give a richer and richer understanding of what's actually happening.
Um And at least the new optic optimizations and new insights.
One of the areas that I think is on the cusp of benefiting from these improved metrics and tooling, and that I think is going to be really important in a little bit is maybe.
We don't talk about this as much when it comes to a performance perspective, mostly because the tooling around memory from a front end perspective is not that great.
It's not super robust, it's pretty new.
And we don't have a lot of metrics around this.
There is one that I'm pretty excited about um shipped in Chrome 89.
If your site meets certain security requirements uh it's called the measure user agent specific memory API.
Uh And what this does is it's going to report memory use uh that is related to JavaScript and related to Dom elements um for your site.
So you can have this running uh and whenever you get the results back, you can beacon those back.
Um And this way you can actually start to get real user data about memory usage of your site and how much memory is are you consuming?
Um Now this security contexts are a little bit difficult.
There's a few hurdles you have to run through.
So right now it's tough to get good run data at scale, but synthetic we can fake it.
Um So what I did is I took the top 10,000 URLs and I fired them up in webpage test.
I used the custom metric or a customer Paychex metric to return the memory breakdown.
So I could see how many bytes of memory each page was using.
And I passed a couple of Chrome flags to turn off the security features that block.
This API from running, if they're not present.
So this lets me get this metric for all of them.
Top 10,000 URLs and the data came back and it was a little scary.
I don't know what I was expecting to see, but it was certainly more usage than I would have anticipated or guests.
Uh It turns out that uh somewhere around that P 25, that 25th percentile we're using about 4.8 megabytes of memory on both desktop and mobile.
By the time we get into that 75th percentile, we're at nearly 20 megabytes at the 95th percentile firmly in that long tail.
Now we're getting close to that 40 megabyte range.
Um These are big numbers um but they can start to give us some sort of a game page, some sort of a benchmark to look at.
And that was the goal of this.
It's not necessarily like we're missing some pieces here.
We don't know.
At what point does this impact user experience or anything like that?
We need rum data for that, but at least based on this, we can extrapolate like, all right, what's good.
Look like.
So if we do the same sort of approach to the Core Web Vitals took, we put that 25 percentile as good that 75th percentile or so as needs improvement.
Um Then we figure out like anything under 4.8 megabytes is good.
Anything between 4.8 and 19.4 needs improvement.
Anything above that is in that poor category.
Now the other thing with memory usage to keep in mind is that this is a measurement of initial page load.
This is what the page is using in memory when it's first, where memory gets more, more interesting.
And the pieces that are going to be harder for us to sort of put a benchmark around our interactions, because once you start interacting with the page, that's where we start to see memory leaks and that memory data spiking and the memory usage spiking.
Unfortunately, I ran a few, a bunch of different, you know, maybe a dozen different tests where I was looking at some of the URLs that I had already captured.
And it turns out that basically, if you have a site with any of these spa architectures, roll a dice land on one, and you're probably gonna find a memory leak, they were all over the place.
Uh So here's the Vogue homepage, right?
So this is a react application.
Uh There's a lot of lazy loading happening.
Loading and images, loading in different stories and different components as it's going up and down this page here, when I tested the Vogue page, the homepage, the initial load, it was about 36.6 megabytes of memory usage.
After scrolling to the bottom we were using about 84 mags.
Chrome has a uh memory.
A tool visualization inside that performance panel that lets you see heap size.
Um Keep in mind the reporting is going to be a little different.
Each page is going to be a difference or the numbers are going to be perfectly aligned here.
But this is what I saw over the Volks girl.
Right?
You can see that JavaScript team.
That's our blue line and the number of listeners.
That's our yellow line are going to dramatically, especially if the listeners going dramatically up into the right, which is not what we want.
That's great for stocks and things like that, I guess, but not what we want to see when we talk about memory usage.
Um Another example, Lego Lego is a again, a react driven site.
Um And for this one again, I saw significant memory increase.
As I went from uh moved around in the spa from the homepage to a search to a product page.
Uh For this, you can also look at that Chrome uh memory PA actual memory panel has the ability to grab a heap snapshot.
And so if we take a heap snapshot of before and then after we've navigated through those pages, we can compare the two and see what's going on.
So before you can see in this case, it was about 1 31 megabytes, roughly ish uh And about one to two megabytes higher, by the time we'd gotten to that next navigation, the biggest increases here were memory related to code and strings and JavaScript arrays.
Looking into each of those heaps snapshots, we get a detailed breakdown here of what exactly is comprising that heaps snapshot.
Um In this case we have, I've got it in a comparison mode, so I can see the difference between the second snapshot and the first.
And I've got an order by size Delta.
So again, array and string related uh memory usage jumps, right to the top.
Another really good starting point for you with these seeps snapshots, just to see you.
Typical low-hanging memory leak stuff um is to check for detached elements.
So if I search for detached in here now I'm seeing like, these are all detached elements.
These are dominoes that were removed from the page.
They're not present in the document object model anymore.
But JavaScript still references them.
So the browser is garbage collector.
Can't remove them.
And so they stay in memory.
So for each of these, I could dig in and, you know, look, figure out, okay, why do we have so many different elements and attributes that are lurking about still.
Um There's something happening in the code here.
That's not freeing those things up.
So this is another, you know, between the the analytics tool, the analytics itself, the webpage test analysis, the memory panel and performance uh inside the dev tools and the heap snapshots.
There's a few different visualizations we can start to use to try and dig in.
None of this should be surprising though, right?
Like I haven't told you anything super exciting.
Um More processing time, more memory usage.
Yeah.
If you got more JavaScript, it means more work that complexity though, is I think what's at the heart of so many of these issues from a performance perspective, as well as the accessibility side of things.
Again, remember webbing found more issues every time a framework or library was detected them without um the web platform itself does a ton under the hood.
Jen Simmons in an episode of shop talk show with uh Chris Coyier and Dave Rupert was talking about building for, you know, standards and building for the actual uh specification and prouder side of things, not, you know, the front end engineering that you and I do.
And she talked about how there was a couple key differences, like with me building for a site, I can always delete my code later.
You can always say all this thing I shipped quickly for my project was a bad idea.
Get rid of it.
But the web there's two things that are different first.
Once they ship it, they don't get to change it and ship it again.
Like that never happens.
If something is crappy at the beginning, they're stuck with it.
So they have to make sure it's right.
The other thing is they're not solving for one individual website.
You know, somebody from Facebook or YouTube or code pen you're solving for the entire web in every use case at all the same time.
In other words, there's a ton of thought in planning that goes into everything that makes itself into the web.
When we start to throw things and try to overrule that or bypass it with JavaScript or custom work like that, we start to lose a lot of those ingrained benefits.
One of the things I see a lot in the sites, and I know it comes up fairly often is dibs or spans instead of actual buttons.
You know, I've seen these inside of forums where there's no submit button.
It's actually a diverse span that kicks it in JavaScript is taking over the entire thing.
There is a dramatic difference between how the browser treats these two elements natively.
If we look at the Chrome accessibility, respect inspector for the div and under these computers.
There's nothing here.
This is a generic role.
Um With some static texts, there's nothing about it at all.
That indicates to any accessible tech, what the heck.
This thing is supposed to do the button on the other hand, even without any labels, even without other markup to go around with it.
We know that it's a button.
We have a tab it's focusing.
We can put our focus on it.
Um We have the contents related to it.
There's a lot more information right away.
There's also some built-in functionality.
Um We have the ability to do things like tab onto it and press spaced as an alternative way of interacting with the button.
Um If we're going to do that with our div, we have to hook up a whole bunch of JavaScript.
I mean, even just to get it, to start to do some of the things that the button does requires that we manually go in and tell it it's focused bubble with tab index, and we can use an AI aria role to tell it it's a button.
Uh In fact that is often the fallback here is we use something like REO attributes and things like that to try and indicate when we're doing these custom, you know, elements like this is what it actually is from a browser perspective.
But interestingly uh AME also found that aria correlated to higher detectable errors with a more aria attributes that were present, the more accessibility errors there were.
When we try to take over what the platform is providing us and do our own customization on top of that, we often fall short because we're not, that's not the way we operate.
We don't have the time, or we don't have the the the experience or the different perspectives to be able to consider every possible use case.
So we're going to miss things that's not surprising when things fall between the cracks.
Now, how do we improve this?
Well, the first thing is don't just look at lighthouse.
Uh When I did the JavaScript research, there was a really really low correlation between JavaScript usage and lighthouse accessibility.
Now score.
Now this is in sharp contrast to the web aim results.
Right.
Like web aims, shorter bike, very common connection.
Very clearly picture clear picture their white house uh not so much.
And the reason is it's the lighthouse audit is great.
It's a good low-hanging fruit starting place.
It is not super robust.
It is nowhere near as polished as the performance side of things.
For example.
So step one, I think is the tools.
Um I am a huge fan of wave.
Uh I'm sorry.
Wave the, a web accessibility evaluation.
Um You pass it at an address.
It's going to give you detailed information about the errors and alerts.
It checks a ton of different things.
Um And you know, it's nice.
It's also kind of fun as you're cleaning it up to keep hitting refresh and watch those things go away.
Um But this is a much robe, RO more robust way of testing accessibility.
Um Even better bring some of that stuff into your editor.
If you're using something like react or view or anything with JSS.
You don't pull in these IES lint plugins that actually will check for specific accessibility issues while you're writing the code.
Hopefully stopping you from putting those inaccessible experiences out to begin with.
It's all about introducing that healthy friction.
Um That's, you know, making some stops some pause when we're writing our code, when rolling out a new framework that makes us consider what the potential impact or consequences are of those things.
Because again, everything has a cost, nothing is free and that's especially true of Java.
I think one of the things that has had a profound impact on my career was a talk from 2008 by Nate Keckley, who was at Yahoo, I believe at the time.
And it was all about front end engineering and what are our roles and what are our responsibilities.
And one of my favorite lines from that is he talks about how we want to have stubborn empathy for our users, for what they need for what they want and for what they're going through.
And we have to be constantly focusing on what can we do to make all of that.
So I think if there's one thing that kind of, you know, one guideline here for all of this, it's be stubborn be stubborn on behalf of the users constantly seek ways that we can make their experience better and fight hard for them.
And anything that we're going to add, who has to go through that sort of gauntlet, right?
Like we want the friction, we want to have better defaults.
We want to be carefully considering what we add to our patients.
To make sure that it's providing those among the experience that they want from a rich and immersive perspective, but at the same time that we're not giving up on those core pillars of the web, that we make sure it's performance and it's secure.
JavaScript has come a long way from its humble origins as the last of the three web cornerstones (alongside CSS and HTML). We use more JavaScript than ever, spending 14 times as many bytes on it as we do for HTML and 6 times as many bytes as we do for CSS.
Nothing is free, though, and that’s particularly true of JavaScript. In this session, we’ll look at the current state of JavaScript—how much we use, how we use it, and what the impact is.