An Opinionated Guide to Performance Budgets
I'm really excited to be here at lazy load or "here" at lazy load.
I'm going to be talking for the next little bit about performance budgets, and if you have no idea what a performance budget is, don't worry.
I'm going to cover what they are, why you need to care about them and how to actually get started with them.
So it's going to be a really kind of pragmatic session with hopefully a lot of helpful kind of how tos for you to move forward after this.
If you do have any questions at all, you can reach me on Twitter at @tameverts, questions, or you're just kind of your own success stories.
If you're already using performance budgets and you have additional insights to share, let me know there as well.
I would definitely love to hear it.
So I been doing performance things for a long time, and I'm not a developer, I'm a usability and user experience person.
And it doesn't matter who you are.
If you work in the web and you care about making your site faster, these are kind of the two questions that everybody asks.
How fast should my pages be?
To make my users happy, to help my business.
And how do I make sure that they stay fast?
And so when we talk about performance budgets those are kind of the questions that they're meant to ask.
And I realize as I kind of glibly saying these two questions that they sound really simple and they are really simple questions to ask.
The answers are a lot more nuanced and complex.
If they weren't, we wouldn't have this conference or this talk.
So here we are.
So performance budgets for the win.
As a concept performance budgets have been around for a few years now.
And they're continually evolving.
So I've actually done different versions of this talk in the past.
If you happen to have attended one of those talks or read about one of them some of the material that we talk about here today is going to be maybe a little bit familiar, but they're constantly evolving.
And so there's always more to learn and I'm always learning.
So this talk is actually kind of a very fresh in a lot of ways.
But today, what I want to talk about is just answering these questions.
What is a performance budget?
Why do you need them?
Which metrics should you focus on in terms of, you know, we want to be able to, you, you have to set a threshold or a budget on a metrics.
So what metrics should we focus on?
What should the thresholds actually be?
And then how do you manage them?
How do you stay on top of things and not feel kind of overwhelmed?
And so there's a lot of material, so let's kind of just jump right in.
So let's start.
What is a performance budget?
Probably once you hear the definition, you're going to realize, okay, that's pretty intuitive sounding.
What it is, is a budget or a threshold.
Think about it another way that you create for the metrics that are most meaningful for your particular site.
And so metrics can take a few different forms.
They can be milestone-based.
We capture a lot of different time-based metrics and performance tools.
And if you're not familiar with any of these, we'll be going into these more in just a few minutes.
But some of the time-based metrics can be StartRender or Largest Contentful Paint or page load time might be one that you're familiar with.
There's also quantity based metrics like page size or image weight, or the number of scripts on a page.
So you can, you can track those as well.
And then there's also score based metrics and you might be familiar with some of these, if you had been kind of following along with Google's initiatives around page performance.
And so these are metrics like Cumulative Layout Shift, which is one of Google's Core Web Vitals or lighthouse scores, which is a Google initiative that came out a few years ago.
And these are score based metrics.
The important thing to take away is that there's a lot of metrics and you can create performance budgets or thresholds for any of them.
A good performance budget should show you what your budget is.
When exactly you go out of bounds on your budget, how long you stay out of bounds on your budget.
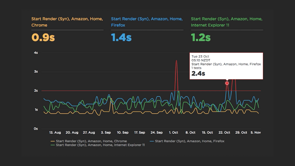
And when you get back within budget, So, this is an example of a chart that shows a performance budget.
You can see that it's tracking the Amazon homepage.
If you look really closely here and Firefox, Chrome and IE 11.
And you can see the red line set at kind of the two second mark is the performance budget, and you can see this little blips above the red line showing that the budget went out of bounds on October 1st.
And then a little bit later in October on the 23rd, and then again on the 29th.
And you can see when it fell back within this budget thresholds.
This is basically fulfilling those criteria that, of a performance budget.
You want to have real visibility into what your budget is and when you kind of go in and out of it.
Why do you need performance budgets?
Well, a lot of reasons.
But I'll start with a case study that really captivated me when I first got started in thinking about web performance and working in this industry 13 years ago.
So there was a company called ShopZilla that's since been acquired and goes by another the name now.
But the important thing is that they presented at a conference at a performance conference that in 2009, that they had improved their average page load time from six seconds to 1.2 seconds because they felt that six seconds was too slow.
And it was really important to do a lot of optimizations to make their site faster.
And as a result of this, they experience a increasing conversion rate of up to 12% and a 25% increase in page views.
So that was a really big deal.
It was a really compelling case study to show kind of the business value of Web Performance back in the early days when we were all still really eager and hungry for good case studies.
Well, two years later, flash forward to 2011 and they shared another case study.
And that case study kind of captured things that had happened over the course of 2010 and 2011.
So in 2009, they made all these improvements.
Yay, good stuff.
And then in 2010, they kind of took their eye off the ball.
They got busy and their average load time degraded again to five seconds.
And they started to get email feedback from users to the other site saying things like "this site so slow".
"I really hate it", "what have you done?", "I will not come back to this site again".
And so they did a performance sprint in 2011, where they refocus on performance and just at the time that they re presented a new set of data.
In this case study, they, they found that they were already starting to see an increase in conversion rate and they anticipated that it was going to continue to increase.
So really interesting kind of cycle or kind of a story of optimization, regression and then optimization again.
And why did this happen?
I mean, it's really easy to kind of look at things in a hindsight and say like, why I, you know, how, what kind of, who would let this kind of thing happen to their site?
But in our day-to-day realities, you know, I think that these reasons which they cited are all pretty relatable.
So one, they were busy with ongoing feature development, really, really busy, just trying to release new features.
And that probably resonates with a lot of you I imagine out there.
They had some badly implemented third party on their pages that were hurting performance.
Kind of going hand-in-hand with that.
They were waiting too long to tackle problems.
They were really relying on later performance sprints and kind of deferring fixing problems until those sprints.
And then kind of most telling they stopped doing front end performance measurement.
So they just stopped keeping track of what their performance metrics even were.
And as a result of that, there was just no way for them to track regressions.
So performance budgets are designed to help you fight regression by setting thresholds so that you don't fall beneath those thresholds and you can stay ahead of the game.
It basically, so that you don't make expend a lot of energy to make your site faster and then lose all the positive results of that because you happen to take your eyes away from it because you get busy with other things.
So we talk about measuring performance.
There's a, there's two main sets of tools that we have for measuring Web Performance.
And they go to go by different names.
So there's real user monitoring, or you might also know it as field monitoring or field data, and there's synthetic monitoring or "lab data".
And they're not intended to be like real user monitoring or RUM as we call it versus synthetic, they're kind of really complimentary tools because they do different things for you and let you understand different things about your users and about your site.
So if you think about RUM as basically a way to understand what your users are doing, and synthetic is a way to understand how your site is actually built and issues that are, you might be causing by changes you make to your site, then that's a really good way of thinking about how these tools are complimentary.
So for example, with RUM, you are it's, it's measuring user behavior and your site under a real network of browser conditions.
Synthetic it's more like you're mimicking some very specific and defined network and browser conditions that are kind of the common ones that your users might visit your site from.
Real user monitoring requires JavaScript installation.
You need to install a JavaScript snippet on your site that does the tracking.
Synthetic there's no installation required because you usually using web based tools and you're just entering URLs into those tools.
And as I said before, predefining your network of browser conditions and geolocations and things like.
With RUM, you can look at a hundred percent of your user data or you can sample it down.
So you're actually seeing everything that's happening out there in the field.
With synthetic, you can't really do that.
You're kind of limited to specific URLs and specific, as I said, network and browser conditions.
And similarly with real user monitoring, you've got complete geographic spread, synthetic you're limited to wherever your test locations are.
However with RUM, you can only measure your own site because you have to install this Java script snippet on your own pages, with synthetic, because you're just entering specific URLs into a tool, you can compare any site.
Your own, multiple properties that you own, your own site against your competitors.
So there's a lot of different comparisons that you can do.
And with RUM, you can also correlate what you learn about and the performance metrics that you gather against other metrics like bounce rate, which is really interesting.
And we'll be talking more about that a minute too.
With synthetic you can't do that, but you do have the beneFID of really detailed page level analysis and visuals that show you how your page is built and what the problematic issues might be in terms of visuals, images, video, JavaScript, and just kind of how, what are the issues that could be causing your pages to be less performant.
So that's where you get that, that that analysis.
And there are, they're are a lot of different RUM and synthetic tools out there.
On this page, I've just sort of gathered the ones that allow you to do performance budgeting.
So you have free tools like Google lighthouse and sitespeedIO, and then you have some paid tools.
SpeedCurve where I work is one of them, but there are others as well.
And so I really encourage you if you are already using any of these tools and you're interested in performance budgets to dig a bit deeper and explore how to implement performance budget with these tools.
If you're not using any of these tools, then, you know, get out there and explore and kind of check out what the different offerings are and what value you can get out of them.
Most, if not, all of them offer they're either free or they offer free trials.
So it's definitely something that you can kind of start digging into.
So you have some buy-in into the idea of performance budgets.
You've got a tool or a couple of tools in place that you're trying.
The next question is which metrics should you focus on?
There are.
There's I get this question a lot.
Like people would really ideally love to know that there's only one metric.
They need to track for performance and that's all that matters because it would make life so much simpler.
The fact is that there are a lot of metrics.
This is just a sampling of them.
They go by a lot of different acronyms and it can be really, really overwhelming.
And I say this as somebody who has been working in this space for a long time, and I've seen the different metrics come into my environment and have to learn a, you know, memorize all these different acronyms and then what they actually mean.
Some of them are quite nuanced.
So.
Ideally you want something that's in between the single unicorn, a unicorn metric and, this massive cornucopia of metrics and ideally have, just a small core set that you can that you can focus on for your own site.
Because if you start looking at too many metrics and start tracking everything, you can get overwhelmed really easily.
It's hard to know what to believe in.
So I recommend really starting small and validating just two, three.
Maybe kind of start there, two or three different metrics to begin with, validate them and make sure they're meaningful for you.
And then if you want to kind of build things out.
So what do all of these metrics mean?
Well, before we get into that, for my purposes, when because as I said, a performance person and a user experience person, these are the three criteria I care about when I'm trying to find metrics that are meaningful for me.
Is the page loading.
Can I use it?
And how does it feel?
From a user's perspective, that's all you really care about.
Anything else, there are a lot of other metrics that might be interesting to engineers or people behind the scenes because they kind of speak to what they're doing, but from a user's perspective, these are the metrics.
These, this is the litmus test that we want to apply to the metrics that we're looking at.
So is the page loading?
People just want to know that a page, the page is actually responding that the server isn't hanging, even if they're not thinking about it in these terms, just that they're kind of at the right place.
And that something is happening.
Backend time is probably your, your kind of first source of truth for knowing that a site is responding.
You might also know it as Time to First Byte.
The nice thing about Backend time is you can measure it in both synthetic and RUM tools, which is really handy.
And this is a waterfall chart or very simplified waterfall chart and a filmstrip view so it's I mentioned earlier that it can be really helpful to just validate and kind of sanity check the metrics that you're looking at.
These kinds of visualizations can be really, really helpful for doing this, because these are SpeedCurve graphics because I work at SpeedCurve and this is the tool that I use, but comparable tools should have their own version of these graphics that you can use as well.
So you can see here in this very simplified waterfall chart.
If I scroll over Backend time it's 0.08 seconds, and you can see there's not really anything in the film strips, but that's okay.
We just want to know that something's, the server's responding.
Start render from a user's perspective is is a bit more of a helpful visual oriented metric that lets users know that, yeah, definitely content is loading.
It's the time, Start Render measures the time from the start of navigation until the first non-white or kind of visible content is painted in the screen.
And like Backend time, it's measurable and synthetic and RUM, which is really helpful.
And to validate it, you can see, if scroll over, start render it's at 0.3 seconds.
And something is starting to appear in the browser.
It's that top banner and you see that something's happening.
And if you're a user, you're like, okay, great.
I wanted to come to this page.
Something's loading.
Wonderful.
Ideally everything else loads really quickly after that, but at the very least this is a good start.
One of the other things that I really like about start render is that when we look at real user data and we correlate start render against user engagement metrics, in this case bounce rate, we see that there's actually a pretty strong correlation between start render and whether or not bounce rate gets better or worse.
So, this is what we call a correlation chart, and you can see that the blue bars represented in this histogram show, the distribution of start render times across the pages.
And you can see that as pages get slower, as we move off towardth right with those bars, bounce rate increases.
So at almost two seconds or specifically 1.8 seconds here, our bounce rate has gone up to 49%.
So it's really, it's a good metric to track.
If you want to correlate it against other user engagement metrics.
I really like start render.
It's been around for a long time.
It's probably not going anywhere.
So I think it's kind of a good one to have as a bit of a baseline to track with.
So the next set of metrics that we care about are the ones that tell you, when can I use the page?
Can I begin to interact with it?
Can I click around And so this is this chart represents the results of a really interesting study that I helped do a few years ago, a user study where in the lab we gave people sites to use.
And what we were really testing with them were different rendering times with how images rendered on the page.
And so I won't go into that too much, but one of the takeaways was that we did exit interviews with the hundreds of people who participated in this study.
And we asked them, when do you start to interact with a page?
And we want, what we wanted to know was, how much, how long people wait before a page to load and what they expect to see on a page before they feel that a page is ready to interact with.
And interestingly, we found that 47% said that, Yeah, as soon as some text appears on the page, I figure I can start using it.
But just over half of people said that they waited for most or all images to load on a page before they would start to interact with it.
And so that makes, made us realize that, the bar is set pretty high for rendering key visual content on the page.
If we want people to feel that the pages are interactive as early as possible, and as a result, reduce bounce rate.
So, this is where Largest Contentful Paint comes in really handy as a metric.
And so this is this metrics been around for a couple of years.
If you have been paying attention to Google's Core Web Vitals, then you know that it's one of Google's Core Web Vitals.
And what it measures is the amount of time it takes for the largest visual element on the page to render.
So that could be image.
That could be video.
What I like about LCP is that like the other metrics we've already talked about, you can measure it in synthetic and RUM, so you can set a performance budget on it in RUM for example, and get alerted if you go out of bounds and then you can kind of trouble shoot in your synthetic data in parallel to it, and kind of figure out where things get went wrong because you have all that great analytics data that's behind it.
So LCP is a really helpful metric.
I highly recommend you check it out.
This is kind of what it looks like in a, when we look in a synthetic tool.
We scroll over LCP, we see that, yeah, you know, when we're sanity checking this, that it does correlate to the first time that large image appears, that hero image in the article appears in the browser window.
So wonderful.
That means that it works.
It's a good metric to track.
If you care about Google's opinion, you probably do, you probably want to know what they consider the thresholds for good and bad LCP times.
So for their purposes and bearing in mind that Core Web Vitals of which LCP is one is part of the search ranking algorithm that Google uses.
They consider anything under 2.5 seconds to be good and anything above four seconds to be poor.
So those are the thresholds that you should be thinking about.
If you want Google to be happy, bearing in mind, you know, Google sets these thresholds based on their own data.
And their stated mandate is to make the web fast for all users.
So, you know, we're kind of putting a lot of faith in, in that mandate.
Some things to know, though, if you're tracking LCP, is that it can be tricky on mobile for a few reasons.
And here's a screenshot that kind of shows a, an extreme reason.
It, among other things, because the mobile screen doesn't always have visual content.
Say, for example, if it's a text heavy page LCP just won't fire for a long time, or it won't fire until something like a pop-up shows up.
And this is actually what is triggering LCP time.
So we see here with this screenshot, that Largest Contentful Paint time is almost 65 seconds on mobile for this particular page, which is really, reallypoor.
So a couple of things that you're going to want to do just to kind of, you know, put on my, my, my fixer hat for a second is a) make sure that you understand why your LCP scores is really poor here.
And maybe figure out like, okay, well, is this even a metric that is valid for this particular page?
If it's not going to serve visual content, maybe it's not a metric to track, or if it is a metric you want to track, figure out what's breaking it.
So figure out if you have an issue like this with a pop-up that is making this score really high.
The next set of metrics are the ones around how the page makes you feel.
So it's great if the page loads and, you know, you start to feel that you can interact with it, but ultimately as people who build websites, we want people to feel good and not frustrated when they're using the page.
And one of the biggest sources of frustration is page jank.
For anybody who's not familiar with that term, 'jank' just refers to kind of the jitteriness of a page as elements, slide in and out as your custom fonts come in and you get that kind of flash when your fonts change all those little bits and pieces, especially on mobile, that can be really, really irritating because you know, you go to hit a button or a link and something else slides right underneath your finger, the second that you do that.
And next thing you know, you're navigating to another page and, you know, we've all been there probably.
And it's really, really frustrating.
So a really interesting metric that Google has developed, that's part of their Core Web Vitals is metric called CLS or Cumulative Layout Shift.
And it's a score based metric that reflects how much the different page elements shift during rendering.
It's also measurable and synthetic and RUM.
And score based metrics can be really tricky to kind of wrap your head around.
So it's really helpful if you can kind of visualize what a layout shift is and where those layout shifts happen.
So these red boxes show what the shifting elements are on the page and how they're contributing to the layout shift score.
So you can see all these, all these boxes moving around.
Every time a box kinda moves in and and, and, and takes a little bit of time and it moves around that effects your CLS score.
Google wants you to have a score of below a 0.1 and not worse than 0.25.
And so talk a little bit more about what can cause CLS issues.
So the size of the shifting element definitely matters.
As you can see here on this page the page looks kind of the same, but because these shifting elements are so huge and they're moving this just the sheer, the volume of that shifting element is what's jacking up the CLS score.
Another issue is web fonts and opacity changes.
So here again, you see the page change, the web fonts change, and all of those contributed to the layout shift score, being a very poor as well.
Popups are another issue.
They come out of nowhere and in of itself, a pop-up might not be an issue, but if CLS scores are kind of a death by a thousand cuts situation.
So you just really want to prevent any unnecessary shifts that you can.
So that can mean, you know Making sure that your, your, your web fonts aren't egregiously larger or smaller than whatever the defaults are.
Things like that.
Carousels are another big issue with CLS.
Here you can see a series of visuals.
This is basically for the same page and you can see how the page changes as you move down, as the carousel comes in, the carousel shifts a few times and you get this egregiously terrible CLS score 1.6213, which is really, really terrible.
So.
If carousels are just a necessary evil on your site, you can't do anything about them, but you're mitigating jankiness in as many other ways that you can.
You know, it's something you're gonna need to have your eyes wide open about when you're going into measuring CLS.
And mobile pages, as I said before, are especially vulnerable to junkiness.
So here again, you can see lots of shifting elements moving around, and again, probably contributing to a pretty high level of user frustration.
A helpful thing to track as a more of a time-based metric is largest layout shift.
So when does that Largest shift time happen on your page?
And at least if you can kind of track that as a time-based metric, that's something you can kind of keep in mind as well.
First Input Delay is a really interesting metric as well.
It's measurable only in RUM and that's because it measures real user behavior.
And so it's, it's the amount of time that it takes for the page to respond to a user clicking or tapping or using a key command on the page.
So it's really a responsiveness metric to make sure I, at the end of the day, what your JavaScript is doing on the page, because that's often the, the issue that most effects persons with delays.
Google's thresholds for FID are under a hundred milliseconds for good and anything above 300 milliseconds is really, really poor.
Because FID is only measurable in RUM, it can be tricky sometimes to drill down and figure out, well, why is my FID score really poor?
How do we even begin to troubleshoot this?
And so as a companion metric to FID I really recommend checking out total blocking time as a metric.
And it's a little tricky initially to wrap your head around it, but then actually the more you work with it, the more you actually realize it's, it's pretty easy to understand, and it's actually a very, very informative metric.
And so total blocking time is a total time for all long tasks on the page.
Between First Contentful Paint and Time to Interactive.
And so First Contentful Paint is kind of when that first bit of content starts to appear on the page.
And Time to Interactive is when your JavaScript is kind of settled down on the page and the page is pretty much fully interactive.
And so in that window of time, a long task is any JavaScript task that takes more than 50 milliseconds to execute.
And so that execution time can make the page feel kind of janky.
It means that your, your page can't really do anything.
It's kind of hogging the CPU while it's parsing all this JavaScript.
And the more long tasks you have on a page and the longer those long tasks are because a JavaScript long task can be far in excess of 50 milliseconds.
The less responsive the page can feel.
And the more problems you usually can have interacting with it.
So, the nice thing about total blocking time is that you can look at all of your total blocking time, but then ideally you want to break it down to, well, what are my long tasks and what are the individual scripts or groups of scripts, groups of requests that are contributing to these long task times.
So in synthetic, you can actually dig down into your analytics.
And if you're tracking total blocking time and see the individual scripts.
And so here you can see, for example, that this, the top script content square, it has a long pass time of almost 1.4 seconds, which is very, very long.
So in doing this, you can quickly kind of triangulate towards what the actual issues are on the page.
So it's how you can start with a performance budget for a total blocking time and, and quickly begin to investigate and find the answers.
The other helpful thing about long task time and total blocking time is that like start render they correlate to user behavior.
And in this case, I'm showing you a correlation chart where we can see the correlation between long pass time and conversion.
And so the more long task, the lower the conversion rate.
So it's it's a really good metric to measure if you want to do these kinds of correlations, but just knowing this it's really helpful to metric to measure, because you know that obviously looking at this, the more long tasks that are, the more it's affecting, how your users are able to interact with your page.
The total blocking time thresholds that Google feels you should aim for again, under 200 milliseconds for good above 600 milliseconds is bad.
So those are kind of a core set of metrics that you can start to investigate if you're already tracking some of those or when you get to the next stage and you want to look at more metrics, there's some more metrics you can consider.
So lighthouse scores.
These have been around for a while, but if you're not familiar with lighthouse, what it does is it runs on top of synthetic testing that you do, and it gives you scores based on audits around very specific categories, for example, performance, accessibility, and SEO.
So probably things that you care about.
And so for each of these categories lighthouse and similar tools run audits and give you a score out of 100, based on how well you pass those audits and they give you recommendations for what to fix.
So, this is an example of looking at lighthouse scores for a particular page.
And you can see below the performance lighthouse score of 96, which is great that there's still some recommendations, so audits.
And here, you can see that some of these audits have been badged to actually indicate the Core Web vital that they will effect.
So, for example, avoid excessive DOM size.
If you were to address that audit and do some optimizations around that, you would probably make improvements to total blocking time or lower down the page, reduce unused JavaScript, probably you would see improvements to Largest Contentful Paint, if you address those issues.
However I recommend that you check out this blog post not for instructions on how to do this, but to learn how you can actually still get really high lighthouse scores by kind of gaming Lighthouse, which I don't recommend you do.
So it's still really helpful to to look at your actual pages and practice and see, you know, how, how it fares with other metrics.
If the only thing you're tracking are lighthouse scores.
It's not really ideal.
I totally understand how some people in your organization might only want to care about lighthouse scores, but across your whole organization, you should be looking at more than lighthouse because there is this opportunity or, you know kind of gotcha.
Where you can intentionally or accidentally get perfect scores and not fix your actual problems.
The some other things to track our page size and a number of requests.
Some pages on the web are really, really big.
This is a page I'm not going to name the, the, the site.
And it had almost 700 requests on the page and it was almost five megabytes in size.
And you can set budgets and thresholds on page size or requests, if you don't want your pages to be bigger than this, especially on mobile, where maybe, you know, your users don't want to be, you know, using five megs of data for each page that they, that they view on your site, if they're out roaming.
I know I certainly don't want to.
You can also track third-parties.
You can track all your third parties or you can track individual third parties.
And so this is actually a really helpful thing to know within your testing tools that you can set a performance budget on the number of requests for third parties, third party size, third party long tasks and get alerts when they go out of bounds.
Because third parties are one of the things that are probably the most common reason why people see sudden spikes in their performance data and wonder, oh my God, suddenly our site got so much worse.
It's you, the other, the other most common problem is backend issues, but.
Nine times out of 10, when I see spikes in data, it's usually a third party issue.
And here you can see a spike where the number of requests shot up, went from typically being like nine requests to 204.
And as a result of that, it spiked the long task time which, no doubt hurt performance because a long task time suddenly shot up to almost 1.5 seconds.
So you can set performance budgets on this and quickly kind of get in there and look at your synthetic data and troubleshoot where your, your, which of your third parties became the problem at that particular point.
Okay.
So now let's talk about how to set your budget thresholds.
So we've talked about a bunch of metrics, but now the next logical question is, well, what should my numbers be?
We've talked about Google's thresholds.
These are great as kind of goals, guidelines, but the world is bigger than Google and what satisfies Google might not satisfy your users.
The other thing to know is that performance budgets do not equal performance goals.
They're not the same things at all.
And it's really easy to get the two conflated.
So a performance goal is really aspirational.
It's how fast you want to be eventually.
And you know, you could say, I want to be as fast as possible, but maybe other ways to think about it are I want to be faster than my competitors.
I want to be fast enough for Google.
Budgets are more pragmatic.
And they are to fight regression, as I've already mentioned several times.
And so your budgets are to help you keep your site from getting slower while you work towards your performance goals.
So this is your first priority is to create performance budgets, to fight regression.
So this is a practice that we in our industry coalesced around over the last couple of years.
So really pragmatic performance budgets where you want to look at your last two to four weeks worth of data and here we're looking at, I just grabbed some synthetic data for Amazon and looked at the last month's worth and found the worst 6.08 seconds for their Largest Contentful Paint time.
And you make that number, your performance budget.
So you go into your tool.
You can see this red line is where I've set a performance threshold at 6.08 seconds.
And that then becomes a budget.
So if this page, if I were the site owner, and this were the budget, I set, if I went out of bounds on this and my pages got worse than 6.08 seconds, I would get an alert and I would want to go in and quickly figure out, okay, what made me get worse than, than my worst possible previous point?
Ideally.
You're optimizing your pages constantly, working towards your goals, hopefully getting faster and every two to four weeks maybe not, I wouldn't wait more than four weeks just because it's kind of nice to get into a bit of a monthly cadence of doing this and then update your budgets.
And so you're going back and looking at your last four weeks of data.
Hopefully everything got better.
You can lower your budgets, make them even faster.
And that's kind of a way to work in a step wise, a logical motion towards your goal.
So speaking of goals, how do you set your long-term goals?
So you're kind of keeping track of these is what you're working towards with your budgets.
Well, a good way to look at things is to think how fast are my competitors?
Depending on the industry you're in, if you use synthetic tools, you can set up your own benchmarking.
These are just some public facing benchmarks that that we created at SpeedCurve.
You can go look at them, yourself, be speedcurve.com/benchmarks.
And you can kind of explore different industries and see how fast your competitors are.
Who's the fastest.
And then your goal is to be a bit faster than them.
Ideally, you want to be at the top of this list.
You can also go to sites like WPOstats.com, and you can read a lot of case studies and see what other sites have done to make themselves faster and actually pick up a lot of really helpful tips along the way, because our industry is really great about sharing their best practices and not only see what they did to get faster and how fast they became, but the impact it had on user engagement and businesses metrics.
You can also look at your own data.
If you're using real user monitoring to capture business and user engagement metrics you might care about, and they can be bounce rate, conversion rate, cart size.
Lots of other metrics out there, and you can correlate those against your performance metrics, create your own correlation chart and kind of set some goals for yourself.
So if you know that your lowest bounce rate is that a 40.6% is at 0.4 seconds.
Maybe your aspirational goal is to get as many pages as possible in your site to render in or to start render in a 0.4 seconds.
So that becomes your goal.
In addition to your business metrics, you can also be thinking about how you can improve SEO.
So if, for example, you know, that you have a CLS scores that are kind of like ranging all the way out to 0.3 seconds and you can also, coincidentally see that conversion rate drops for your site as your CLS score gets worse, you can improve conversions and improve SEO by moving more of your users onto that faster end of the spectrum below 0.05.
So who's responsible for managing all these budgets.
Doesn't have to just be you.
In fact I would make a strong case for the fact that the companies that I've seen, who are the most successful at getting fast and staying fast, really distribute responsibility for performance, including distributing responsibility for managing performance budgets.
And that includes setting those budgets.
Ideally everyone in your organization who touches a page should care about the performance of that page.
And if you're in a smaller company, maybe that is just you.
And that's great because then you can kind of control all the, all the moving parts.
But if you're in a bigger org, I really recommend that you get different parts of your team involved.
That could be your SEO team, your marketing team.
Your marketing team, obviously he was responsible for inserting ad analytics and other, a lot of other scripts on your page.
Your SEO team cares about measuring performance for froman SEO perspective.
Your business folks probably care about a variety of business metrics.
So if you are creating performance budgets with those audiences in mind, they should have buy-in into what those budgets are and what the metrics are that are being tracked.
So it's not about having a lot of metrics.
It's about just having the right metrics for the right people.
And it might just be one metric per audience.
So I really love this podcast episode with Dan Chilton when he was at Vox Media, where he said that when he had, was working on the performance team there, their main goal was they didn't want to set themselves up to be the performance cops.
They didn't want to go around slapping people on the wrist saying you built that article that broke the page size budget.
You have to take that down.
They really wanted to set up best practices, make recommendations, and then just be a resource that people turn to.
So I encourage you to kind of keep that in mind when you are setting about the task of creating performance budgets for your.
And when there are wins, for example, when the Telegraph made some huge Web Performance, performance gains and made a 50% improvement and their Time to Interactive, and they were tracking that they shared it on Twitter, it's really a, kind of a fun way to get some validation that what you're doing matters.
So, we're going to wrap things up.
I want you to remember these guidelines as you go forward on your performance journey, your performance budgets journey is to start small, look at your own pages and data for setting your performance budgets and be as pragmatic as you can with that.
And validate the budgets that you're setting and the metrics that you're setting them on.
Don't just trust numbers on a screen.
You really want to have that kind of validation process in place to make sure those numbers actually correlate to what users are actually seeing.
Make sure that you tailor the metrics that you're looking at to the audiences that are going to be receiving these metrics and getting performance budgets alerts.
As I just mentioned, and keep in mind that the, all these metrics are constantly evolving.
Some of them are here to stay possibly, or at least here to stay for awhile.
New metrics are always emerging and that's kind of, one of the exciting things about this industry is we get more nuanced in terms of what we want to explore.
And it's also one of those things that makes us have to keep our eyes open and make sure that we are constantly validating what we're doing and making sure that we're looking at the right metrics.
And the biggest one is just never stop measuring, always keep your eye on your measurements and your budgets.
There are a couple of docs that you might be interested in that provide a more background into a lot of the concepts that I discussed performance budgets 101, and getting started with Core Web Vitals.
I really recommend that you check them both out because there are, there are those, both those articles include a lot of outbound links to a lot more resources.
If this is a topic that's interesting to you.
Hope it is.
And I want to thank you again, and you can find me on Twitter at @tameverts and and thanks so much for your time.
I really appreciate it.

