Applied LLMs in Finance
Introduction to London Stock Exchange and Refinitiv Group
Mihail Dungarov begins by introducing the London Stock Exchange and its recent merger with Refinitiv Group, highlighting their focus on trust and reliability in the financial industry.
Role in Text Analytics
Dungarov discusses his role in text analytics within the analytics group, detailing the scope of their work in financial data, analytics, research, and news.
Data Overload in Financial Industry
He addresses the challenge of managing information overload in the financial sector, with vast amounts of data and news articles produced annually.
Large Language AI in Financial Analytics
Dungarov explores the use of large language AI models in financial analytics, focusing on their application in narrowing down and prioritizing essential information for customers.
Evolution of AI in Finance
He shares the journey from research to product integration in finance, showcasing how large language models have been incorporated into financial products and services.
Analysis of GPT-4 in Finance
Dungarov discusses the analysis of GPT-4's performance in financial-specific tasks, emphasizing its improved accuracy in identifying relevant financial topics and sentiments.
Topic Analysis in Financial Documents
He describes the process of analyzing financial documents to identify key topics and sentiments, showcasing how AI models can streamline this process.
Product Design for Financial Analysis
Dungarov explains the design of their product interface, focusing on how it reduces information overload and provides intuitive access to key financial insights.
AI-Driven Digestion of Financial Reports
He demonstrates how AI models help in digesting long financial reports into concise, actionable insights, highlighting the balance of positive and negative aspects in financial analyses.
Separating Management and Analyst Perspectives
Dungarov discusses the importance of differentiating management and analyst perspectives in financial documents to provide a balanced view of company performance.
Comparative Financial Analysis Across Documents
He talks about comparing themes across various financial documents to identify trends and patterns specific to companies or industries.
Cross-Industry Financial Analysis
Dungarov introduces the concept of cross-industry financial analysis, explaining the development of tools to analyze financial trends across different sectors.
Integrating GPT for Enhanced Financial Queries
He shares recent advancements in integrating GPT models to improve financial query expansion, focusing on fine-tuning these models for specific financial use cases.
Conclusion and Future Directions
Dungarov concludes his presentation by summarizing the integration of AI in financial analytics and the potential for future advancements in this field.
Hello and, yeah, thanks for having me.
Yeah, so the London Stock Exchange is a fairly old institution.
We're like hundreds of years old and, we've also recently merged with, Refinitiv Group, which used to be part of Reuters, which is just over that time we've been like both of these have been institutes where we've been looking at standing for, trust and reliability in the financial industry.
It's just a fancy word to say that we're really very regulated.
And, basically, we, so with, what I focus on is, text analytics within our analytics group.
Talking a little bit more about, the exchange, essentially what we stand for a lot about is a lot of financial data pricing, valuations, analytics, lots of boring stuff, research, news, and all these things.
And we cover a very broad area of like customers within the financial space from like trading, investment banking, wealth, risk, and, academia.
And, what I'm going to show you today is currently like on over 250,000 screens, that we support for our customers, and that's the output, and the input of it is, for example, Reuters as an organization produce about 2 million news articles every year.
That number has been growing about, I think about 30%, by about 30 percent year over year, so they really write a lot, and at the same time, I don't have a similar number on the pricing data, but I was trying to, like, to open an archive, and like the archive itself of a, one day of, pricing data is five gigs.
And I just imagine spreadsheets that compressed of five gigs.
And that's related in tab for, tab separate format.
But anyway, what's the next?
A lot of what, what my team is looking at is basically how can we help people deal better with that sort of information overload.
Obviously there's a lot of text coming in and how do we process that?
In this kind of large language AI space, some of the things that, that kind of, are like less important than I said, potentially all the like visual stuff, so prepare yourself for items which work perfectly well also on black and white TVs coming up, as opposed to the presentation that just came, that was just before me.
But also how do we narrow that text to customers to really help them focus on the important stuff and prioritize like out of these two, two million documents a day and like tens of thousands of research pieces a day.
Nobody actually wants to read that, right?
Like you want to read the few things that are relevant to you digested in the best way for you.
The things that I'm going to show you today also are, part and baked into our product because, I have to check with compliance of what I can show and like we have a lot of strategy as we're doing with Microsoft and a lot of our cloud providers.
Like I didn't have time to check with compliance about that.
So I'm just going to show you things which are publicly available.
And yeah, I want to take you on also on like a journey from, looking at some, at some of the stuff that we've done in research.
And and then has evolved and matured into the program where exactly it fits into the product.
And in that sense it is only a sliver of the things that we do with large language models.
But I am also proud to say that I've been part of all of the pieces that you're going to see today.
So if you have more questions about it, I can't stop talking about it, so we can talk about it after.
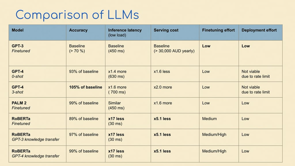
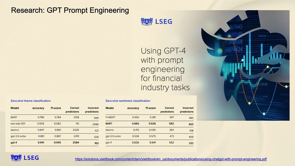
So like in, in, May, we published something, based on some analysis of GPT 4.
We actually did the analysis back in March, but by the time it went through compliance It was May, which is why my slides that I sent to compliance yesterday couldn't really pass in time.
We looked at, similar to Thierry before, we looked at, how better is it?
And we can show that, GPT 3, GPT 4 already improved much better on some of the tasks that we really focused on.
We're less focused on pieces where people type things in like for us and we need to understand them because we want to be very streamlined with the outputs that we show to our customers.
So we really care about kind of narrower things about like how well are we to identify specific topics that are relevant for finance.
So in the text, how much can we, if you think about these, let's say 60,000 news articles coming in a day and a few hundred basically, research reports coming in every day, how can you group that into the relevant topics and how can you assign sentiment to it so that you can look at it so you can structure information in that way?
And we basically saw that, yeah, with GPT 3 and 4, we can significantly improve that.
You're seeing on the slide, actually, GPT 4 doesn't, doesn't outperform everybody on a zero, on a, by default, but then, in the paper, we have also some cases where, once we give it a few examples, it actually outperforms everybody and we're fine.
This was actually building on other analysis that we're doing to actually look at what are the important topics in the financial space.
And it's a whole range of, specific topics that are very important to, all of these, groups of financial customers that we're talking about from investment banking to asset managers to academia, and particularly in finance.
And then how are those distributed between the different documents that we're looking at and what sort of information they give us.
And yeah, many different topics.
So basically when customers are trying to analyze these documents, what they're really looking for is really to be able to pick on these specific things, what was mentioned and what wasn't mentioned.
And some of these are very narrow.
So for example, you see somewhere at the top right there, like same store sales, that's very relevant in retail, but it wouldn't be relevant for other things.
And it would also be very relevant if you want to like financially evaluate a company.
And this is what it looks like in the product.
So this is just generally what, like I was talking about, like reducing the amount of information and I have contributed to the design of this page, there we are.
But, once you start using it more, it's actually very intuitive.
On the right you actually see the raw format of text, the way that people have, in a GM, I think management core, something like that, have been talking about what happened to GM over the past, like we get a lot of these, every, as each company needs to do these public kind of conferences or presentations about this, where they talk about what they're doing, they get questions from analysts, they answer questions and so on.
This is one of the formats I mentioned news, I mentioned research, where like actual people research it.
What we want to do is we want to actually start digesting it and, you see like the item in the middle is, where we've broken down into these topics that I mentioned before.
So like in green you see, how, how the positive ones, like which ones are the positive ones, and in red you see which ones are negative, digesting that report on the right.
Which actually is like very long and, like boiling it down to these things that what we thought is about a hundred, 150 topics that are really front and center, when people are trying to analyze these documents and out of those topics, we found these, six topics to be, like, the topics that are really spoken a lot about in this document.
And then from that, we, picked up a few statements, a few snippets of people actually talking about them specifically.
And we've marked them as, this is good, this is bad.
So immediately, if you're, like, worried about or like trying to understand specific things, you can look at here, capital expenditure is bad, free cash flow is good, revenue is good, and you can see that.
One other thing is, also we can separate it out by who's actually talking.
Very often you have management talking, saying that things are fine, and then, people asking questions, saying, things are not fine, why are you saying it's fine?
That's very often the conversation.
So you want to, split it, in that way, so the Q& A piece is actually where we've, also can, drill into that of, like, where that question answering looks positive when I hit it.
Now this is, within that document, in that conversation.
What is the summary of what happened now with, if you want to go across documents actually like at the bottom here, at the bottom there are all the like different transcripts that this is analyzing, and like a bunch of them obviously you want to boil it down into like themes that are actually going across all of these documents and actually assign whether or not they're being discussed more than they were discussed in the past and that's very often something specific to customers, sorry, specific to the company that you focused in.
And in this case, for example, because this is GM, topics like that, like EV trucks, or things like, actually, toward the bottom, Lyric, which is like a specific kind of, I think it's a truck or an SUV that GM makes.
So we see very specific things that these companies are talking about ranked by, how much are they discussed more recently versus less recently.
And there's ways to also look at it as, is this something that people are talking about more, more like about in, this company as opposed to other companies in that industry, so you're trying, like we're, trying to make that comparison of of like, how do they compare against companies, very often that's what you want to do, versus the past, or versus, competitors, to again distill from looking at all these documents, which again, nobody wants to read, to digest into, what are things that you can pull out of, and, drive a conversation from there.
Yeah, so I'm also working on a version of that actually looks at this across industries to actually start you from the industry perspective and then drill into companies and then drill into like how they're looking at.
And there's different dimensions of if you're looking at it kind of basically on like whenever you last look into the company and you're looking at this one is looking over the whole 24 months period, which is essentially two years.
A lot of these conversations are happening on a quarterly basis with quarterly results.
So that covers obviously eight of these quarterly things.
But if you look at the last three months, then this could be just whatever's happening in the last three months.
So that's that.
Another thing that I managed to get through architectural approval this week is that, we also have for a while in, in the system, we have a way to Query Expand, so like WACC is, apart from sounding very funny, is a way to say like weighted average cost of capital, which is very serious.
And, I am, but then the thing is, actually you want to type in weighted average cost of capital and marginal cost of capital, etc.
And you want to have all of these different ways of understanding this in a financial sense.
And this is something that we're, already doing.
And the approval that I got was to actually also start using GPT to start doing it much better.
With of course a lot of SMEs and like kind of fine tuning GPT in ways that specifically work for our use cases.
But yeah, that's, one thing that was just a bit more recent, again, helps in that workflow where you want to start with a specific theme and then drill into what are different customers and different companies working on.
But yeah, overall, that's a few of the things that I want to show that we have in the stack.
As I said, many other things that we're working on and we don't want to talk about.
But, yeah.
Mihail Dungarov, Product Lead Text Analytics at the London Stock Exchange Group shares insights from their adoption of LLMs to help classify, tag and analyse large numbers of documents pertaining to company’s finances.