Web Performance Incubations
Now I'm going to talk about Web Performance incubations.
I'll give you a tour over a bunch of relatively new Web Performance APIs.
I encourage you to reach out, to get involved in the Web Performance Working Group.
If you want to see these become widely available web standards.
As incubations, these may change over time.
Most of them are available in Chromium.
The Largest Contentful Paint API, lets you obtain information about the largest image or text rendered in the page before any user input occurs.
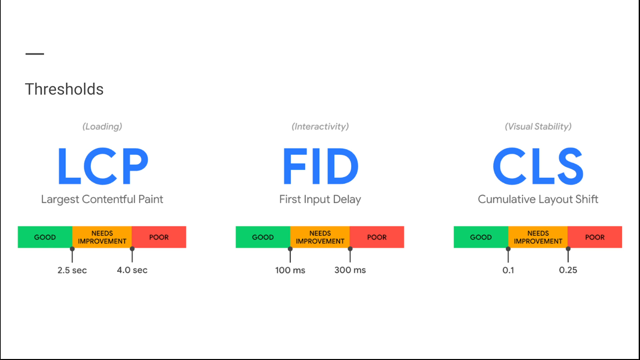
This API also is particularly interesting because Largest Contentful Paint or LCP is a Core Web Vital and earlier talk on Core Web Vitals talked about this.
So I won't go into detail here.
Just note that the largest content changes over time as more and more content is loaded.
What timing information do you get?
The timing attributes are listed in this slide.
The start time will include the latest available timestamp for the content, which may be the render time or the load time.
The render time is the time in which the content has been rendered on the screen.
For images, it is the time in which it's rendered once it's fully loaded.
So blurry, progressive images won't count.
If you want to get this attribute for cross origin images, you'll need to set appropriate Timing-Allow-Origin headers.
Finally, the load time is available only for image content, and it is the latest between when the image has loaded, and when it is added to the DOM.
This attribute is exposed, regardless of Timing-Allow-Origin headers, Web Performance APIs also provide attribution information so that you are able to map the timing information to the relevant content in the page.
In this API, the id attribute returns the element's id.
The element attribute returns a pointer to the element, although it can be null, once the element is removed.
The URL attribute returns the source URL in the case of image content.
In addition, since this API exposes content that it considers important based on size, you are able to see the size of the content.
One caveat with the size is that images that are extended to occupy a lot of space may not be considered large by this API.
The size used also takes into account the intrinsic size of the image.
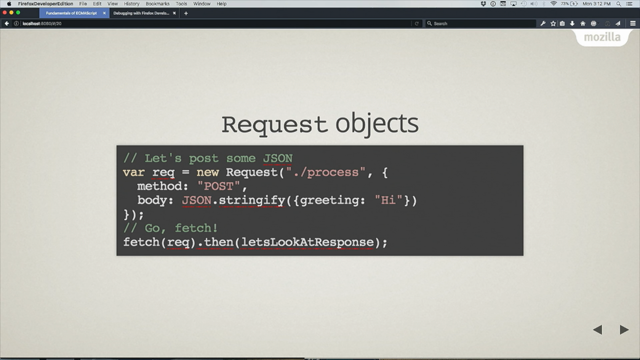
Here's some sample of JavaScript code using Largest Contentful Paint.
With all of these incubations, you can use the performance of server to obtain the information exposed by the API.
The callback may receive multiple entries.
So we use a for loop to go over them.
In the sample code, we keep track of the LCP candidate and update it over time, as we get more accurate information.
Every time we get a new LCP candidate, we log the rendering time and the size of the candidate.
When it's time to dispatch analytics, we only send the latest LCP candidate along with some attribution information to help us understand what the largest content was.
The next incubation I'd like to talk about is the Element Timing API.
It allows you to measure rendering performance for text or image content that you care about.
You choose which text or image content to measure with this API.
So it's very flexible.
But it does require specifying what it is you're interested in.
Now, how do you use this API?
First you need to annotate the relevant text or image element with the `elementtiming` attribute.
Setting this attribute when adding the element will enable you to later receive detailed timing information about it in JavaScript.
What timing information do you get?
These are pretty much identical to Largest Contentful Paint.
You likely want to use starttime, but make sure you set up Timing-Allow-Origin headers properly because otherwise your image content won't receive very accurate timing information.
The attribution bits are also similar.
The ID, element, and the URL are the same as with Largest Contentful Paint.
The identifier attribute returns the element's, elementtiming value.
Finally, the intersectionRect returns to the rect occupied by the content when it was first painted on the screen.
Here's some sample JavaScript code using element timing.
In this example, we log details about the entry and then send the start time and the identifier to analytics.
Note that the buffered flag in the last line enables you to obtain entries that were created before you call the observe method.
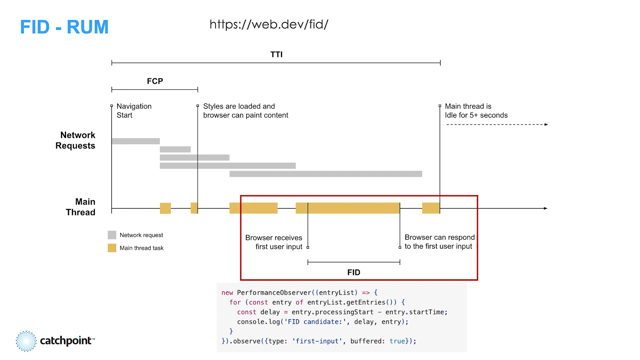
The next incubation I'd like to talk about is Event Timing.
With this API, you can measure some information about events that are triggered by user interactions.
You can choose to get events that are handled slowly via the 'event', entryType.
The API also allows you to measure the First Input Delay or FID, which is a Core Web vital via the first-input entryType.
Let's go over to the timing information provided.
The startTime is equal to the event timestamp, which generally represents when the user interacted with the page.
The processingStart is when event handlers are about to start running.
And the processingEnd is when all event handlers have finished executing.
Finally, the duration is the amount of time that passes between startTime and the time when the user sees the screen being updated as a result of running event handlers.
Finally, the duration is the amount of time that passes between startTime and the time when the user sees the screen being updated as a result of running event handlers.
This duration value is rounded to the nearest eight milliseconds for security reasons.
I'd like to make two additional comments.
First, the input delay can be computed by subtracting.
startTime from processingStart in the first-input entry.
Second, you shouldn't view duration as meaningful end to end duration.
For instance, it won't wait for any fetch or setTimeout calls, queued inside event handlers.
Instead it will just capture how long it takes to update the screen as a result of the work executed directly on the event handlers.
Now let's talk about attribution, which in this case means how to understand what the user did to trigger to the event.
The name attribute tells you the event type, like click, key down, et cetera.
The cancelable attribute tells you whether the event was cancelable or not.
And the target attribute tells you which element was the target of the event.
Together.
these attributes should help you understand the user interaction being measured.
Here's some sample code.
Looking at the last line, we observe only events with a duration of 48 or more.
For each event, we compute its delay, which is processingStart minus startTime.
And the amount of time spent processing the event handlers, which is processingEnd minus processingStart.
Then we send the data to analytics.
Here is another example using this API, but in this case focused on the single entry of type first-input, which is surfaced regardless of its duration and is useful to compute First Input Delay.
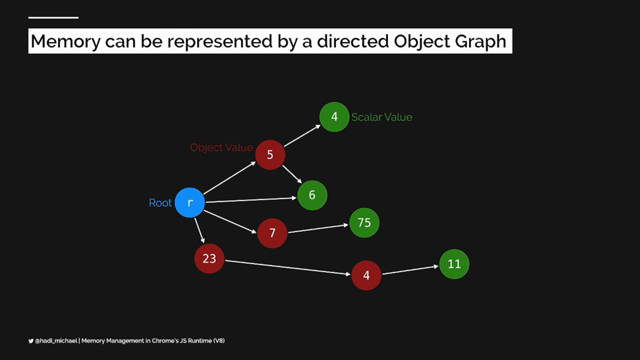
The next incubation we're looking at is layout instability.
It aims to measure content shifting on the page, as you can see on the image.
It aims to capture frustration that users often feel when engaging with a site, which then loads more contents and moves the existing content to a different place on the screen.
This API also enables you to compute Cumulative Layout Shift, which is another Core Web vital.
The API also enables you to compute.
Cumulative Layout Shift, which is another Core Web Vitals.
Now, how does the layout shift entry look like?
You'll get one of these if there was an animation frame where content moved around unexpectedl.
It includes a value, which is a measure of how much the content moved.
I won't go into details here, but if interested, check out the Core Web Vitals talk.
The entry also includes a hadRecentInput boolean, which says whether there was input within 500 milliseconds of the shift,.
We consider shifts occurring shortly after user interactions to be reasonable, as the page can change in response to the user input.
Finally, the entry has a sources array with up to five nodes that shifted, including the exact previous and current rects with the positions of that node before and during the shift.
So how do you use this API?
In this sample code we compute the total layout shifts in the page.
This is not quite the CLS, which is a bit more complicated to compute.
We add the values over the entries, excluding entries which hadRecentInput set to true.
We also logged information from the sources attribute.
Notice that this does not tell us what caused the shift, but rather what's shifted, which is often not the same.
There are three incubations left and not a lot of time, so I'll only mentioned these briefly, The isInputPending API allows you to know whether there is input that the browser is yet to process.
You can call this in the middle of your JavaScript code to know whether you can keep working in the current task or whether you should yield to the browser so that it can process the user input.
You would yield by executing the remaining work under a setTimeout.
The measure memory API allows you to get a detailed memory breakdown of your page.
This is a vast improvement over the previous alternative, the non-standardized performance.measure.
Note that the API only works on cross-origin-isolated websites.
Last, but not least, the JavaScript self profiling API.
This one is not available on any browser engine as of this recording, but it will soon be available in Chromium.
I'm excited about this API because it provides you JavaScript stacks from real user devices.
By analyzing the data, you can better understand what work is taking a lot of time, especially during critical moments in the page.
This brings us to the end of our presentation.
If any of these incubations sound particularly interesting to you, please engage and help shape the future of Web Performance.
Thank you.
And I hope you enjoy learning about what's new in the Web Performance Working Group.
We’ll discuss what the goals of the W3C WebPerf Working Group are, the browser standards we help design, the latest proposals / incubations for the future, and how you can participate!
WICG GitHub for: Largest Contentful Paint
WICG GitHub for: Element Timing
WICG GitHub for: Event Timing
WICG GitHub for: Layout Instability
WICG GitHub for: is-input-pending
WICG GitHub for: performance-measure-memory
WICG GitHub for: js-self-profiling