Web Performance 2023
before we get started I just want to thank the good people over at Web, Directions for this, and I don't know how many here are having their first in-person event in a few years.
So I just want to give a hand to the organizers if we can.
Because I, think this is a bit of a daunting task.
So it's my first time in Sydney super excited because I've been to Melbourne and I was supposed to be in Perth earlier this year, but I had Visa issues, and but now I'm here, so I'm, I'm.
like super delighted.
First of all I like to greet each and every day with this very phrase.
Good morning DOM.
We work with the DOM pretty much every day, so I just wanna, I don't want to disappoint her.
So I give her a little shout out.
As we just said, I am a runner and I actually love running.
I got into it a few years ago and basically I, I realized that there is a bit of a, kind of like a parallel between being a runner and, Web performance.
Web performance, there are a lot of things that we have to take care of to really get like a good result, good output a good experience.
Running is of like the same.
You know the shoes that you wear, is it a windy morning?
If you're racing the course, elevation up, down, too many turns, that's no good.
That's like a network.
The feel of the track if you're on a track, sometimes down to your clothes for the runners out there who understand that distance, eventually if you have the wrong fabric, it just sucks.
So these things are really important.
But at the end of the day I've always felt, like I said running and Web performance, there's a parallel.
In fact, I feel like Web performance and the Olympic Games have a bit of a parallel.
Would you believe me now that's what I thought.
Let's get back down to it.
This is my only race this year.
Yeah, '22.
I haven't raced at all.
Didn't train a lot, but when I did go to Carlsbad, California I ended up with something like this.
It was a 5k.
I'm a 5K fan, and time 21:28, my pace 4'14".
You can see the cadence.
You can see the stride.
You can see the average speed.
These are all metrics, and once upon a time, I used to really take a look at my, time.
I'm like, yo, what was my time on this?
I'm like, oh, okay.
But these days I really pay attention to my pace cuz my pace will really register with me in terms of like, how I felt.
Was it tough, you what was the final number?
So I'm gonna talk about Web performance today.
I'm gonna give it a bit of an Olympic theme.
So welcome to performance 2023.
I'm gonna talk about what's going on today, a little bit of history and what we can look forward to in the future.
So it look at performance, present, and future I could have put past, but whatever.
My name is Henri.
You can find me on the interwebs at @henrihelvetica.
Because Twitter's still up.
I work at the venerable WebPageTest.
Any WebPageTest users here?
Alright we'll work on that . I'll be around even though I have, I don't have a booth.
But you can find us at @RealWebPageTest as well.
Yes, I work with developers.
I love being at conferences, talking about performance, talking about WebPageTest, but generally trying to get people up to speed when it comes to performance, cuz it's super duper important.
And I'm in the greatest city in the tra in on the planet, which is Toronto, Canada.
Anyone been there before?
Alright, we'll work on that too.
So let's get started.
We're gonna talk about metrics, but do we know what a metric is?
Do we have any idea?
Really it's a system or standard of measurements.
Everything is or has a metric ticket sales for this event.
Metrics, right?
The amount of, I don't know laps you do when you're running metric the rings on your Apple watch, you're trying to close.
More metrics, right?
But we're talking about modern development today and development is modern and is gotten a little complicated, but modern development requires modern metrics.
And we're gonna talk about that as well.
Now I'm a big fan of history.
You'll hear that a couple times during my talk.
Who here remembers Firebug?
Okay, we have some OGs in the room.
All right.
Let's talk about Firebug.
So, Joe Hewitt, the author, when he launched it in 2000, I believe seven or six, something like that.
He was quoted saying the following 'fire bug exists for two reasons.
One is to show what's going on your page when it loads.
The other is to show what happens after it loads.' All right?
Those are two metrics right there.
And in fact, if you take a look at what Firebug looked like, this is like the super duper early days of you could say dev tools a bit.
You can see the metrics there.
Some, timing metrics.
And this is what he wanted to see cuz he wanted to have a good idea of how it was performing.
And in fact if you really deep dive and if you ever go to YouTube and watch some talks Firebug was considered Web development evolved.
Right.
We were seeing this evolution of what it meant to have an app online and how it would execute.
Annie Sullivan, who works at Google, who's on the speed team, who's very much one of the leads around like Core Web Vitals and all the metrics that you may know once you pop the hood She had this quote that I like 'a lot of sites from the nineties, Hey, the nineties performed really well because they didn't try to do so, many things'.
Gift and curse because you probably bought the ticket for this event online through a website.
You probably, if you flew here, you bought that ticket to come here on a website and so many other things.
She talked about the many things that we do, but a lot of things happened for us to get to this very moment.
In 1995, images were introduced to the internet: RFC 1866.
For those who care.
In fact, a 27 year anniversary a couple weeks ago of the image tag.
In 1996, JavaScript was introduced.
Ooh boy.
JavaScript bought a lot of homes, but a very pivotal moment there as well.
By the way that anniversary is December 4th.
For those who care.
But we're gonna talk about 2016.
And why am I gonna talk about 2016?
Because we hit a, another pivotal point in Web history.
It's the year, and I'm gonna say about the fall because some people will argue about the actual time, but it's the year that the internet was being accessed more on mobile than desktop.
You have to take that in because this is the point in history where we will never go back to, oh, looks like desktop is back on top.
Oh no, no, mobile.
No, this is it.
So anytime you're developing, this is what it's all about.
And in fact, if you wanted to look at further stats in 2022, roughly 67% of traffic is on mobile.
All right, so we're past that little 50% plus one.
It gets a little gangster.
Top 1 million sites, 82% on mobile.
Top, a hundred K, 86 top 10 K.
89% of traffic is on mobile, so if you didn't believe it now.
But we are talking about 2022.
And as I just shared a lot of the stats really point to the fact that we are operating in a mobile world.
As I see a bunch of people on their desktop at the front , laptop, which is pretty funny.
And we're here ultimately to improve the user experience because we know that on mobile it's a lot different.
And that's undisputed.
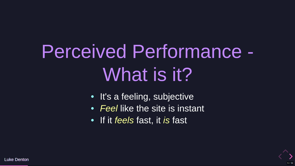
And in fact here's another quote that I really page performance is now parts proof, perception and all user experience.
That's me, by the way.
I like it.
So let's talk about JavaScript real quick.
I, just wanna share some stats with you to get you into that head space.
So in 2022 at the median, we are loading 461, 461 kilobytes of JavaScript.
All right?
And that's at the median.
That's up 8% on a year to year basis.
Now, if we look at P 75, we're jumping to 857.
That's no small amount.
And at P 90, you.
We got the big Masterdon [makes thumping noises].
Again, keep this in mind because this da, these data points will come back.
Now we also have since we do use a lot of JavaScript, we also have a lot of unused JavaScript on the net right now.
Now at the median, we are leaving behind 162 kilobytes of JavaScript served parsed, but unused.
That's 35.1%.
At P 75, it's 39 9, and at P 90 it's almost 50% of the JavaScript that's going unused.
So again, take that in.
You left food behind, you're hungry and half the plate is like leftover.
Waste.
First and third party js.
I am not pounding JavaScript here, but again, I just wanna put you in that head space.
At the median, we are serving almost 63% of third party JavaScript, so we're talking about resources that you have absolutely no control over.
So quiet in here, I feel it's like a funeral . It's it's not that bad but I'm just giving you some stats here.
At P 75, we're leaving 62% behind almost 600 kilobytes of JavaScript, which is third party outta your control.
And at P 90 it gets wild.
Now granted once you get into this range, you're probably looking at like larger sites.
Big media sites, ESPNs of the world et cetera, et cetera.
But these are things that you absolutely have to con consider because you will be one day working on these massive sites.
Now I'm gonna jump down into images as well.
Because even though I've brought up the JavaScript, images have become a bit of a problem shockingly, because no one really paid attention, but things have gotten wild.
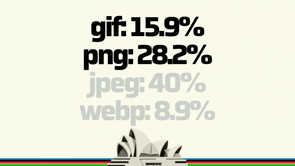
So right now on the internet, this is what the breakdown of image formats is like.
16% [pausses on the initial g] gifs.
PNGs JPEG and webps.
Alright, that's what it, that's the snapshot of the Web as we speak.
I'm gonna drill down on these two.
Why?
That means we have 44% of lossless formats on the Web.
I personally don't believe even 1% of lossless formats belong on the Web, but it's the very reason we came up with WebP.
It's the very reason we came up with AVIF.
It's the very reason there's an argument taking place right now around JPEG-XL, but these are formats that belong on the Web, and in fact, they're created for the Web because we saw a use case and page weight was rising, et cetera, et cetera, et cetera.
And this is gonna, this stat's gonna come back to haunt us a little later.
Only 20, 25% of images are lazy loaded right now.
How is that possible?
I'm gonna say it right now.
And I I'm, bringing up some of these data points to get you again, in that mindset, but I really believe that there are no real mistakes in performance, just oversights, all right?
And these oversights get dealt with once you start to get in that space where you're like, oh, you know what?
Let me go double check this to make sure it's done correctly, and I'll, touch on that a little later as well.
But this is very important because if we're talking about Web performance, this is a bit of a low hanging fruit.
All right?
You could fix this with one line.
Now.
I talked about modern development and the fact that it requires modern metrics, so we're gonna talk about that as well.
Any Lighthouse users here?
Okay.
So you're gonna be familiar with a lot of what I'm gonna talk about right here, but at the end of the day, the modern metrics pretty much look like this.
Much different than what we used to do once upon a time.
But the data brought us here.
The data drove the creation of these metrics.
So first contentful paint you're able to how quickly are you able to get a speck of non-white content onto your viewport?
Time to Interactive, obviously an Interactive metric that JavaScript is responsible for.
The speed index a a, metric that I like a lot actually.
It's not super well understood, but we're talking about the visual completeness of a page and I know Lighthouse provides more or less like this figure, but it's actually even better when you see it in a graphic.
And then we have total blocking time, a very important metric that weighs heavily on your Lighthouse score for those who are familiar with that.
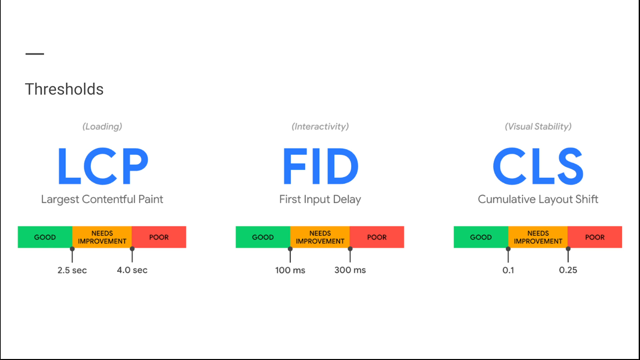
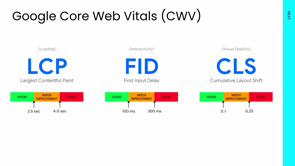
But what I do wanna talk about are the last three right here, starting with the Largest Contentful Paint.
The Cumulative Layout Shift, and the First Input Delay.
They may sound familiar.
Look familiar.
That's because it's the trio that make up your Core Web Vitals.
So let's talk about this real quick.
Largest Contentful Paint.
Why am I drilling down on this?
Yes, it's a core web vital, but it's also the metric that developers seem to struggle with the most.
Out of the three Core Web Vitals, it's the one that scores the least in terms of it's like good rating and in fact it's somewhere around 55%.
I'm gonna bring that up a little later.
So 55% of the internet has good Core Web Vitals, which obviously means 45 or mediocre or horrible.
And in fact, Core Web Vitals, one of the challenges is that 75% of, of core web vitals, sorry, LCP, Largest Contentful Paint, 75% 70% of the Largest Contentful Paint is made up of images.
So if your image management isn't done properly, this is gonna go south in all likelihood.
Here's another stat.
Almost 10% of LCP images aren't or are lazy loaded-driving with your hand brake on.
That is the equivalent.
Stats that I want you to take in.
Cumulative Layout, Cumulative Layout Shift once called just the 'Jank Index'.
How your page, if it jumps around, yes or no, that's more or less dealt with as well somewhere around the 70% range, but can always improve.
But that this has gotten more important as well.
Weighs a little bit heavier than it used to on your, Lighthouse score.
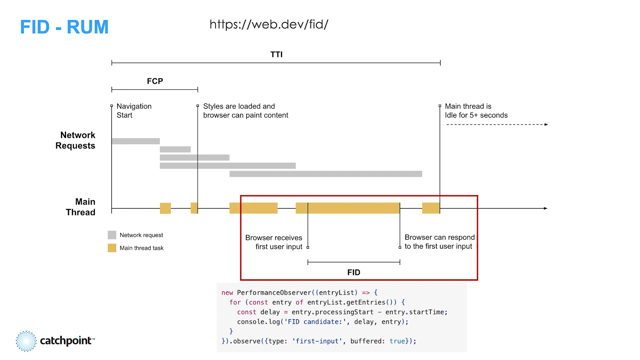
And First Input Delay an interactive metric, but through data driven research, this is probably gonna get sunsetted.
Because they're noticing that sites all around the net are scoring extremely well on it, and they had to go back and be like, are we doing this correctly?
And that led to this next metric right here, which is experimental, which is why you see the little test tube.
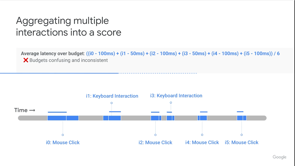
Interaction to Next Page.
Paint, pardon me.
It's not so much a paint metric, but it's really a metric that's measuring the interac, the interactions through a session instead of what was going on with FID, which was like a quick snapshot in time.
You'll be able to read about that.
And the one that I want to talk about as well, which is not really a Core Web Vital, but Time to First Byte is very much indicative of what could take place with your entire set of metrics.
If you do not get your Time to First Byte handled correctly, it'll be like this domino effect.
And I think I tweeted this out maybe a couple months ago, maybe a month ago, in fact.
It's like getting up late, having a late breakfast, showering late.
You're probably gonna go show up to work late.
And that's what the Time to First Byte will provide.
If you don't get that right.
So where are we at now, ultimately?
The key is to, we have to be a lot more granular in our work.
It's not just about let me just serve this image.
No, What am I serving?
Which format?
What attribute am I adding to this?
Because we have gotten past the point of just let me just throw it out on the net and figure it out.
We are getting more, we are doing intra resource optimizations now, right?
So things like resource hints prefetching and preloading.
These things are important because we have to give the browser some indication of what to do with a particular resource that we want to see show up as early as possible.
Things like fetch priority recently landed.
Again, being able to give the browser instructions on which resource is the important one.
Which one can you okay, you know what?
Don't pay too much attention to this resource right here.
Early hints, experimental phase, but we're getting on the server side, sending instructions saying: 'you know what?
I need this particular resource as you're parsing and sending the HTML.' I want it that early.
Again, these are options that are available to us to make use of so that we can create the best user experience possible.
Now, there's some other areas that are very interesting that are, being discussed.
Who here's heard of PartyTown?
All right.
People like to get down.
They're doing some very interesting work.
Execution inside a Web worker there's discussions around it, but it looks pretty good.
Also, Qwik, who's come across qwik yet?
Again, these are very early days, but we're talking about serving what you need, when you need it, and especially around JavaScript because JavaScript has been a bit of a, challenge throughout.
And they didn't have a logo, so I was like, what the hell guys?
But enhance, all right, if you go to enhance.dev, you'll see exactly what they're talking about.
Again frameworks that are really trying to push the idea of just like being as responsible as possible.
Because I talked about this last night at this meetup, which was awesome by the way.
As I use WebPageTest or other tools it is not uncommon for me to see two megs of G zipped or compressed JavaScript come down the wire.
2 megs.
Like I breathe a sigh of relief when it's like below a meg.
And that is absolutely nuts.
So data-driven decisions, we talk about this and we try to do this as much as possible.
There's some tools out there I'll, talk about in a second.
Here's a decision.
Like I was doing a little research this morning, decided to add this in.
Chances are if you have a failed Time to First Byte your Lighthouse scores probably gonna be in the 28 range.
In fact, let's talk about the Lighthouse score across the the internet right now.
50 million sites.
Show of hands if you think it's 75 or higher.
Okay.
We have a confident crowd here.
How about 50 to 74?
One person, two people.
Okay, like dozen.
How?
How about 25 to 40?
All right.
A bunch of people know the Web is slow, apparently.
How about zero to 24?
Ooh, some doom and gloom folks.
It's actually 31 cross 15 million sites.
So yes, we are going to summer school.
In fact, 42% roughly of origins across the Web right now have good Core Web Vitals.
Again, these are the challenges that we're dealt with.
Now, I talked about the data driven decisions that we like to make and we do the research for it.
Who's here familiar with the HTTParchive?
A fantastic trove of data.
It's amazing.
You mix that with CrUX and BigQuery and there is nothing you can't find out about the net.
Performance, resources being used, what formats, Javas, anything will be picked up by that combination.
But something that was announced over at this conference called Performance Now that I attended, all about performance.
Akamai is working on something called the RUM Archive.
Being able to look at RUM data in the same way that you do with the HTTPArchive.
This is in beta right now, but definitely go check it out.
It's amazing.
This is what we're doing moving forward when it comes to performance, looking at data, and of course we do that all the time at WebPageTest.
And in fact, I'm gonna give you a, quick example.
I stayed at two hotels while, I've been here.
This is the second one, the one I'm at right now.
And this is what happened.
First byte, four seconds.
That's all I need to know because it's all gonna fall apart after that.
Why?
The data says so.
And then the data got displayed.
17 second LCP.
That's not even a failure.
I'm sending you back a grade.
Et cetera, et cetera.
This is the first hotel I stayed at.
They weren't even that nice to me anyways, but once again, first byte, two seconds.
I know the story.
But you know what the best part is?
Data driven decisions.
While we were getting the data, I was like, what are they on?
What's their stack?
And this is something that we expose with our WebPageTest.
They're both on WordPress.
I just saw a WordPress dev leave . It's all good.
But what I'm saying is this, I'm not saying that WordPress cannot be fast.
I know it can be, but the data shows that generally WordPress has some challenges and we just saw some of them right here.
We just went through some data, some points, and I've been trying to share the idea that it's, just, it, you have to have some kind of understanding of performance right now.
It's not what it used to be in terms of a stopwatch, right?
It's not like, how fast are you?
Oh, that was pretty good.
3.5 seconds.
We can make some adjustments along the way.
And I've talked about the importance of understanding performance as well.
Who here likes to look at I shouldn't say likes.
Who hears who here understands a waterfall?
Cool.
The waterfall.
You look at it.
First of all, it's in all your browsers.
It will expose most of what you need to know about the page.
Performance issues and all that.
But at the end of the day I personally and over at the company I work at as well we like the idea of performance literacy.
Like I'm a big fan of that because you will look at sites differently for the rest of your life.
Once you understand what is going on, like on site, you can be like, oh what's, happening here?
Okay, I need to go into dev tools.
I need to go into WebPageTest and see what's really happening.
And that's why we actually put out a, free Web Web performance course by senior engineer by the name of Scott Jehl, who's on my team, partner.
And this will just take you through some very modern basics of Web performance today.
Super duper important.
And like I said, it's free.
So if you scan that or I'm just gonna tweet it out anyways, I'll pin it to my my Twitter pin.
I don't know, something like that.
So if you scan that, you'll be able to see it.
But again, really important in terms of what I feel will be able to get you to see Web performance is all about, especially modern performance today.
And with that being said I want to thank everyone for tuning in listening.
I don't know if there's time for q and a, but I'd be happy to, take a few questions.
If not, I'll be hanging around all day.
It's my last talk of the day, I guess, and the first one.
So thank you.
Front end performance used to be a relatively simple task–minifying, concatenating and gzipping, a bit of smushing of images, and all done.
But in 2022 it’s far more than that, and only becoming more complex.
New patterns and technologies, like native lazy loading and resource pre-fetching have given front end developers greater control over performance, but these often come with subtle challenges that can hinder, not help performance.
Core Web Vitals have changed the stakes–making performance a key quality signals for page rank. But CWV isn’t a one-and-done–they continue to evolve, and new measures, like Interaction to Next Paint (INP) may supplement, or event supplant the first generation of Core Web Vitals measures.
At Summit, Henri Helvetica, Head of Developer Community at WebPageTest will bring us up to speed with the core practices and vital technologies in front end performance today.