Comparing JavaScript frameworks performance using real-world data
Hi everybody.
So let's get started.
I'm going to ask you to raise your hand if you enjoy using fast websites or websites that have good performance, I would assume that's essentially all of you.
Now, I would like you to keep your hand up if the websites that you yourself build always have good performance.
always great.
Wow.
unfortunately that's not the case for most of us, and that's because building fast websites can be really hard, and it's not just hard for you and me, it's hard for almost everybody.
And that's the reason that according to Google, the real field, real performance data that they gather from all of the websites in the world, most websites aren't that fast.
In fact, a lot of them are pretty slow.
And that's why when we build a website, we want to use tools that will set us up for success in terms of performance and certainly we don't want to use tools that will set us up to fail.
And the most important tool that we use, the most important tool in our arsenal as website developers is the framework that we use.
And the reason for that is that when we build a website or a Web application, it's really the framework that's the driver and it's our code sitting there in the back, hopefully telling it where to go.
Because it's a framework that decides where and when to run our code, which parameters to pass to our code, what to do with the data or the return value that our code provides to it, when to update the display, et cetera.
So really not surprising that the framework has a huge impact on the performance of the website or Web application that we build.
Luckily though, we are spoiled for choice these days when it comes to frameworks.
There are a lot of frameworks that we can choose between, and in fact, a lot of the new ones, the reason for their existence is that they want to enable us to build more performant websites.
So the question is, which website should we choose?
Which, sorry, which framework should we choose when we build our website or our Web application?
So the answer to that, if we all else being equal, is that we would like to choose a framework that will help us build the most performant website.
But how do we know which framework that is?
And the answer is, we should measure.
Now, there are few ways in which we can measure performance on the Web.
One way is known as lab tests, which means that we take whatever website we build and then we test it in a controlled environment that presumably replicates the situation that our users have in the field.
This gives us total control.
we can replicate exactly the situation that we're interested in and check every facet and aspect of the behavior of our code.
But it's also difficult to do.
It's difficult to do because, setting up lab environments can be challenging and also determining exactly which, scenarios to replicate is also difficult.
It's especially problematic when we want to compare, the performance of the various frameworks because it would mean that we would need to build the exact same application in every framework that we would like to check.
And that's not an easy thing to do.
There are some tools that can help us do it, but it still can be fairly challenging.
The other approach that we can take, is to use field data.
That means collect data from actual real user sessions in the field and compare performance that way.
So real user measurements, or RUM for short, is about taking those performance metrics that are collected in the field from live sessions and integrating them in, and this way we know that we are measuring what our users are actually experiencing.
But how can we collect performance data for every framework?
can we really instrument every website out there that uses some framework and collect all this information into some sort of a database so that we can compare it?
for us it's challenging, but luckily Google is actually able to do that.
Turns out that Chrome has built into it a mechanism that collects performance information from every session that you run on the browser and sends this information back to the Google mothership to be stored in their databases anonymously, or so they say.
and then they use this information, for example, as a ranking signal into their search engine.
So all other things being equal, if Google needs to choose between two websites, which one to put higher up in the search results over the other, they can also look at the performance and they in fact give a ranking boost to sites that have good performance.
But the interesting thing is that they also provide us with access to this information.
but what information is that?
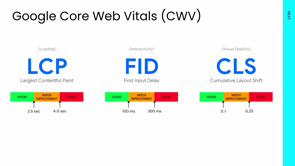
The information is the Google Chrome Web Vitals or CWV.
Now, I'm guessing that most of you are already familiar with it, so I won't go into the details.
Just mentioned that it includes L C P or Largest Contentful Paint, which look at when the largest piece of content is rendered in the browser relative to the beginning of the session.
First Input Delay, which measures the Delay from the first interaction until the browser is able to respond to it.
And Cumulative Layout Shift, which Tejas already mentioned today, which is how stuff jitters or moves around after the page is, while the page is loading and after the page is already loaded.
we really don't like it when we are re reading an article and then everything suddenly shifts and we lose our spot.
And what's really interesting is that for each and one of one of these metrics, Google has defined ranges that specify them as having, being good, or green.
So for example, for lcp, good is everything under 2.5 seconds.
Needs improvement, which is from 2.5 to four and above four, that counts as poor.
And your performance is considered to be good if you are all green, which means that for all three metrics you are in the green zone.
And like I said, all this data is collected into this Google database, the CrUX database.
And like I said, Google actually provides us with access to this information.
for example, in the Google Search Console, you will actually see what the Chrome Core Web Vitals are for the various pages on your website and know which pages to focus on in order to improve.
Likewise, we can get this information for any URL in the, Google Page Speed Insights, or PSI, and they even provided this API for external tools.
So for example, webpage test.org, an awesome tool, Henri is around here somewhere in the, crowd in the conference today.
He works there.
They also provide this information by getting it out of the Google CrUX database via an API.
But that's, really interesting if you're looking at a particular page or a particular site.
But like I said, what we want to look at is we want to look at all the websites that have been built using a particular framework.
How can we do that?
luckily, CrUX has some friends that can help us help it provide us with this information.
So friend number one is the HTTP archive.
Whenever Google puts a URL into a CrUX, it also hands it over to the HTTP archive, which runs a collection, a battery of tests on this URL and extracts a lot of information from it.
And one of the tools that HTTP archive uses is something called Wappalyzer, which analyzes the page and sees exactly which Web technologies are used within the page, which libraries, et cetera.
And specifically for our case, which framework is being used in that page.
So in this way, and all this information is written into the database alongside the CrUX data, so we can actually do queries and extract the performance information, for example, for all the websites that use React.
But to make life easier, even easier for us, this awesome guy, Rick Viscomi, who works at Google, and he manages CrUX.
He also did another cool thing, which he created something called the Core Web Vitals Technology Report, which is an Interactive dashboard that you can use.
It's open to all, it's free to use, and you can use it to compare and graph the performance of various technologies and, stuff like that on the Web.
And that's exactly the tool that I used when I analyze the data for this presentation.
So let's start by looking at the actual data.
But before we do, I want to remind us all that correlation does not equal causation.
Just because we see a particular framework match a particular performance graph does not necessarily indicate that the cause of a performance problem or performance success is just that framework.
But what I would say is this, for the same reason that despite correlation not being causation, I would not go back to Internet Explorer.
Likewise, all things being equal, I would prefer to use the framework that has the better user experience on the assumption that I'm not really any better than the Web developers out there who are using all of these frameworks.
I'm not that exceptional.
Okay then, so let's start with the graph for two things.
First of all, the darker blue line is the graph for all websites, so it really shows, remember how I said that the majority of websites don't have good performance?
now we can see it.
We can see that only a bit over a third of websites out there are all green in terms of Core, Web, Vitals.
Now I put, I also put WordPress up there because, as an indicator, because WordPress, if you don't know, 35% of all websites out there in, certainly in the CrUX, report have are built using WordPress.
And we can see that WordPress performance is even lower than the general case.
So what do you think?
Is it the frameworks maybe that have pulled the general case up?
We will see.
Just one more thing.
all the graphs that I'm showing are for mobile.
This is because it, can show either for mobile or for desktops.
I focused on mobile because we live in a mobile first world.
The majority of sessions are using mobile, the majority of people are using mobile to browse the Web, and also mobile is more challenging to make performant.
So here are the results for the top frameworks.
And by top I don't, it's not a value judgment.
It's simply by the number of website built using each one of those frameworks, and we can see that no, they are not the ones who are pulling the Web up in terms of performance.
In fact, they appear to be pulling the Web down, with the exception of React.
Vue and Angular are worse than WordPress in the case of Angular, significantly so.
React is only slightly better than WordPress, but still worse than the Web overall.
But we know that there are some new frameworks coming out that are specifically focusing on performance or at least touting performance as one of their benefits.
So let's look at, let's look at those.
Qwik seems is, is a framework that specifically is focused on performance, but it really seems to be all over the place, and it's not that they've gotten really good and then really bad, and then really good again.
It's simply because there are very few websites currently in the CrUX database.
So essentially, for Qwik, it's not statistically significant, it's just there are like four websites there or something like that.
So, it doesn't really mean anything.
So for that reason, let's move Qwik out.
Now, you might also be wondering about that hump with, Preact.
And again, it's not that Preact was really good and then got worse.
It's simply that originally CrUX did not, or Wappalyzer did not properly identify Preact.
And consequently, the data from before November '21 is meaningless.
So we'll try to ignore that hump.
another thing that's surprising when we look at this graph is that we all know that Svelt is supposed to be really good in terms of performance, yet appears to be worse than the other.
And that kind of brings us to this whole issue of correlation and causation and how careful we need to be when analyzing this data because this data is for the entire world, and as we know, Some countries have much poorer internet than others and slower devices, and it's a, it's safe to assume that in those countries people would likely gravitate towards framework that are lighter weight.
And in that way, they would penalize these frameworks because they would seem to be slower, because of the slower network.
So luckily, in order to compensate for that, this tool actually lets us filter for particular, geography.
And I chose the US simply because it has a lot of, sessions and websites there.
And indeed if we look specifically in the US we will see that Svelt really jumps almost to the top.
Now it's it's even better than WordPress in terms of performance, and it's only slightly worse than the Web in general, but it's definitely better than all the other frameworks that we still have in this graph.
React seems to be still in a pretty good position, surprisingly over Preact, and we will see why this, why this happened.
Another interesting filter though that we can apply is instead of looking at all the websites, we can look at parti specifically at the top 100k websites in term of traffic.
Now why is that interesting?
Because we would assume that the most successful websites can afford the best developers and can avoid, afford the best infrastructure and are also hot in the cdn.
So we would assume that the top websites would have better performance.
Would that be the case?
So here we are looking at the top 100K websites.
Now, I don't expect you to remember the numbers, the lines, though they didn't seem to move much, but let's compare the numbers one next to the other.
So what can we see?
We can see that WordPress is indeed way up.
It's up by about 20%, which is as as I expected, but oh, and also Angular is way up by almost 30%, but it's still pretty abysmal.
but.
If we look at Svelt is actually down surprisingly by 9%.
I don't know really.
I really don't know why that is.
But even more significantly, React is down by 16%, which kind of seems to indicate that the better developer you are, the worse in term of performance you are.
That's surprising.
to try to figure out why this surprising result happened, I tried to look at the various components of Core Web Vitals, and again, this awesome tool lets, lets us look at each one individually.
So if we look at First Input Delay, we see that it's a useless metric, unfortunately in this point in time because everybody almost gets 100.
So that's not the cause for all the changes.
CLS is a really important metric, but it's not really that dependent on the framework.
with the exception of Angular, and that's really because, building good behavior in terms of CLS is more about how, how you design and style your HTML and CSS rather than the framework that you use.
So where the differences really lie have to do with LCP.
And LCP really measures the time until the website is able to display content and in the context of frameworks that really benefits from using SSR or SSG, which we also learned about today in our first talk in this track.
Because with SSR or SSG, the website is able to deliver the visual content from the get-go.
You don't need to download the JavaScript then do a lot of work, bring data before you can display anything.
You get all the HTML with the embedded content directly from the Server on the get-go.
So because of that, I decided to look at the various meta frameworks which provide SSR capabilities and to see how they compare relative to each other.
So here are the React meta frameworks.
So here I'm focusing just on React.
After all this is a React track, and I'm looking just at the React meta frameworks in the US again, in order to, not let the geography impact the, differences.
Now what we see is that Remix is actually pretty good.
It's it's way up there.
But there are also relatively few Remix websites.
This is why it's fluctuating so much.
It seems to be stabilizing in a good direction, but we really will need to see much more use cases.
Hopefully now that it's owned by Shopify, we will see ma many more examples of Remix websites and we will be able to tell if it's really that good in terms of performance.
What might be surprising to you here is that Next.JS appears to actually be worse than React in general, and you might be surprised why I threw Wix in there.
After all, Wix is not a React meta framework.
Or is it?
Turns out that it is.
By the way, Wix, for those of you who don't know, is a drag and drop website builder.
And the reason that it's a React meta Framework is because Wix actually uses React.
So every Wix website is actually a React website, and that's how it's also identified by CrUX.
And it turns out that Wix has better performance than all these React meta frameworks.
Interesting, which means that, people dragging and dropping their way to a website are actually getting pretty good performance.
so but why did I include Wix here?
Aside from, to put it in your face.
And the reason is that approximate on almost 20% of React websites worldwide are actually Wix websites.
So Wix has a really significant impact on the React performance in general.
In fact, it seems that Wix is pulling React up.
So the reason that React seem to have better performance than Vue in others on Preact in general is essentially thanks to Wix.
And in, and if I filter out Wix by looking at the top 100K websites where the ratio of Wix websites goes really down, because Wix focuses on small and medium businesses, not larger businesses, we see now that there are MA many fewer Wix websites and there the Wix impact on React first section, it goes away, which kind of explains why it is that React actually went down, by 60 by 16% when we were looking at the top website.
It's because we eliminated Wix outta the picture.
So that would be a better reflection of where React actually is and that it's a kind of in the same category as Vue in terms of performance.
So really to, start summing things up.
First of all, CrUX is a great source of information I think we can all agree to on that.
The fact that Google, you might have various feelings on the fact that Google collects so much information about you in general and about the performance of your website specifically, but the fact that they provide all this provide us with access to all this information is really great.
Now, I'm not saying to use CrUX as a replacement for whatever, RUM tool you might be using because CrUX has certain limitations associated with it.
For example, you can only see really data aggregated over a period of 28 days.
You can't really look at data in real time.
You are limited to Chrome browsers, et cetera.
But having said all that, CrUX is a really great source of information.
Another important, thing to note I, think you saw in the graphs that I showed that none of the frameworks had a good ratio of zero, which means that you can build a good performing website using any framework, even Angular.
You also saw that none of the frameworks had a ratio of 100, which means that you can build a slow performing website using any framework even Qwik.
But again, having, said all that, we did see that there are differences, significant differences, even in the ratios, which means that the probability of you building a fast performing website using different frameworks can vary significantly.
Indeed the, like I said, the differences were very significant in some cases.
up to 50%, more or less.
But we saw that unfortunately the frameworks have worse perform, performance ratios than the Web at large.
So we are building all these great websites and Web applications using React, using Vue, using whatever, and we are making the Web slower.
Think about that.
And again, just to put it in your face, if you've got a neighbor who knows nothing about Web development and they build a website using Wix by dragging and dropping their way to the working website, and you build your website, the same website, using whatever framework you choose.
I'm betting on that guy having a faster website than yours and, that means that we should definitely do better in terms of how we build our websites using frameworks, because frameworks are unfortunately not leading us towards success at currently in terms of Web performance.
In fact, like I said, they're setting us up to fail, and I'm really hopeful that the newer frameworks that are coming out, like Qwik, like solid, like the meta frameworks, like Remix, like React Server components, that all these things will indeed pull everybody up.
But my fir, my good friend Alex Russell, he told me he's not very optimistic, so let's, try to prove him wrong.
and that's it.
Thank you very much.
I've been, Dan Shappir.
I'm still am by the way.
you can find me on Twitter where I tweet about, JavaScript and Web development and Web performance.
Also on Masterdon, because what's that's, I, gather that's where all the cool kids are at.
And like I said, I'm also a podcaster on the JavaScript Jabber podcast so you know we have new episodes out weekly.
welcome.
You are welcome to join us there.
Thank you very much.
Google collects performance information from all sessions on opted-in Chrome browsers into its Chrome User Experience Report (CrUX) database. It then uses this information as a ranking factor for its search engine, but it also makes this information publicly available for everyone to view. I used this data to analyze and compare the performance of the leading JavaScript frameworks. In particular, I looked at the likelihood that websites using each framework will have good Core Web Vitals (CWV) scores. Along the way I encountered several surprising results, and solved at least one mystery. See how your favorite framework ranks vs all the rest!