How Canva built an Agentic Support Experience using Langfuse Observability
Canva's Scale Challenge: Support at 260 Million Users
Speaker H introduces Canva's observability talk, explaining the company's growth challenge of scaling support to 1 billion users without increasing headcount. He breaks down the support funnel: of 10-15 million monthly help requests, 97% are self-served while the remaining 3% (100,000+ tickets) require human involvement and AI-assisted resolution.
Two AI Systems: Helper Chatbot vs Ticket Resolution
Speaker H describes Canva's two AI systems with different trade-offs: the Helper system optimized for latency and cost handling 10 million interactions monthly, and the Ticket Resolution system optimized for reasoning quality handling 100k+ tickets monthly. He poses key diagnostic questions the team asks about agent performance, escalation accuracy, and scaling with growing user requests.
From Logging to Tracing: Debugging AI System Failures
Speaker H explains the complex architecture underlying their AI systems—retrieval, workflows, sub-agents, LLMs, tools, routing, and prompts—and why failures are hard to debug. He describes the shift from traditional logging to AI tracing, since logging suits deterministic code while tracing better handles nondeterministic AI systems by capturing causality, latency, cost, and token usage.
Prompt Management: Empowering Non-Engineers
Speaker H discusses why Langfuse's prompt management was chosen over GitHub, emphasizing the need to let non-engineers like localization specialists tune prompts for different languages. He highlights three key benefits: linking traces to prompts for root-cause analysis, providing a single source of truth, and enabling LLM-as-a-judge evaluation for compliance and tone by non-engineers.
Building Custom Extensions on Langfuse
Speaker H details three custom systems built on top of Langfuse: asynchronous PII redaction (combining deterministic and LLM-driven components), trace sampling to manage costs at scale by focusing on automations and escalations, and trace enrichment to attach delayed events like user feedback back into traces for better diagnostics.
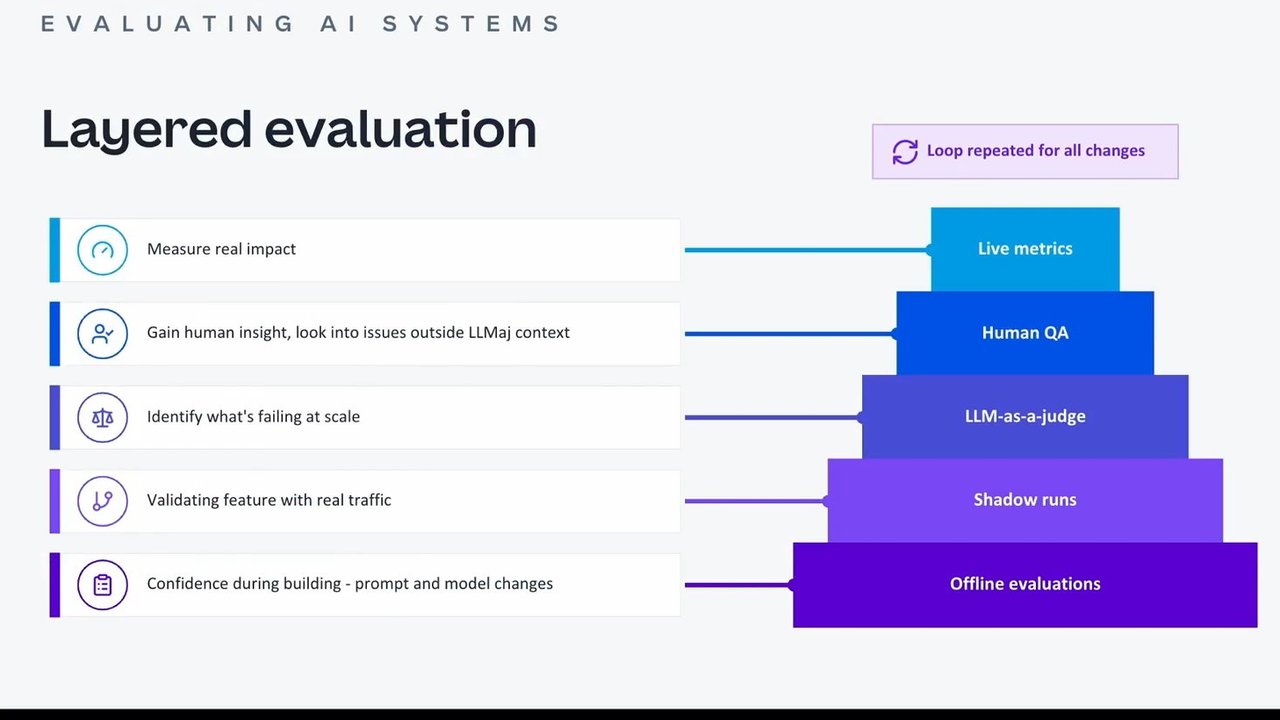
The Five-Layer Evaluation Approach
Speaker H introduces Canva's layered evaluation framework: offline evaluation for building confidence, shadow runs to test components on real traffic without user impact, LLM-as-a-judge for scaled failure detection, human QA for cases judges can't handle, and live metrics for real user satisfaction signals. He notes these five layers repeat for every feature change and hands off to Sahil for a detailed example.
Offline Evaluation for Escalation Decisions
Speaker I (Sahil) begins walking through the layered approach using Canva's escalation decision system as an example, explaining how ground truth datasets enable prompt and model experiments to measure escalation accuracy. He emphasizes that this offline eval loop empowers non-engineers, such as PMs, to iteratively improve prompts without engineering support.
Shadow Runs: Testing Safely on Live Traffic
Sahil explains how shadow runs validate changes on real production traffic without impacting users, solving the cold-start problem by capturing real data at scale (about 10k traces daily at Canva). He describes how this technique applies across multiple subsystems and details how escalation decisions evolved from escalating everything to whitelisting AI-approved responses.
LLM-as-a-Judge: Scaling Evaluation with Narrow Judges
Sahil explains how LLM-as-a-judge enables scaled evaluation using a separate model to grade outputs against a rubric, reducing self-bias. He stresses using narrow, specialized judges for aspects like compliance, response quality, and tone, calibrating them against human review, and monitoring trends over time to catch regressions early.
Human Review: The Critical Layer for Domain Expertise
Sahil describes human review as foundational for identifying issues requiring subject matter expertise beyond LLM judge capabilities, such as evaluating whether an AI agent truly resolved a customer issue. He explains human review serves two purposes: calibrating LLM judges and providing SME judgment on policy and rule application.
Live Metrics and A/B Testing for Impact Verification
Sahil discusses live metrics as the ultimate verdict on whether changes have real impact, describing how Canva uses A/B tests to roll out changes and monitor metrics like CSAT weekly. He walks through the process of detecting anomalies, diving into traces to diagnose problems, and shipping improvements based on findings.
Future Directions: Auto-Eval Loops and Cross-System Quality
Sahil previews upcoming work including an auto-eval loop using Claude Code as an agent harness connected to Langfuse to automatically refine prompts, emphasizing that dataset and scorer design are critical to success. He also discusses plans for consistent cross-system evaluation of voice, tone, and compliance, plus data anonymization to enable safer use of production traces in offline evals.
Closing Takeaways: Traces, Layers, and Democratized Quality
Sahil concludes with three key takeaways: traces become the common language for discussing AI system behavior, layered evaluations provide breadth (LLM judges), depth (human QA), and impact (live metrics), and quality evaluation should be democratized across PMs, QA, support teams, and engineers rather than bottlenecked by AI engineers.
We're
going to talk about observability today. And there were four different talks, and this one is about observability as well. And we're going to talk about how we do observability at Canva and how we solve support. Today, Canva has around two sixty million active users, and it keeps growing. One of the goals that Canva has is to grow up to 1,000,000,000 users. And this poses a very significant challenge for the support because we need to take that into account somehow.
We need to scale without increasing the headcount. So out of those two sixty million monthly active users, about two to 5% usually need help. That means around 10,000,000 to 15,000,000 requests that hit our systems. Out of those, 97% are quite simple.
They can be solved by self serving. Usually, a user would go into our chatbot, into our automation flows and find a solution themselves. And that's very efficient. The remaining 3% are usually very hard problems. They would need human involvement. And even if it's just 3%, it results in about 100,000 tickets or even more, like support tickets where a human has to go through it. And we also try to scale that with AI.
We have two large systems with different trade offs today. One of them is called helper system. That's essentially a chatbot with different automation functionality. And we optimize for latency and cost. That's where the reasoning is not as important. We try to solve everything in a real time chat fashion. Whereas with ticket resolution system, where we try to solve tickets at scale, We actually don't care about latency and cost as much, but we care about reasoning.
We care about the quality of the solution a lot more. We try to use the latest models there even though it can cost us a lot. You can see the scale. Helper system operates at about 10,000,000 interactions per month and ticket resolution system, about 100 ks plus tickets a month. And here are the questions we ask ourselves quite often.
Did the agent actually help to the user? Or sometimes it's very it's very important to escalate the issue rather than solve it. So did we escalate when we should have? Is this actually doing the right thing? Is it using the correct content? Is it using the correct tools? And finally, how do we scale with more users' requests?
So to answer those questions, we actually need to look under the hood of our system. And as you saw, each system has content, meaning that there will always be a retrieval system under the hood. If you want to give guarantees, there will probably be some form of workflows. There will be sub agents to address things like working with images for broken print orders.
There will be LLMs, as we've discussed. We want to scale that with AI in the end. There will be tools. There will be routing to be able to tell which system needs to execute which part right now for the particular request. There will be prompts and content, as I mentioned. The main issue here is that user requests go through every system.
Journey usually like, any failure in that journey is very hard to debug. The system fails quite silently. For that reason, we went from logging to tracing, first of all. Logging is being designed for deterministic code. And it's usually time ordered. It's very hard to analyze when you have the the whole AI system to to debug. You often need to run that system multiple times because it's nondeterministic.
With AI tracing, it's just a lot easier for us to look at structured by causality events. And also, has some of the other nice features, like latency, costs, tokens, models, as first class citizens. One interesting feature of LINE FUSE that we've been using is prompt management. Interestingly enough, in our domain, we want to enable non engineers to be able to tune our system to work with our systems.
And it seems like GitHub could be a good answer for prompt management, but that was not quite the case for us. While it provides rigor, the problem is we need to be able to tune our prompts by non engineers. A good example could be people who look after how we reply in different laicals. Some of the answers need to be in a good French language, for example.
And I, as an engineer, I don't speak French. I can't tune those prompts. So quick and simple rollout was another feature. We want to be able to roll out the prompts really quickly. And we want to teach those people how to experiment on data sets. So it's easier to enable others to do these simple machine learning tasks than to do all the tasks by ourselves, ML engineers.
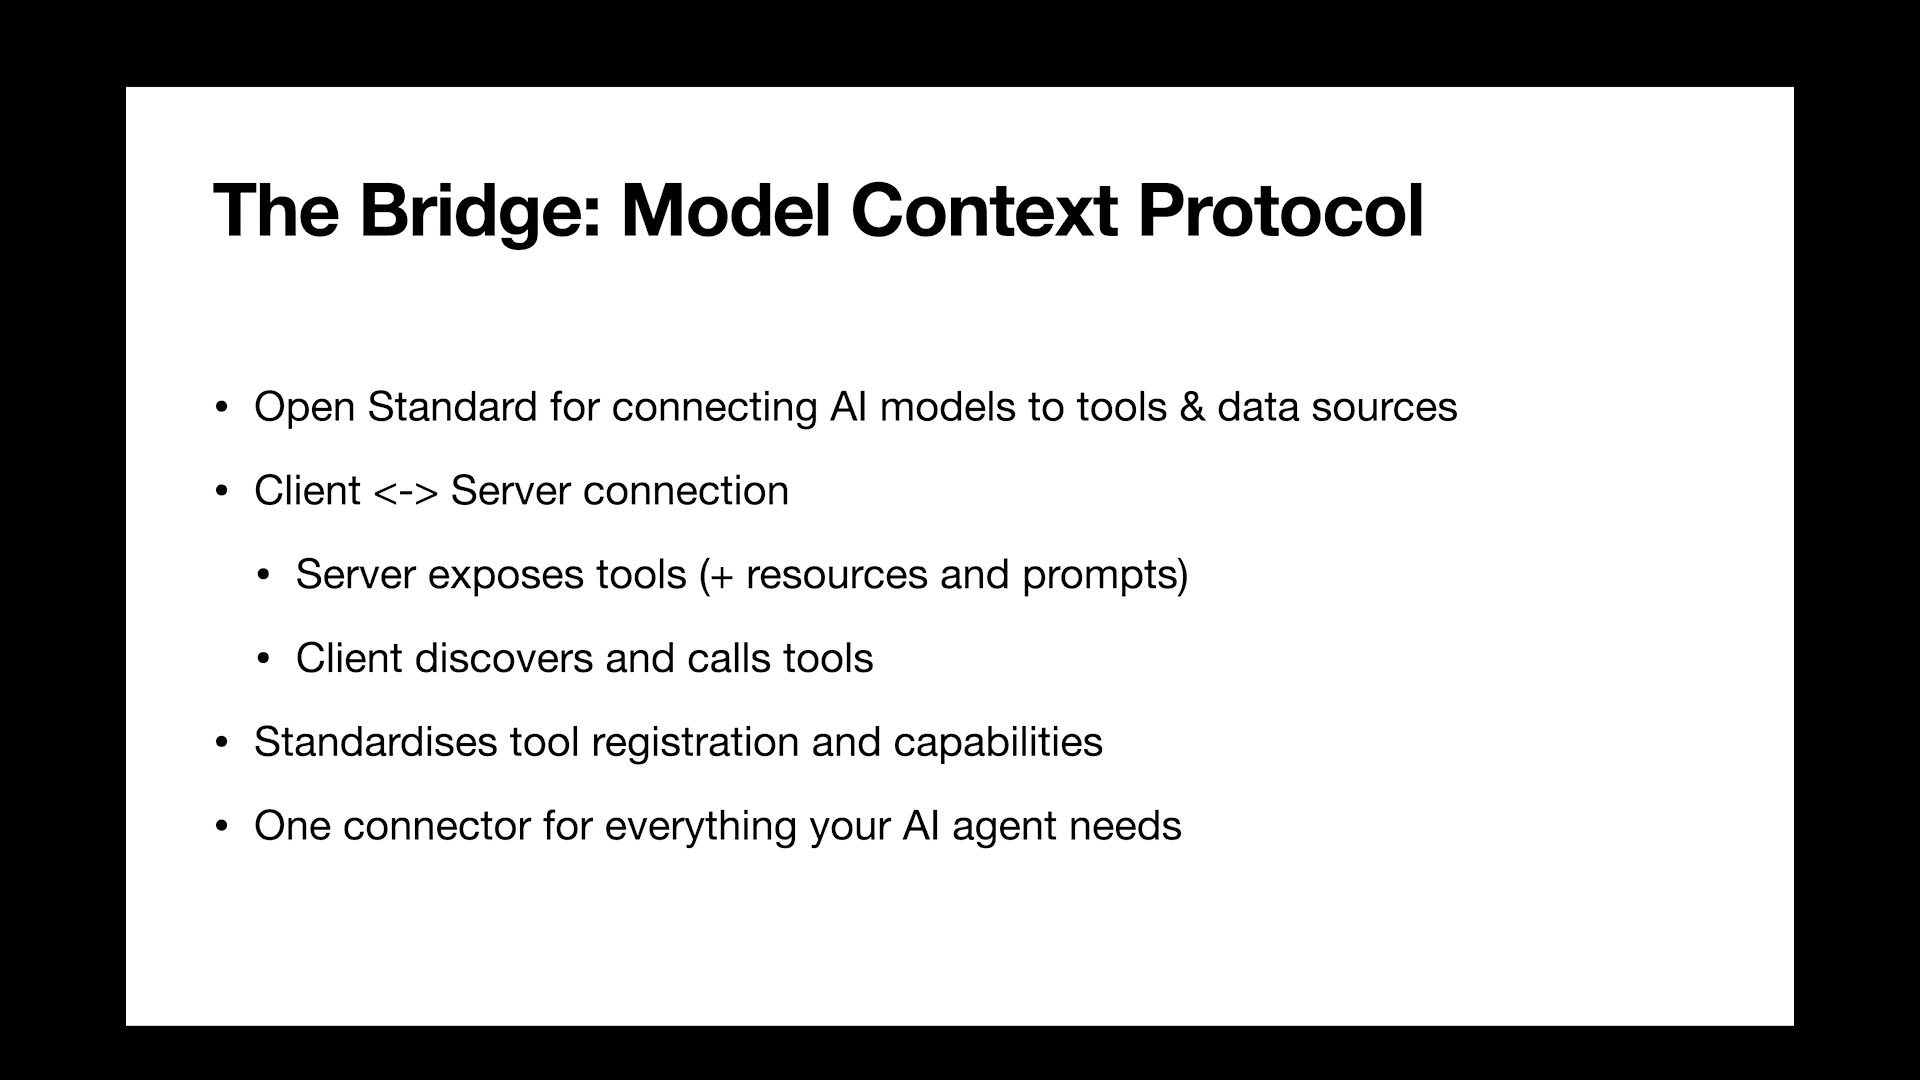
So we picked prompt management solution. And here are the top three things that we found working out of the box right away. We talked about tracing, how it enables finding issue root causes. We talked about prompt management and the good things about it, how it enables other people to contribute. What's interesting, it links traces to prompts, so now we know which prompt is exactly responsible for which failure in the trace, if that was a prompt fault.
And it gives us a single source of truth. And one more feature that we found extremely useful was LLM as a judge. So spinning up LLM as a judge might look dangerous, but it actually helps us to enable, again, non engineers to evaluate systems, to evaluate things like compliance or voice and tone for different lapels. Here are three things that we actually had to build on top of LendFuse. While it was a good platform, we quickly started building on top of it.
We needed PII reduction almost immediately, and we needed asynchronous PII reduction. We don't want a reduction to affect the runtime of our systems, so we had to build that pipeline ourselves. We also had to make sure that our reduction is robust, so we had to evaluate it properly. It's now semi deterministic.
There's a deterministic component, and there is LLM driven component. Then there is a trace sampling. At a large scale, you want to understand what's the most important part of your system. Otherwise, you pay for all the traces that you capture. We want to look into automations. We want to look into escalations and issues. And don't look at all the traces because 90% of them are not going to be that useful.
So we had to offload traces to separate DB and sample from here. And the last one is trace enrichment. This one is interesting. Once we start tracing our system, there are some events that are happening outside of that trace, but still very, very useful for diagnostics. For example, user has left a feedback for us and did it one day after the trace has been captured.
We want to add those events back into the trace and enrich traces with that useful information. So we attach that useful information to traces via an independent job that runs async. That helps us to narrow down the issues even better. After adopting the observability platform, we came up with this approach to evaluation. Essentially, it's layer by layer.
We have a flying evaluation that gives us confidence during building. It helps us formulate requirements. Usually, would pick a data set, we would run our system, we would see what the performance is like. Then it's a shadow run. This is something interesting that we've been practicing. We would often run a component independently of the system without serving the result of that component to the user so we can see how it performs on the real traffic.
Yes, it makes it a bit more expensive, but it's very valuable information, especially if you try to cold start the component. Then it's our elements of judges. They help us to identify what's failing at scale and where human QAs need to focus on. So elements of judge allows us to focus human attention essentially. Sometimes there can be areas where elements of judge simply cannot be helpful. So then human takes over and looks at those cases every week. And in the end, it's life metrics.
How did we go? What's the user satisfaction? How many tickets were solved? Those are all important signals. And they they also, they're independent. They give us a lot of useful information. So we gain those. What's important, these five layers, they are repeated for many chances that we make to the features. Next, I'll invite Sahil to talk about the example of the layered evolution approach. Thank you, Sergei.
Sorry. Can you hear me? Yeah. Awesome. Thank you, Sergei. Yesterday, I googled of how to be the last speaker at a conference, and the answer top result was Don't be. But anyways, I assume that I'm, they left the best for the last and let's get going because yeah, we wanna wrap this up before the bar opens.
Okay, so I'll go through this layered approach with this example of how we tuned our escalation decision system. So think of it as a, it's pretty much a subsystem that decides whether an AI generated response should be sent to the customer or should we escalate this to a human specialist. So the first thing is we start off with offline evaluations.
So we basically create a ground truth data set of tickets, the responses. And ideally the ground truth is whether this response is good enough to send to the user or should this be escalated and to a human specialist. The next thing that we do is we basically can then run prompt and model experiments.
So you basically run new versions against this existing data set and calculate this score. So you basically calculate the accuracy of our escalation. So how well we are doing when it comes to escalating the right prompts, sorry, the right tickets. And then finally, decide on whether the accuracy of the escalation system itself is good enough based on a threshold from a business perspective.
One thing I want to highlight here is once we have this loop set up in place, making these improvements is something that non engineers can do. So within our team, the PM was actually able to make all those iterative improvements on these prompts because we have the data set and the entire offline eval loop set up.
And that is quite empowering. Next, we talk about shadow runs. So shadow runs basically help us validate changes on real traffic safely. You basically are running new version of the prompt alongside live traffic with zero user impact. What Shadow Run pretty much also helps solve is the problem of the cold start problem where, yeah, we are basically able to capture real production data and seed this through to offline evals.
At canvas scale, you're basically talking at about 10 ks traces a day that we run as Shadow. And essentially, that's a good enough data set for us to be able to feed in the valuable items into our offline data sets. Shadow runs is not just for escalation systems. Basically, the idea can work across multiple subsystems.
So you could have multiple shadow runs for response generation to compare responses between different models, escalation prompts, compliance prompts, all can be shadowed within a single run. With the escalation decision, we actually started with, in production, we started with, okay, we'll just escalate everything to capture data in real time in production without the AI system sending any response back to the user. And then we built on top of the escalation prompt to allow for white listing pretty much the cases that we find are good enough for the AI to actually respond.
We talk about LLM as a judge. So what LLM as a judge really helps us enable is evaluating at scale. Conceptually, it's basically just another separate model that's grading your output against a rubric. Because you're using a separate model, what it really helps to add is diversity and reduce the overall self bias. One thing I wanted to highlight with LLM as a judge is it's always valuable to have narrow judges.
So basically have multiple judges evaluating individual aspects of the quality. So an example here is we have LMS judges that are evaluating compliance, evaluating response quality, voice and tone. And each of these individually provide us valuable insights on where we need to make improvements.
Another key call out with LLM as a judges is you need to make sure that we are able to align the LLM as a judge and calibrate this against human review. So we wanna make sure that human are looking at the LLM as a judge's responses and we are making sure that they're aligning with the human judgment.
Another call out is with LLM as a judge, it's important to look at the trend rather than individual snapshots. So if you're monitoring trend, it can actually be quite valuable because any sort of down trend or change in the trend will essentially help us, will be an early sign of any sort of regressions that we want to review.
Next is human review. So human review is foundationally quite a critical piece for basically being able to find improvements and essentially identifying issues that simply LLMS judges cannot evaluate just because they require subject matter expertise. So as we're looking at solving customer queries, customer issues, A lot of these aspects, for example, whether the AI agent was able to resolve a customer issue or is something that requires domain judgment, requires understand the product, requires you to understand the different nuances and aspects attached. And that's where human review is critical.
And human review is solely used here for two purposes. One is for fine tuning and improving the simple LLM as a judges, for example, the escalation decision, and the other aspect of where SMEs are actually required. So things such as, are we looking at the right policies, are we applying the right rules, and so on. Last step is in the whole layered approach is the live metrics.
So live metrics pretty much are the ultimate verdict in terms of whether the changes that we're making are actually having an impact. AB tests, we found AB tests to be, yeah, we basically actively use AB tests to roll out any new changes. And this helps with comparing live metrics. We can then look into diving deeper for any sort of anomalies in scores like CSAT over time.
And then what the process pretty much looks like is because we are tracking this on a week by week level, if there's a drop in CSAT, would detected an anomaly. You go into the trace, deep dive into the ticket, understand where the system went wrong, and then identify any sort of improvements and shift those improvements going forward.
Before wrapping up, wanted to quickly also go through what's next. So I know there's a few sessions that talked about this entire auto eval loop. But basically, this is something that we're experimenting with is how can we make the LLM as a judge collaboration more efficient. And with auto eval, the idea is that you start off with defining a data set and and then you're running this loop.
So you run and score. The AI agent is then finding failures and planning a refinement. And then the agent itself is committing a new prompt version and essentially you repeat the loop. And because we are doing Langfuse, we can pretty much use Claude code as the agent harness to essentially connect to Langfuse YMCP and run this loop to basically be able to improve and create improved versions of the prompt.
One thing I want to highlight is this approach is, the critical piece to get this right is how we define our data sets and the scorer. So yeah, that really helps with identifying and getting this to work with good quality. Next is evaluation across systems.
So evaluation across systems, we have multiple systems that we're running individually evals on, but we want to make sure that we have a consistent view of quality across all the different systems and things such as voice and tone compliance and handover. And then lastly is data anonymization. So we've talked about PII, but we want to go the next step where we can anonymize the data so that we can then use these traces safely in our production for our offline evals.
I'll close off by three key takeaways. The first thing is traces become the language we speak. So with traces, pretty much teams are going to look at traces as the first class citizen and the conversation pretty much starts with the traces. Second is layered evaluations.
So we need to have breadth, depth and impact when it comes to layered evaluations. LLMS judges provide the breadth, human QA offline evals help with the depth, and live metrics are the ones that actually show impact. And then lastly is democratizing quality. Evals should be everyone's job.
It's not something, and that's something that we have been able to achieve with PMs, QA, support teams, engineers, all helping and shipping evals and improving our systems. And the AI engineers are no longer the bottleneck here. Thank you so much and hope you had a great day and feel free to reach out for any questions.
Technologies & Tools
- Claude Code
- Langfuse
- Langfuse MCP
Concepts & Methods
- AB Testing
- Auto Eval Loop
- Cold Start Problem
- CSAT
- Data Anonymization
- Human Review
- LLM as a Judge
- Offline Evaluation
- PII Redaction
- Prompt Management
- Shadow Run
- Trace Enrichment
- Trace Sampling
- Tracing
Organisations & Products
- Canva
- Escalation Decision System
- GitHub
- Helper System
- Ticket Resolution System