Introducing Self-Determination Theory and Human Flourishing

The speaker opens by explaining his shift from AI to psychology, introducing self-determination theory (SDT) based on decades of research. He reads foundational passages describing humanity's capacity for curiosity and agency, contrasted with the potential for apathy and alienation, setting up the tension between optimal and non-optimal human functioning.

Eudaimonia vs Hedonia and the Power of Motivation

The speaker distinguishes hedonic pleasure from eudaimonic flourishing—the full actualization of one's capacities—as the deeper measure of living well. He explains that authentic motivation, as shown in research, drives not just productivity but vitality, self-esteem, and overall well-being, going beyond typical business-book framings like Dan Pink's Drive.

The Four Pillars: Autonomy, Mastery, Relatedness, and Purpose

The speaker outlines SDT's core motivational axes—autonomy, mastery, relatedness, and purpose—focusing his talk on autonomy and mastery. He connects this to clinical research on depression, noting that behavioral activation, which builds a sense of accomplishment, mirrors the same principles that drive flourishing in non-clinical populations.

Flow, Dark Flow, and the Risks of AI-Induced Addiction

Drawing on Csikszentmihalyi's concept of flow, the speaker defines it as a state where skill matches challenge in a goal-directed system with clear feedback, using motorcycle racing as a personal example. He warns of 'dark flow'—an addictive, superficial version of flow exploited by casinos and, increasingly, by AI coding tools, referencing Rachel Thomas's article on 'breaking the spell of vibe coding.'

Real-World Warnings from Developers About AI Dependency

The speaker shares cautionary anecdotes from developers like Armin (creator of Flask) and community members who describe how AI coding agents create a dopamine-driven illusion of productivity that later collapses under scrutiny. He highlights examples of vibe-coded projects that stalled or failed to deliver real results despite feeling productive, tying this to broader industry skepticism like Uber's new token budget restrictions.

AI's Dual Potential: Decaying or Supporting Autonomy and Mastery

The speaker argues AI can either erode or enhance autonomy and mastery depending on how it's used—citing 'illusion of control' scenarios where users blindly accept AI suggestions versus using AI to genuinely learn and build skill. He cautions that companies selling AI tools and employers focused on output metrics have little incentive to protect users' psychological well-being, urging individuals to take responsibility for how they engage with AI.

Historical Visionaries of Human-Computer Augmentation

The speaker traces a lineage of computing pioneers—Ivan Sutherland's 1963 Sketchpad, Douglas Engelbart's 1968 Mother of All Demos, Kenneth Iverson's APL notation, Bret Victor's interactive learning tools, and Chris Lattner's programming language work—who all shared the mission of deeply connecting humans with computers to augment intelligence and creativity rather than replace it. This historical context frames AI as a potential continuation of this augmentation tradition rather than a departure from it.

Answer.ai's Mission to Augment, Not Replace, Human Creativity

The speaker describes his personal and organizational mission at answer.ai to build AI tools that augment human creativity rather than perform tasks entirely for users. He contrasts this philosophy with typical AI marketing, which emphasizes doing work 'for you' rather than helping you understand and create.

Live Demo: Learning Recursive Language Models with Solveit

The speaker demonstrates Solveit, a dialogue-based tool designed for augmented learning, by walking through his own recent exploration of a recursive language models (RLM) paper. He shows how he used Solveit to question figures, generate concrete examples, spawn sub-agents, write and debug code, and ultimately reimplement RLM functionality himself, achieving deep understanding rather than passive output generation.

Live Demo: Rebuilding a Styling Framework from Julia Evans' Blog Post

Continuing the Solveit demonstration, the speaker shows how he used the tool to actively engage with Julia Evans' blog post on moving away from Tailwind CSS, building his own components, color palette, and typography system step-by-step with AI assistance. He emphasizes that the AI didn't write the code for him but helped him experiment and verify his own design choices in real time.

Closing Reflections: Using AI to Write the Talk and Flourish

The speaker reveals that this very talk was created using Solveit, with AI helping him organize research and track narrative progress rather than writing content for him. He closes by announcing early access to Solveit for conference attendees and reiterating his hope that others will use AI to support genuine learning and flourishing rather than passive output generation.

Cheers. Thanks for that. It's nice to be back in my hometown. It's good to see you all. I have a bit of a unusual talk I wanted to give today. The first half of it's about psychology rather than AI and hence the title which is about growing on purpose and the work that makes you.

It's such a critical moment in our history right now and the the work that we're all doing is changing. And I wanna share with you some key findings from the last fifty years of research about how your work makes you. And so then you can make informed choices about the work that you choose to do.

And in particular, I wanna draw on this this paper. It's not just a paper. It's this was a review paper at the end of thirty years of research representing hundreds and hundreds of experiments that that led to this huge overarching thing called self determination theory or STT. But I I just wanna read you the first two paragraphs of this and and I want you to have a think about it.

The fullest representations of humanity show people to be curious, vital, and self motivated. At their best, they are agentic and inspired, striving to learn, extend themselves, master new skills and apply their talents responsibly. That most people show considerable effort, agency and commitment in their lives appears in fact to be more normative than exceptional.

In other words, this appears to be how humans are born to be, suggesting some very positive and persistent features of human nature. The very next paragraph continues, yet it is also clear the human spirit can be diminished or crushed and that individuals sometimes reject growth and responsibility. Examples of both children and adults who are apathetic, alienated and irresponsible are abundant.

Such non optimal human functioning can be observed not only in our clinics but also among the millions who for hours a day sit passively before their televisions, stare blankly from the back of their classrooms or wait listlessly for the weekend as they go about their jobs. So here we have an interesting bifurcation of the observations about the nature of of human flourishing and the fullest representations of humanity that we observe.

There's been thousands of years of history and more recently, many decades research looking at this difference between eudaimonia and hedonia. So hedonia is where we get the word hedonics or hedonism. There's nothing wrong with it per se. It's that frictionless, pleasant ease, pacifisty, and kind of easy pleasures.

Eudaimonia on the other hand is what it turns out that these fullest representations of humanity are about, fully actualizing your capacities. That turns out to be what it means to to live well. And as I say, there's there's hundreds of experiments, there's randomized controlled trials, there's bucket loads of research behind this.

This is not just a a crazy idea somebody randomly came up with. So one of the sub pieces of of SDT, self determination theory, a key sub piece is around motivation. Now, why is motivation important? Interestingly, when I've read about motivation in books like, Dan Pink's Drive, which is a great book and some of these ideas come from his, the research in that book, Tends to talk about like how do you get people to do stuff for you, you know, how do you get people how do you get workers to be productive?

But it turns out actually motivation is much, much, much more important than productivity. It turns out that the research shows people whose motivation is is authentic have more interest, excitement and confidence and yes, that does manifest as enhanced performance and persistence and creativity but it also has enhanced vitality, self esteem and general well-being.

So motivation is key to this kind of flourishing, this eudaimonia. SDT, has three particular axes and then I've added on one more which is very commonly seen to create these four, which is it comes from autonomy, mastery, relatedness and purpose.

Relatedness is all about connecting with other human beings, and feeling supported and part of a group and purpose is all about what you're doing something for. Is there something worth doing? I'm not gonna talk much about those two today. They're very important but they're rather orthogonal to the points I wanna make. So I'm gonna focus on autonomy and mastery.

Interestingly, there's another few decades of research from a completely different part of the research community that have looked at the opposite question, which is, rather than what helps achieve human flourishing, it's for those who are very much not, the very much not, which is those with, clinical depression, how do we pull them out of it?

And interestingly, the research shows something very similar which is perhaps the most effective action, even versus, antidepressants, cognitive behavioral therapy, and so forth, is this thing called behavioral activation, which is basically the same thing, helping patients to engage with actions which bring a sense of accomplishment.

So from both angles, you know, going from kind of, yeah, I'm fine, I guess, to I'm thriving, or going from Jesus, life's getting me down to getting by, the same actions from very different parts of the research community show to be very effective. You've probably heard about flow and flow fits in here a lot.

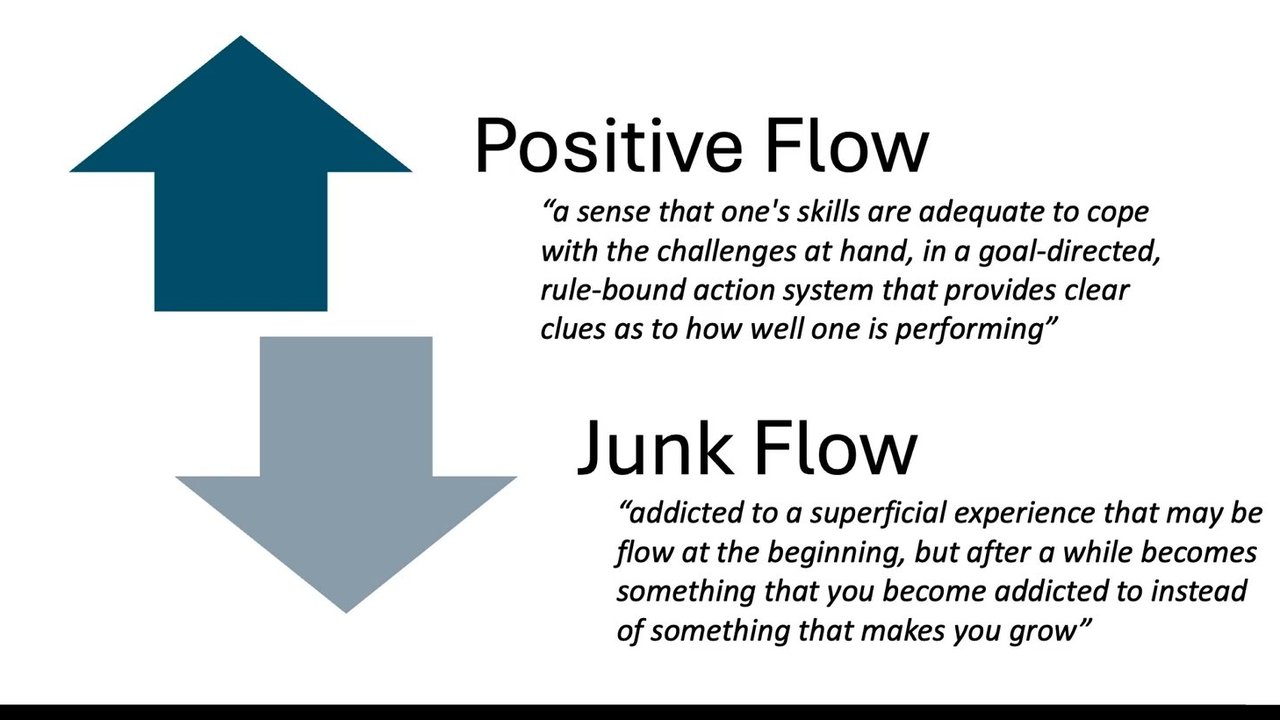
This is particularly the work of Cheksham Mahaly. And I wanted to be careful to define flow here because flow is so key to this this sense, that leads to flourishing. So flow should be a sense that one's skills are adequate to cope with the challenges at hand in a goal directed rule bound system that provides clear clues as to how well one is performing.

So one of the greatest experiences in my life was getting really good at riding a motorcycle fast around the Philip Island Circuit and that is exactly that. Very goal directed rule bound action system, very clear clues as to how I was performing, and and that sense I'll never forget, you know, of extraordinary flow.

Interestingly, however, also talks about, junk flow or dark flow, which is something that can look a lot like flow that is very bad, which is you can get addicted to a superficial experience that maybe flow at the beginning, but after a while becomes something you become addicted to instead of something that makes you grow.

And there's a lot of research and studies around this. And in fact, the way gambling establishments, the way casinos are set up is specifically designed to capture this kind of dark flow to give you what's called an illusion of control and to to to create this kind of addiction. So Rachel Thomas, I really encourage you to read this article if you have a chance, talked about breaking the spell of vibe coding in which she noted how certain kinds of interactions coding interactions with an AI can absolutely harness this kind of dark flow.

So you get this kind of positive flow when you have a high level of challenge and a high level of skill. So, it's it's it's interesting and a bit scary to note how it's quite possible to end up, with this kind of, pulling the slot machine lever version of flow if not careful.

So interestingly, a lot of people are now saying, oh, that's happened to me or that's happened to my friends, people who have previously been extremely positive about about agents and using AI encoding and so forth. I think, Armin was one of the particularly interesting ones.

He you might know him as the guy who created Flask, been a very important software developer, and, of course, also George Hots who, created the commerce self driving AI system and the original iPhone hacker and so forth. I've got some quotes from from Armen here, though, that I thought was interesting. He said, when when you know, for months, he he was in this situation where the dopamine hit from working with these agents is so very real, saying you feel productive, you feel like everything's amazing, and you go deeper and deeper in this belief that it all makes perfect sense, but it's decoupled from any external validation.

And so it's kind of starting to see this this these concerns. I saw this, like, two days ago from a guy who's been working on this kind of new GPU functional programming system who was saying, like, how cool it was that he went from naught to 95% in his most recent project in five hours and then realized like, oh, fifteen hours later, I'm still not there.

And I keep finding problems and I actually don't know if there's still problems and so actually at this point, don't even know where I stand. But getting the first 95% done in five hours sure felt good, but did I actually achieve anything by using AI other than that dopamine anticipation? So I think it's very encouraging that, thoughtful people in our community are reflecting and sharing their reflections.

In fact, one of our own community members, put this on up on our Discord the other day and was asking for feedback from from our community. He was saying talking about the product he works on. It's genuinely interesting. The problem requires deep domain expertise, but it's hard for us to verify because we've got 200,000 lines of of kind of Vibe coded software at this point.

And he he's actually realized the pace we've moved at has slowed down as models get better and token speed spend increases because we generate more and more code with less and less careful engineering. Debugging failures, he told us, you know, is super painful. And interestingly, again, I guess, this kind of dark flow idea, most of his colleagues feel they're making great progress.

But then when they have quarterly meetings with management, they get a reality check when they have to show what have you shipped, what's the accuracy, how many clients have you signed, and they suddenly realized, the results actually weren't good. So, you know, I'm I'm not gonna go, too deep into negativity. We've all seen it.

It's in mainstream, newspaper articles nowadays, Wall Street Journal, you know. I think just today, you know, Uber is now saying they're putting a strict budget on token use because they're not seeing the ROI. And so rather than, dive into some kind of, like, AI negativity, I instead actually wanna point out something that is you can go in two totally different directions with AI, and I'm looking at two of those key motivation platforms of autonomy and mastery.

And it's certainly true that AI can decay those things. So I'm sure anybody who's kind of done a lot of agentic work and vibe coding has been in that situation where we have what psychologists call an illusion of control. The agents asking you like, hey, do you wanna go with a distributed system here or would you rather use green threads since with a polling loop or whatever whatever?

And you're like, I don't know what everything that means, a or b, a. So this is this is something that actually decays your economy. On the other hand, AI can be used to support your growth. It can be teaching you things. It can be trying things.

It isn't necessarily creating more outputs more quickly, but it's definitely something that can happen. So ditto with mastery. Right? Mastery is not in in STT. It's not about creating more outputs, creating more products. It's about creating this genuine ability to craft something.

It's effortful and involves learning from that effortful work. So with AI, you can tackle more complex tasks and you can focus on learning those under underlying foundational principles and master your craft or not. Right? You could focus on outsourcing more and more to AI more and more quickly with less and less effortful practice, getting less and less learning.

So AI is neither good nor bad for you, for your psyche. But warning, the people getting you to use AI don't care about your autonomy and mastery. They care about your outputs and so they're gonna put you in the decay world all the damn time.

The people who are selling you the AI models, platforms, harnesses, and your bosses at work who need to be able to show their quarterly token maxing metrics. So you need to look after yourself in this world. So I wanna show what it looks like to have amazing mastery over a computer and how that's changed over a period of time.

So this is Ivan Sutherland. I've done done this at two x back in 1963. 1963. And he's shown how he's able to create a direct interface between himself and a computer where he's drawing with a light pen. He's you don't see it with one other hand. He's pressing buttons to set constraints as he's drawing.

He's using it directly against one of these think this is one of these fancy vector monitors, and he's showing the the interviewer here how he can create an arc, for example, using these constraints by drawing directly on the screen, and he can adjust it. This is an extraordinary level of deep connection between the human and the computer. You might have seen this, the mother of all demos.

This was 1968 that this happened. Very similar idea. So in the mother of all demos, Douglas Engelbart introduced for the first time the mouse, hypertext, real time collaborative editing, video conferencing, word processing, screen windowing, and dynamic file linking.

This quote was in 1962 towards the start of this project and what the demo was in 1968. And his goal was the same, augmenting the human intellect so that the entity to be produced will exhibit more of what could be called intelligence than an unaided human could. We've amplified the intelligence of the human by organizing his intellectual capabilities into higher levels of synergistic structuring.

So you see, it's very similar between what Sutherland was doing, what Engelbart was doing. This this was this was their mission, was to amplify and augment human intelligence. One of the most underappreciated, most extraordinary people in the history of computer science is Kenneth Iverson.

I mean, not that underappreciated. He got the Turing Award, But he designed APL. APL is a new notation or was a new notation for representing computation and mathematical thinking. This is from his Turing Award presentation paper.

And if you don't know APL, it won't look very familiar, but what he's showing here is he's proving some characteristics of the inner product in his new notation. And one of the really interesting things about this, you ever get into APL, and I strongly recommend it, is it turns out that this generalizes in a much deeper way than normal mathematical nomenclature and that the inner product in APL can actually is a is an operator that can combine any two functions.

It's not necessarily multiplication and addition. And so suddenly, he's proved a whole class of features about a whole class of functions, many of which never been looked at by a mathematician before, just through notation. And this can go a really long way. Some of you might have seen this very famous single line of code in APL, which is a complete implementation of Conway's gain of life. So here in this video, that, life function is being applied over these two characters and off it goes.

Again, it's the same thing. Right? Iverson was passionate about creating this connection between between the human and and supporting the human's thinking, notation as a tool of thought. Perhaps most mind blowingly, Brett Victor, who spent a couple of years as he described being a hermit living on a train and he came out the end of those two years of hermit hood having built the most extraordinary and inspiring array of real world demos showing about how to understand climate, how to understand electricity, how to understand how to how to build games, how to build graphics, how to understand waveforms.

And he shared this all with the world. This is his coding environment whereas he changes it graphically. This is his amazing game playing demo where he actually created a time machine for his code. If you haven't seen this, please watch everything Brett Victor's done. It's incredibly inspiring and all of it, you'll see it's all of it's the same thing.

It's creating this connection between the the human and the computer that they're working with so that they can craft. This is this is all effortful craft that he is supporting. Chris Latner, this is his playground system. He's created a whole amazing hierarchy from from LLVM, PLAANG, Swift, Playground, MLIR, Mojo, you know, at every level trying to improve this ability for humans to to connect to and work with their computers.

My argument is that, actually, we're still on this chain. We we we can continue working in in along this history from the mother of demos in a really deep and powerful way. AI is a marvelous way to connect more deeply with our computers and achieve this fullest representation of humanity.

So this has actually been kind of my mission for the last thirty years and very dramatically for the last ten. And at answer.ai, it's all of my focus, this idea that we should be seeking to augment human creativity, not to replace it. It's interesting to see hopefully, this resonates with you, but also, hopefully, you see this is almost never what you actually see as being marketed when somebody's trying to sell you a piece of AI.

It's like it's it's gonna summarize this for you. It's gonna write this for you. It's gonna do this for you. It's all about being done for you. So I wanna quickly demo something we've built to give you a sense of what it looks like to have a tool that that is specifically designed for this augmenting human creativity and understanding indeed. And so I'm gonna do it.

I'm gonna just show you a couple examples of actual dialogues I've gone through with the help of AI in the last three days. So one was I wanted to learn about recursive language models. So probably a lot of you have know about recursive language models. They've been kind of taking over the world. So I we've got this system called Solveit, and so I should show you solveitsolve.it.com.

And I loaded the paper, recursive language models paper into Solveit, and you could just read it in the normal way, piece at a time, but make sure you understand it. And so here, I looked at figure one. I was like, well, I don't know what this is or this is or this is. And so normally, I might just skip over it.

But here I can just say, hey. What's this figure? And it's tells me, like, okay. These are the three evals that the RLM authors are doing here. And and interestingly, it's like, It's going from a constant to a linear to a quadratic complexity, which is not actually captured in the original papers. That's really helpful information.

Now I don't work very well at an abstract level. I need things to be concrete, so I could ask for an example of each task. This is much easier than going into the papers and trying to dig them out and so forth. And so here, I'm getting little examples. It's like, okay. I get it. Right? So I always tell people, don't move on when you're learning a new thing or working on something until you you get it.

So I was like, okay. I get it. So then there's another figure where they describe it. I didn't fully understand this figure, to be honest, at first, and so I just it it tells me what the the key pieces are. It's very handy. So I I when I'm reading this, I'm thinking like, okay.

I want to push beyond this. I wanna understand it but try and go a bit past it. So thinking I'm like, okay, I wonder if we can replicate, all of the features of an RLM right now. So I kind of had a hypothesis about how to do that and I kind of checked with the AI like, I think we can try this ourselves and it clarified some key points about, where sub agents fit. And, as it turns out, Solveit has a sub agent. So I said, yeah, you've got a sub agent.

Why don't you try it? So in this case, it spawns an agent, and tells it to use Python to solve the complex square root. And we can also write code here. Right? So I can then try it myself and I can compare. I'm like, oh, cool. Okay. So I kind of confirmed. I'm in an environment where I can actually do the same things that the RLM paper did.

So another thing I mentioned as I read papers is often it's very easy to skip over citations. Right? But here, it says, well, here's recent recent work. Alright. Well, okay. I don't know any of these, so I shouldn't keep moving. So I said, like, stop. Can you please go and read all those papers for me and tell me basically what they are and why they're here?

I can decide whether to click on those links, read them all myself, and I would have kind of test my understanding at this point. So anyway, to skip ahead a little bit, I'm thinking like, okay, let's let's try it.

So they've got their table of results here for four different tasks. So I'm kinda thinking like, I'm not sure that this thing called an RLM even exists. It just feels like a normal tool loop that happens to have particular tools in it, and I seem to have the same tools right now. So I think we can be an RLM, can't we?

I said, let's try it. Let's try this code QA thing. I've never heard of this before. It tells me where to find the data. And so I start so it writes some code for me, which actually didn't work, but then we can it can help me debug it. And then I can test it and I then I could experiment and look at this data carefully, make sure I understand what this eval is and how it works.

And then I just tell it like, okay, solve it. Go ahead, you know, go ahead and just solve this right now. And so this is one of the things in one of the evals and it goes ahead and tries to do it and it says I think the answer is B and they check, oh, it is b. No. No.

Tell me how you did that. And then okay. Let's try another eval. And answer is C. Yep. Answer is C. And so this is very interesting. So I did this for a few different, tasks including the hardest quadratic tasks. So I downloaded another of these datasets, went through them, and, yeah, discovered that solve it correctly solved every one of the tasks. And so I've now not only do I understand RLM, I've reimplemented it. This is all in the space of a couple of hours. And in fact, discovered that this is a much more powerful platform than even RLM is.

Another example was I was looking at Julia Evans, who's a fantastic writer, always really interesting and she I'm very, I'm not a fan of Tailwind, and I was keen to see how she had done this she had this article called Moving Away From Tailwind, which had a particular structure. This was the structure she had, and I decided, okay. I wanna go through her blog post.

So I loaded the blog post, as you can see, into Solvit and I started reading it. And again, so the red is me asking questions as I go through the article. And so she said she used something called Tailwind preflight as her starting point for her styles. And I like, well, are there other options? So I went and grabbed it.

And actually, one of the cool things about Solveit is it's because it's in a browser, I've got actual styles HTML here. So I'm actually modifying my environment as I go. And so I can see see this happening, and then I can try it out. So I'm trying out layers. I've never really I'd never done anything with layers before, so I make sure I understand how they work by again, I'm actually using them. So before I actually used RLM, you know, rebuilt RLM inside a dialogue, here I am rebuilding Julia's styles inside of dialogue.

She had a section about components. And again, same thing. I started creating the components myself, as you can see, with the help of AI to make sure I understand. So here I've got a badge component, for example. And, you know, this is all real. Right? I'm creating actual code. I'm seeing it actually, running, button components.

Then very interested in colors. I kind of had some ideas about how to create a a new color framework. So I kind of bit of a discussion as you see with the AI. But again, the AI, didn't write it for me. Right? I kind of came up with this idea of what I think I wanted to do.

And then I tried it. And you can see I've created my own new color palette that I'm very happy with. And I thought, oh, cool. I'll try and map those to kind of semantics now. It's like like, okay. Which should danger be? So, like, it helps me show me what it looks like, different colors on different backgrounds, inverted ones.

It helps me create these full swatches so can see how my color palette looks. Did a similar thing with font sizes. I had an idea of how I wanted to create nice topography. So again, kind of write the code, talk through it, and have a look to see. And I'm like, oh, they all look pretty good.

Happy with that. I kind of prefer these tighter line heights than normal. So I'm really experimenting with different graphical styles to what's fashionable nowadays. So, you know, you get the idea. Right? So you won't be surprised to hear this whole talk was written in Solvit as well.

But when I say this whole talk was written in Solvit, Solvit created none of the narrative, none of the slides. Right? I asked it for examples of research. I then read the papers. And I was getting pretty tired last night, so I was I was then kind of pasting in my slides and saying, like, here's where I'm up to.

And it helps me keep track of, like, okay, this is where you're at on your narrative. As I read through the STT paper, same thing. Right? I put it in here and I was checking my understanding of it by asking as I went. So I'm gonna wrap it up there, but I I just whether you use this particular tool or some other tool, it's not so important, but I just wanted to give you some examples of of, like, how I work with AI.

It doesn't do my work for me, and at the end of every day, I feel honestly energized, excited. I'm learning more things all the time, and it seems to be working. We're building stuff that no one ever built before. I've got a strictly speaking, solve solve it is not available at the moment. It's been beta tested for the last two years by 3,000 people. But for this conference, we've given you a special code that you can use before it's officially released.

And I've also popped there links to each of the four dialogues, and it's quite cool. If you're on Solveit, you can click on any one and it'll open and solve it, and that's how you should read them. So if you wanna read any of these dialogues about STT or about creating a graphics framework, a styling framework, or about, recursive recursive language models, don't just read it.

Right? Open it, ask questions, and engage, and then write some code. And so, yeah, my hope is that by thinking of AI this way, by focusing on creating thinking about yourself as hopefully being the fullest representation of humanity, This is a period of time where you will feel like, you and the people around you are truly flourishing, and that's what I hope for all of you. Thank you.

A small, vintage, beige and black television set with a bright white screen, viewed slightly from the left. On the right side of the screen, text in Cyrillic reads 'МВ ДМВ' (MB DMB) with numbers '1 6 21' and '5 12 60' below. Below the screen, the brand 'ЭЛЕКТРОНЪ КБ 408Д' (Elektron KB 408D) is visible in Cyrillic, along with a horizontal speaker grille and a control knob on the right.
An image of television static, also known as "snow," filling the screen with random white and black dots.

Growing on Purpose

— The Work That Makes You —

AI Engineer

Jeremy Howard, Answer.AI

MELBOURNE

The slide's design incorporates a 'PLAY' icon in the upper left corner, evoking a video player.

Growing on Purpose

— The Work That Makes You —

Jeremy Howard, Answer.AI

Self-Determination Theory and the Facilitation of Intrinsic Motivation, Social Development, and Well-Being

Richard M. Ryan and Edward L. Deci
University of Rochester

"The fullest representations of humanity show people to be curious, vital, and self-motivated. At their best, they are agentic and inspired, striving to learn; extend themselves; master new skills; and apply their talents responsibly. That most people show considerable effort, agency, and commitment in their lives appears, in fact, to be more normative than exceptional, suggesting some very positive and persistent features of human nature."

"Yet, it is also clear that the human spirit can be diminished or crushed and that individuals sometimes reject growth and responsibility. ...Examples of both children and adults who are apathetic, alienated, and irresponsible are abundant. Such non-optimal human functioning can be observed not only in our psychological clinics but also among the millions who, for hours a day, sit passively before their televisions, stare blankly from the back of their classrooms, or wait listlessly for the weekend as they go about their jobs."

Self-Determination Theory and the Facilitation of Intrinsic Motivation, Social Development, and Well-Being

Richard M. Ryan and Edward L. Deci
University of Rochester

"The fullest representations of humanity show people to be curious, vital, and self-motivated. At their best, they are **agentic and inspired**, striving to learn; **extend themselves**; **master new skills**; and apply their talents responsibly. That most people show considerable **effort, agency, and commitment** in their lives appears, in fact, to be more normative than exceptional, suggesting some **very positive and persistent features of human nature**."

"Yet, it is also clear that the **human spirit can be diminished or crushed** and that individuals sometimes reject growth and responsibility. ...Examples of both children and adults who are apathetic, alienated, and irresponsible are abundant. Such **non-optimal human functioning** can be observed not only in our psychological clinics but also among the millions who, for hours a day, sit passively before their televisions, stare blankly from the back of their classrooms, or wait listlessly for the weekend as they go about their jobs."

Eudaimonia

living well and fully actualizing your capacities

Hedonia

Frictionless pleasant ease

An upward pointing arrow is next to "Eudaimonia" and a downward pointing arrow is next to "Hedonia".

Self-Determination Theory and the Facilitation of Intrinsic Motivation, Social Development, and Well-Being

Richard M. Ryan and Edward L. Deci
University of Rochester

“The fullest representations of humanity show people to be curious, vital, and self-motivated. At their best, they are agentic and inspired, striving to learn; extend themselves; master new skills; and apply their talents responsibly. That most people show considerable effort, agency, and commitment in their lives appears, in fact, to be more normative than exceptional, suggesting some very positive and persistent features of human nature.
“Yet, it is also clear that the human spirit can be diminished or crushed and that individuals sometimes reject growth and responsibility. ...Examples of both children and adults who are apathetic, alienated, and irresponsible are abundant. Such non-optimal human functioning can be observed not only in our psychological clinics but also among the millions who, for hours a day, sit passively before their televisions, stare blankly from the back of their classrooms, or wait listlessly for the weekend as they go about their jobs.”

People whose motivation is authentic... have more interest, excitement, and confidence, which manifests as enhanced performance, persistence, and creativity, and as heightened vitality, self-esteem, and general well-being

Research backed by hundreds of controlled experiments.

  • Autonomy
  • Purpose
  • Motivation
  • Relatedness

A diagram illustrating three interconnected circles representing the core needs of Self-Determination Theory: Autonomy, Purpose, and Relatedness. These circles are arranged around a central concept of Motivation.

Motivation

  • Autonomy
  • Mastery
  • Relatedness
  • Purpose
People whose motivation is authentic... have more interest, excitement, and confidence, which... manifests as enhanced performance, persistence, and creativity, and as heightened vitality, self-esteem, and general well-being

(Research backed by hundreds of controlled experiments.)

A diagram illustrates 'Motivation' as a central concept, surrounded by four interconnected elements: 'Autonomy', 'Mastery', 'Relatedness', and 'Purpose'.

Behavioural Activation for Depression; An Update of Meta-Analysis of Effectiveness and Sub Group Analysis

David Ekers¹, Lisa Webster², Annemieke Van Straten³, Pim Cuijpers³, David Richards⁴, Simon Gilbody⁵

"A random effects meta-analysis of symptom level post treatment showed behavioural activation to be superior to controls (SMD –0.74 CI –0.91 to –0.56, k = 25, N = 1088)"

Behavioural Activation is a therapy for depression based on the simple idea that depression tends to make people withdraw and stop doing things, which removes the sources of reward and momentum from their lives, which deepens the depression — a downward spiral.

BA breaks the spiral by deliberately scheduling activity: helping people re-engage with actions that bring a sense of accomplishment or pleasure, so they reconnect with the natural rewards of living and the spiral reverses.

Positive Flow

"a sense that one's skills are adequate to cope with the challenges at hand, in a goal-directed, rule-bound action system that provides clear clues as to how well one is performing"

Junk Flow

"addicted to a superficial experience that may be flow at the beginning, but after a while becomes something that you become addicted to instead of something that makes you grow"

Two large arrows are shown vertically stacked. The top arrow is blue and points upwards. The bottom arrow is grey and points downwards.

Breaking the Spell of Vibe Coding

Sinister variations on the positive state of flow

AUTHOR
Rachel Thomas

PUBLISHED
January 28, 2026

A) Classic Model of Flow

B) Quadrant Model of Flow

A screenshot of an article abstract or title page titled "Breaking the Spell of Vibe Coding" by Rachel Thomas, published January 28, 2026, with the subtitle "Sinister variations on the positive state of flow." It is categorized as "AI-IN-SOCIETY" and "TECHNICAL."

Below the article snippet are two diagrams illustrating models of psychological flow.

Diagram A, labeled "Classic Model of Flow," is a 2D graph. The vertical axis represents Skill (ranging from Low to High), and the horizontal axis represents Challenge (ranging from Low to High). It shows a diagonal wavy band labeled "Flow" stretching from low skill/low challenge towards high skill/high challenge. Above this band is a region labeled "Boredom" (high skill, low challenge), and below it is a shaded region labeled "Anxiety" (low skill, high challenge).

Diagram B, labeled "Quadrant Model of Flow," is a 2x2 grid. The vertical axis represents Skill (ranging from Low to High), and the horizontal axis represents Challenge (ranging from Low to High). The grid is divided into four quadrants: The top-left quadrant is labeled "Boredom" (high skill, low challenge). The bottom-left quadrant is labeled "Apathy" (low skill, low challenge). The bottom-right quadrant is shaded and labeled "Anxiety" (low skill, high challenge). The top-right quadrant is labeled "Flow" and contains wavy lines (high skill, high challenge).

Screenshot of "Breaking the Spell of Vibe Coding" by Rachel Thomas

Classic Model of Flow

  • Boredom: High Skill, Low Challenge
  • Flow: Balanced Skill and Challenge, characterized by a wavy path between boredom and anxiety.
  • Anxiety: Low Skill, High Challenge

Quadrant Model of Flow

  • Boredom: High Skill, Low Challenge
  • Flow: High Skill, High Challenge
  • Apathy: Low Skill, Low Challenge
  • Anxiety: Low Skill, High Challenge
Screenshot of an article header titled "Breaking the Spell of Vibe Coding" by Rachel Thomas, published January 28, 2026, and categorized as "AI-IN-SOCIETY" and "TECHNICAL." Below the article header are two diagrams illustrating models of psychological flow. Diagram A, titled "Classic Model of Flow," is a 2D graph with Skill on the y-axis (Low to High) and Challenge on the x-axis (Low to High). It depicts "Boredom" in the upper-left region, "Anxiety" in the shaded lower-right region, and "Flow" as a wavy diagonal band connecting low skill/low challenge to high skill/high challenge, situated between Boredom and Anxiety. Diagram B, titled "Quadrant Model of Flow," is a 2x2 grid with Skill on the y-axis (Low to High) and Challenge on the x-axis (Low to High). The quadrants are labeled: "Boredom" (top-left, high skill, low challenge), "Flow" (top-right, high skill, high challenge, indicated by diagonal lines), "Apathy" (bottom-left, low skill, low challenge), and "Anxiety" (bottom-right, low skill, high challenge, shaded).

Thoughts on slowing the fuck down

Agent Psychosis: Are We Going Insane?

The Eternal Sloptember

Screenshot of a blog post by Mario Zechner titled "Thoughts on slowing the fuck down". Screenshot of a blog post by Armin Ronacher titled "Agent Psychosis: Are We Going Insane?". Screenshot of a blog post titled "The Eternal Sloptember". An illustration depicting a turtle and a rabbit on a path, with the accompanying text "The turtle's face is me looking at our industry".

Screenshot of Mario Zehner's blog post titled 'Thoughts on slowing the fuck down'

Screenshot of Armin Ronacher's blog post titled 'Agent Psychosis: Are We Going Insane?'

Screenshot of 'the singularity is nearer' blog post titled 'The Eternal Sloptember'

The turtle's face is me looking at our industry

The slide displays three embedded blog post screenshots and an illustration. The first blog post is by Mario Zehner, titled 'Thoughts on slowing the fuck down'. The second blog post is by Armin Ronacher, titled 'Agent Psychosis: Are We Going Insane?'. The third blog post is from 'the singularity is nearer' and titled 'The Eternal Sloptember'. The illustration depicts a black and white drawing of a turtle looking at a rabbit running away in a forest setting.

When Peter first got me hooked on Claude, I did not sleep. I spent two months excessively prompting the thing and wasting tokens. I ended up building and building and creating a ton of tools I did not end up using much...

The dopamine hit from working with these agents is so very real. I've been there! You feel productive, you feel like everything is amazing, and... you go deeper and deeper into the belief that this all makes perfect sense. You can build entire projects without any real reality check. But it's decoupled from any external validation. For as long as nobody looks under the hood, you're good. But when an outsider first pokes at it, it looks pretty crazy.

Armin Ronacher

Machine Learning Street Talk reposted

Taelin @VictorTaelin - 4h

Just saving this here to document a story and as a self reflection on whether AI is really making me more productive

this begs the question. I spent ~20 hours in this file, and it is STILL not done. I went from 0 to 95% in the first 5 hours. Yet, 15 hours later, it is still not 100%. I suppose that is the real effect of using AI. If I had just written the C file manually in the last two days, would I not be further than where I am *right now*? Surely, the first version would have taken much longer to drop. But when I'd finish writing all that code, there would be zero, literally zero retarded shit. And, just today, I caught 5 or 6 retarded shit. And the worst part is: I don't know what the number left is, but I'm afraid it is >0. So if I have to read it all, review it all... what did I achieve by using AI, other than that dopamine anticipation?

When Peter first got me hooked on Claude, I did not sleep. I spent two months excessively prompting the thing and wasting tokens. I ended up building and building and creating a ton of tools I did not end up using much...

The dopamine hit from working with these agents is so very real. I've been there! You feel productive, you feel like everything is amazing, and... you go deeper and deeper into the belief that this all makes perfect sense. You can build entire projects without any real reality check. But it's decoupled from any external validation. For as long as nobody looks under the hood, you're good. But when an outsider first pokes at it,

When Peter first got me hooked on Claude, I did not sleep. I spent two months excessively prompting the thing and wasting tokens. I ended up building and building and creating a ton of tools I did not end up using much...

The dopamine hit from working with these agents is so very real. I've been there! You feel productive, you feel like everything is amazing, and... you go deeper and deeper into the belief that this all makes perfect sense. You can build entire projects without any real reality check. But it's decoupled from any external validation. For as long as nobody looks under the hood, you're good. But when an outsider first pokes at it, it looks pretty crazy.

Armin Ronacher

Machine Learning Street Talk reposted

Taelin @VictorTaelin - 4h

Just saving this here to document a story and as a self reflection on whether AI is really making me more productive

this begs the question. I spent ~20 hours in this file, and it is STILL not done. I went from 0 to 95% in the first 5 hours. Yet, 15 hours later, it is still not 100%. I suppose that is the real effect of using AI. If I had just written the C file manually in the last two days, would I not be further than where I am *right now*? Surely, the first version would have taken much longer to drop. But when I'd finish writing all that code, there would be zero, literally zero retarded shit. And, just today, I caught 5 or 6 retarded shit. And the worst part is: I don't know what the number left is, but I'm afraid it is >0. So if I have to read it all, review it all... what did I achieve by using AI, other than that dopamine anticipation?

When Peter first got me hooked on Claude, I did not sleep. I spent two months excessively prompting the thing and wasting tokens. I ended up building and building and creating a ton of tools I did not end up using much...

The dopamine hit from working with these agents is so very real. I've been there! You feel productive, you feel like everything is amazing, and... you go deeper and deeper into the belief that this all makes perfect sense. You can build entire projects without any real reality check. But it's decoupled from any external validation. For as long as nobody looks under the hood, you're good. But when an outsider first pokes at it, it looks pretty crazy.

Armin Ronacher

Machine Learning Street Talk reposted
Taelin @VictorTaelin · 4h
Just saving this here to document a story and as a self reflection on whether AI is really making me more productive

this begs the question. I spent ~20 hours in this file, and it is STILL not done. I went from 0 to 95% in the first 5 hours. Yet, 15 hours later, it is still not 100%. I suppose that is the real effect of using AI. If I had just written the C file manually in the last two days, would I not be further than where I am right now? Surely, the first version would have taken much longer to drop. But when I'd finish writing all that code, there would be zero, literally zero retarded shit. And, just today, I caught 5 or 6 retarded shit. And the worst part is: I don't know what the number left is, but I'm afraid it is >0. So if I have to read it all, review it all... what did I achieve by using AI, other than that dopamine anticipation?

When Peter first got me hooked on Claude, I did not sleep. I spent two months excessively prompting the thing and wasting tokens. I ended up building and building and creating a ton of tools I did not end up using much...

The dopamine hit from working with these agents is so very real. I've been there! You feel productive, you feel like everything is amazing, and... you go deeper and deeper into the belief that this all makes perfect sense. You can build entire projects without any real reality check. But it's decoupled from any external validation. For as long as nobody looks under the hood, you're good. But when an outsider first pokes at it, it looks pretty crazy.

Armin Ronacher

Machine Learning Street Talk reposted

Taelin @VictorTaelin - 4h

Just saving this here to document a story and as a self reflection on whether AI is really making me more productive

this begs the question. I spent ~20 hours in this file, and it is STILL not done. I went from 0 to 95% in the first 5 hours. Yet, 15 hours later, it is still not 100%. I suppose that is the real effect of using AI. If I had just written the C file manually in the last two days, would I not be further than where I am right now? Surely, the first version would have taken much longer to drop. But when I'd finish writing all that code, there would be zero, literally zero retarded shit. And, just today, I caught 5 or 6 retarded shit. And the worst part is: I don't know what the number left is, but I'm afraid it is >0. So if I have to read it all, review it all... what did I achieve by using AI, other than that dopamine anticipation?

AI Engineer Melbourne

Buildkite ClickHouse

"The product I work on is genuinely interesting and the problem requires domain expertise to solve, but the core challenge of building something that's easy for users to quickly verify is muddled in 200k lines of something closer to vibe coding."

"The pace we move at has actually slowed down as models get better and token spend increases, because it's easier to generate large amounts of code without careful engineering. It works for simple demos and easy docs, but anything more challenging doesn't."

"Debugging failures, going through the evals is extremely painful. Most feel we are making great progress, but the quarterly meetings are the only place where the team gets a reality check: what have you shipped, how is real world accuracy, how many clients have you signed. The results are not good."

AutonomyMastery
SupportBreak down barriers to work that was previously out of reachTackle more complex tasks, with a focus on maximizing foundational learning
DecayFake choices between poorly understood options, providing an “illusion of control”Increasingly outsource challenges to AI, decreasing effortful practice; little foundational learning
in the past, we have been writing letters to rather than conferring with our computers” (1963)
A black and white image depicts a hand holding a light pen, pointing to an early computer screen displaying geometric lines forming a star-like pattern around a central crosshair.
  • The mouse
  • Hypertext / hyperlinks
  • Real-time collaborative editing
  • Video conferencing
  • Word processing
  • Screen windowing
  • Dynamic file linking
The term 'intelligence amplification' seems applicable to our goal of augmenting the human intellect in that the entity to be produced will exhibit more of what can be called intelligence than an unaided human could; we will have amplified the intelligence of the human by organizing his intellectual capabilities into higher levels of synergistic structuring.
Douglas Engelbart, 1962
  • The mouse
  • Hypertext / hyperlinks
  • Real-time collaborative editing
  • Video conferencing
  • Word processing
  • Screen windowing
  • Dynamic file linking

“The term ‘intelligence amplification’ seems applicable to our goal of augmenting the human intellect in that the entity to be produced will exhibit more of what can be called intelligence than an unaided human could; we will have amplified the intelligence of the human by organizing his intellectual capabilities into higher levels of synergistic structuring.”

Douglas Engelbart, 1962

"in the past, we have been writing letters to rather than conferring with our computers" (1963)
Black and white image of a hand holding a light pen, pointing at a screen displaying a central point with three lines radiating outwards.
  • The mouse
  • Hypertext / hyperlinks
  • Real-time collaborative editing
  • Video conferencing
  • Word processing
  • Screen windowing
  • Dynamic file linking

" The term 'intelligence amplification' seems applicable to our goal of augmenting the human intellect in that the entity to be produced will exhibit more of what can be called intelligence than an unaided human could; we will have amplified the intelligence of the human by organizing his intellectual capabilities into higher levels of synergistic structuring.

" Douglas Engelbart, 1962

1979 Turing Award Lecture

Notation as a Tool of Thought

KENNETH E. IVERSEN

IBM Thomas J. Watson Research Center

Thus:

W[K]
(I,J,K)SF 1 3 3 2 QM.,N             D.12 Def of indexing
(I,J,K)J SF M.,N                    D.12 Def of Outer product
M[I;J]xN[J;K]
V[K]

Matrix product distributes over addition as follows:

M+ .x (N+P) <-> (M+ .x N) + (M+ .x P)                   D.14

Proof:

M+ .x (N+P)
+/(J= 1 3 3 2)QM.,xN+P                              D.13
+/(M.,xN) + (M.,xP)                                  x distributes over +
+/(JQM.,x N) + (JQM.,x P)                            & distributes over +
+/(M.,xN) + (JQM.,xP)                                + is assoc and comm
+/(M.,xN) + (M.,xP)                                  D.13
(M+ .x N) + (M+ .x P)

Matrix product is associative as follows:

M+ .x (N+ .x P) <-> (M+ .x N) + .x P                   D.15

Proof:

We first reduce each of the sides to sums over sections of an outer product, and then compare the sums. Annotation of the second reduction is left to the reader:

M+ .x (N+ .x P)
M+ .x +/1 3 3 2QN.,x P                               D.12
+/1 3 3 2QM.,x+/1 3 3 2QN.,xP                           D.12
+/1 3 3 2Q+/M.,x1 3 3 2QN.,xP                           x distributes over +
+/+/1 3 3 2Q+/1 2 3 5 5 4QM.,xN.,xP                     Note 1
+/+/1 3 3 2 4 Q1 1 2 3 5 5 4QM.,xN.,xP                 Note 2
+/+/
life ← {⊃1 ω V.∧ 3 4 = +/ +/ ¯1 0 1 ∘.⊖ ¯1 0 1 ⍉° ⊂ω}
gen ← {((life⍣*ω)α}
disp Rogen'' 14
0 0 0 0 0 0 0 0 | 0 0 0
0 0 0 1 1 0 0 0 | 0 0 1
0 0 1 1 0 0 0 0 | 0 1 0
0 0 0 1 0 0 0 0 | 0 1 1
0 0 0 0 0 0 0 0 | 0 0 0
───────────┬───────────
0 0 0 0 0 0 0 0 | 0 0 0
RR ← 15 35 t ¯10
pic ← '▞'▚' '[RR]
)ed pic

A Google: dyalog creature

{} {pico-'▞'▚' '[ω] ∘ ∘ life ω} ⍨ RR

A screenshot of an APL programming environment demonstrating Conway's Game of Life. The left side displays APL code including the definition of the 'life' function, along with an initial 6x12 grid state represented by zeros and ones. Below the grid, additional APL commands related to display are shown. The right side shows a graphical output grid where a small 'glider' pattern, a common stable oscillating pattern in Conway's Game of Life, is evolving.

Conway's Game of Life in APL

life ← {⊃1 ω V.∧ 3 4 = +/ +/ ¯1 0 1 ∘.e ¯1 0 1 φ°° ⊂ω}
gen ← {((life*ω)α
disp Rogen¨ 14
0 0 0 0 0 0 0 0 | 0 0 0
0 0 0 1 1 0 0 0 | 0 1 1
0 0 1 1 0 0 0 0 | 0 1 0
0 0 0 1 0 0 0 0 | 0 1 1
0 0 0 0 0 0 0 0 | 0 0 0
RR ← 15 35 t ¯10
pic ← -'⌸'[RR]
)ed pic

A Google: dyalog creature

{} {pico°-'⌸'[ω] ⋄ ¯.⍳dl ÷ ⋄ life ω} ⍨ RR
A grid displays the evolving state of Conway's Game of Life. On the right side, a pattern of "block" characters (⌸) arranged in a specific configuration, possibly a glider, is shown on a dotted grid background.
life ← {⊃1 ω V.∧ 3 4 = +/ +⌿ ¯1 0 1 .∘.⊖ ¯1 0 1 ⌽¨ ω}

gen ← {(life*ω)α}

disp Regen 14
0 0 0 0 0 0 0 0 0 0 0
0 0 0 1 1 0 0 0 0 1 1
0 0 1 1 0 0 0 0 0 1 0
0 0 0 1 0 0 0 0 0 1 1
0 0 0 0 0 0 0 1 0 0 0
RR ← 15 35 ⍺¯10

pic ← ¯1 8 ⍴'[RR]

)ed pic

A Google: dyalog creature

{} {pico¯1 8 ⍴[ω] ∘ _¯d1 ⍳8 ⋄ life ω} ⍨ RR

A screenshot of an APL programming environment displaying code related to Conway's Game of Life. On the left, several lines of APL code are shown, along with a 5x11 grid of binary digits representing an initial state. On the right, a 16x11 grid of dots contains a visual pattern of connected squares, forming a 'glider' shape from the Game of Life.

life ← {⊃1 ⍵ V.∧ 3 4 = +/ ÷ ¯1 0 1 ∘.⊖ ¯1 0 1 ⌽¨ ⊂⍵}

gen - {(life*⍵)⍺}

disp Rogen'' 14

0 0 0 0 0 0 0 0 0 0
0 0 0 1 1 0 0 0 0 0
0 0 1 1 0 0 0 0 1 1
0 0 1 1 0 0 0 0 1 0
0 0 0 1 0 0 0 0 1 1
0 0 0 0 0 0 0 1 0 0
0 0 0 0 0 0 0 0 0 0
RR ← 15 35 ↑ ¯10
pic ← '-' ⎕B'[RR]'
)ed pic

A Google: dyalog creature

{ {pico¯` ⎕B`[⍵]` ⋄ _←¯1⎕dl ¯8 ⋄ life ⍵} ⍣≡ RR
A grid illustrating Conway's Game of Life, showing an evolving pattern of cells represented by small '888' blocks. A small yellow cursor is visible within the pattern. To the left, a 5x10 grid of binary values (0s and 1s) represents an initial state for the Game of Life.
life ← {⊃1 ω V.∧ 3 4 = +/ ¯1 0 1 ∘⊖ ¯1 0 1 ↺¨ ⊂ω}
gen ← { (life*ω) α }
disp Regen'' 14
0 0 0 0 0 0 0 0 0 0
0 0 0 1 1 0 0 0 0 1 1
0 0 1 1 0 0 0 0 0 1 0
0 0 0 1 0 0 0 0 0 1 1
0 0 0 0 0 0 0 1 0 0 0

RR ← 15 35 ρ ¯10
pic ← '-' '8'[RR]
)ed pic

A Google: dyalog creature

{} {pico- '8'[ω] ⋄ ¯d1 ρ 8 ⋄ life ω} ∼ RR
Screenshot of an APL programming environment demonstrating Conway's Game of Life. It shows APL code definitions, an initial grid of 0s and 1s representing cell states, and a graphical output of evolving cell patterns made of '8' characters on a grid.

Conway's Game of Life in APL

life ← {⊃1 ω V.∧ 3 4 = +/ +` ¯1 0 1 ∘.⊖ ¯1 0 1 ⌽¨ ⊂ω}
gen ← {(life*ω)α}
disp Rogen ¨ 14

RR ← 15 35 ┴ ¯10
pic ← '¯⎕'[RR]
)ed pic

A Google: dyalog creature

{pico- '¯⎕'[ω] ⋄ ⎕_dl ∊8 ⋄ life ω} ¨≡ RR
Screenshot of an APL programming environment. On the left, a text display shows a 5x16 grid of zeros and ones, likely representing an initial state for Conway's Game of Life. On the right, a larger grid displays a sparse pattern of 'BB' characters against a dotted background, representing a later generation of the Game of Life simulation.
life ← {⊃1 ω V.∧ 3 4 = +/ +/ −1 0 1 ∘.⊖ −1 0 1 Φ¨ ⊂ω}
gen ← {(life*ω)α}
disp Rogen`` 14
0 0 0 0 0 0 0 0 0 0
0 0 0 1 1 0 0 0 0 1 1
0 0 1 1 0 0 0 0 1 0
0 0 0 1 0 0 0 0 1 1

Conway's Game of Life in APL

life ← {⊃1 ⍵ V.∧ 3 4 = +/+/ ¯1 0 1 ∘.⊖ ¯1 0 1 ⌽¨ ⊂⍵}

gen ← {(life*⍵)α}

disp Regen'' 14

0 0 0 0 0 0 0 0 0 0 0 0 0 0
0 0 0 1 1 0 0 0 0 0 1 1
0 0 1 1 0 0 0 0 0 1 0
0 0 0 1 0 0 0 0 0 0 1 1
0 0 0 0 0 0 0 1 0 0 0 0

RR ← 15 35 t ¯10

pic ← '.⌴'[RR]

)ed pic

{} {pico-'.⌴'[⍵] ∘ _¯d1 ÷8 ⋄ life ⍵} ≢ RR

A Google: dyalog creature

Screenshot of an APL programming environment. On the left, APL code defining and running Conway's Game of Life is displayed, including a 5x14 grid of binary values. On the right, the visual output shows a larger grid with patterns formed by clusters of '88' characters, representing live cells in the Game of Life.
life ← {⊃1 ω V.∧ 3 4 = +/ +/ ¯1 0 1 ○.⊖ ¯1 0 1 ⌽¨ ⊂ω}

gen ← {(life*ω)α}

disp Regen ¨ ⍳4
    0 0 0 0 0 0 0 0 0 0
    0 0 0 1 1 0 0 0 0 1 1
    0 0 1 1 0 0 0 0 0 1 0
    0 0 0 1 0 0 0 0 0 1 1
    0 0 0 0 0 0 0 0 0 0
    _ _ _ _ _ _ _ _ _ _
RR ← 15 35 ⍴ ¯10

pic - '⿴'[RR]

)ed pic

A Google: dyalog creature

{ } {pico-'⿴'[ω] ⋄ _-▢d1 ÷8 ⋄ life ω} ⍨≡ RR
A simulation of Conway's Game of Life displayed within an APL interpreter. On the left, a 5x10 grid of binary digits (0s and 1s) represents an initial game state or a frame of the game. On the right, a series of evolving cellular automata patterns are rendered using small square character blocks on a dotted grid, depicting various stages of the Game of Life.
life ← {⊃1 ω V.∧ 3 4 = +/+/ ~1 0 1 ○.∘ ~1 0 1 ⍉ ⊂ω}

gen ← {(life*ω)α
disp Regen'' 14

0 0 0 0 0 0 0 0 0 0
0 0 0 1 1 0 0 0 0 1
0 0 1 1 0 0 0 0 1 0
0 0 0 1 0 0 0 0 1 1
0 0 0 0 0 0 0 0 0 0
_ _ _ _ _ _ _ _ _ _

RR ← 15 35 t ~10
pic ← '-'.⍞'[RR]
)ed pic
A Google: dyalog creature
{} {pico-'.⍞'[ω] ⋄ -⍞d1 ÷8 ⋄ life ω} ⍨ RR
A screenshot of an APL programming environment displaying code for Conway's Game of Life. The left side shows the APL code defining the 'life' and 'gen' functions, along with an initial 5x10 grid of binary values. The right side shows an evolving pattern of small squares, representing successive generations of the Game of Life simulation.
life ← {⊃1 ω ∨.∧ 3 4 = +/⌿ ¯1 0 1 ◦.⊖ ¯1 0 1 ⌽¨ ⊂ω}
gen ← {(life*ω)α
disp Rogen¨ ¯14

0 0 0 0 0 0 0 0 0 0
0 0 0 1 1 0 0 0 1 1
0 0 1 1 0 0 0 0 1 0
0 0 0 1 0 0 0 0 1 1
0 0 0 0 0 0 0 1 0 0

RR ← ¯15 ¯35 ⍠ ¯10
pic ← '¯.⌷'[RR]
)ed pic
A Google: dyalog creature
{} {pico-'¯.⌷'[ω] ⋄ ⎕_dl ⌿+8 ⋄ life ω} ⍨ RR
A grid displays the evolving patterns of Conway's Game of Life, showing several generations of cell configurations represented by block-like characters.
life ← {⊃1 ⍵ V.Λ 3 4 = +/ +/ ¯1 0 1 ∘.e ¯1 0 1 φ° ⊂⍵}
gen ← {(life*⍵)α}

disp Rogen” 14
0 0 0 0 0 0 0 0 0 0 0
0 0 0 1 1 0 0 0 0 1 1
0 0 1 1 0 0 0 0 0 1 0
0 0 0 1 0 0 0 0 0 1 1
0 0 0 0 0 0 0 1 0 0 0

RR ← 15 35 t ¯10
pic ← ' 'B'[RR]
)ed pic

A Google: dyalog creature

{} {pico-' 'B'[⍵] ⋄ ¯-d1 ÷8 ⋄ life ⍵} ⎕= RR
A grid visualizes the evolution of Conway's Game of Life, starting from an initial state shown on the left. The grid displays various generations of cellular patterns, with small black squares representing "alive" cells, arranged in dynamic formations across a dotted background.
life ← {⊃1 ⍵ V.Λ 3 4 = +/ +/ ¯1 0 1 ∘.⊖ ¯1 0 1 ⍤¯2 ⍵}
gen - ((life*⍵)α
disp Rogen'' 14
0 0 0 0 0 0 0 0 0 0
0 0 0 1 1 0 0 0 0 1 1
0 0 1 1 0 0 0 0 1 0
0 0 0 1 0 0 0 0 1 1
0 0 0 0 0 0 1 0 0 0
RR - 15 35 t -10
pic - '.⎕'[RR]
)ed pic

A Google: dyalog creature

{} {pico-'.⎕'[⍵] ⋄ _-⊃d1 ÷8 ⋄ life ⍵} ⍨ RR
A screenshot showing APL/Dyalog APL code for a cellular automaton, likely Conway's Game of Life. It displays a function definition for 'life', commands for generation and display, an initial state represented as a binary grid, and subsequent commands to run and visualize the simulation. To the right, a larger grid displays the output of the 'life' simulation as evolving patterns of solid and hollow squares.

APL Code for a Dyalog Creature (Conway's Game of Life)

life ← {⊃1 ω V.Λ 3 4 = +/ +/ ¯1 0 1 ∘.⊖ ¯1 0 1 Φ¨ ⊂ω}
gen ← {(life∘.×ω)α}
disp Regen¨ 14

Initial configuration matrix:

0 0 0 0 0 0 0 0 0 0
0 0 0 1 1 0 0 0 0 1 1
0 0 1 1 0 0 0 0 0 1 0
0 0 0 1 0 0 0 0 0 1 1
0 0 0 0 0 0 0 1 0 0 0
RR ← 15 35 ⍴ ¯10
pic ← ' '⍴'⍎'[RR]
)ed pic

Comment: A Google: dyalog creature

{} {pico-' '⍴'⍎'[ω] ∘ _ -⍳1 ÷8 ⋄ life ω} ⍨ RR

A large grid displays various patterns of filled and empty cells, resembling a cellular automaton or Game of Life simulation, with different configurations appearing across the grid.

life ← {⊃1 ω V.∧ 3 4 = +/ ÷˘ ¯1 0 1 ∘.⊖ ¯1 0 1 φ˘ ⊂ω}
gen ← {(life*ω)α.}
disp Rogen'' 14
0 0 0 0 0 0 0 | 0 0 0 0 0 0
0 0 0 1 1 0 0 | 0 0 0 1 1 1
0 0 1 1 0 0 0 | 0 0 1 0
0 0 0 1 0 0 0 | 0 0 1 1
0 0 0 0 0 0 0 | 0 1 0 0
RR ← 15 35 1 ¯10
pic ← '-'B'[RR]
)ed pic

A Google: dyalog creature

{} {pico-'B'[ω] ⋄ _-[]1 ÷8 ⋄ life ω} ⍨ RR

A grid displaying the evolution of Conway's Game of Life. Dots represent dead cells and small squares represent living cells, forming various patterns including a "glider" and other complex structures.

APL Code for Game of Life

life ← {⊃1 ⍵ V.∧ 3 4 = +/ ¯1 0 1 ∘.⊖ ¯1 0 1 ∘.⌽ ⊂⍵}
gen ← {(life*⍵)α.
disp Rogen´´ ¯14

An example initial state or part of a game board:

0 0 0 0 0 0 0 0 0 0
0 0 0 1 1 0 0 0 0 1 1
0 0 1 1 0 0 0 0 0 1 0
0 0 0 1 0 0 0 0 0 1 1
0 0 0 0 0 0 0 0 0 0
RR ← 15 35 ¯10
pic ← ¯,'8'[RR]
)ed pic

A Google: dyalog creature

{ } {pico¯,'8'[⍵] ⋄ ¯.⌽d1 ÷8 ⋄ life ⍵} ⍨ RR

A grid displaying various patterns of cells, represented by quad-box characters, evolving over time. This illustrates a simulation of Conway's Game of Life using APL, showing several distinct glider-like patterns, blinkers, and other stable or oscillating configurations across the grid, depicting different generations of the simulation.

Up and Down the Ladder of Abstraction

A Systematic Approach to Interactive Visualization

Bret Victor / October. 2011

"In science, if you know what you are doing, you should not be doing it. In engineering, if you do not know what you are doing, you should not be doing it. Of course, you seldom, if ever, see either pure state."
—Richard Hamming, The Art of Doing Science and Engineering

How can we design systems when we don't know what we're doing?

The most exciting engineering challenges lie on the boundary of theory and the unknown. Not so unknown that they're hopeless, but not enough theory to predict the results of our decisions. Systems at this boundary often rely on emergent behavior – high-level effects that arise indirectly from low-level interactions.

When designing at this boundary, the challenge lies not in constructing the system, but in understanding it. In the absence of theory, we must

How do we explore? If you move to a new city, you might learn the territory by walking around. Or you might peruse a map. But far more effective than either is both together – a street-level experience with higher-level guidance.

Likewise, the most powerful way to gain insight into a system is by moving between levels of abstraction. Many designers do this instinctively. But it's easy to get stuck on the ground, experiencing concrete systems with no higher-level view. It's also easy to get stuck in the clouds, working entirely with abstract equations or aggregate statistics.

This interactive essay presents the ladder of abstraction, a technique for thinking explicitly about these levels, so a designer can move among them consciously and confidently.

I believe that an essential skill of the modern system designer will be

An illustration of a ladder extending upwards into clouds from a structure, representing the ladder of abstraction.

Controlling Time

Above, we watched the system evolve in real time. A realtime view is useful for getting a direct, visceral sense of a system's behavior, especially for systems that are meant to be experienced by humans, such as visual effects.

However, real time is also quite limiting. Imagine a film editor who has to watch the entire film from the beginning with every edit, and cannot even pause or rewind. That would be absurd. Yet, most of our interactive systems are designed in this fashion.

To understand a system, we must be able to explore it. To explore, we must be able to move freely, under our own control.

Mouse over the slider at the right to control time explicitly. Notice that we can easily simulate realtime playback simply by moving the mouse over the slider at a steady rate. But we also have the ability to quickly skim over it, or stop at interesting events and examine them carefully, or quickly jump between interesting events and compare them.

A designer needs direct, interactive control over the independent variables of the system. We must not be slaves to real time.

Controlling the Algorithm

In this algorithm, the car turns at a rate of 2° per step. Why 2°? Because we needed to choose some value, and with no understanding of the system's behavior yet, we made a wild guess.

Wild guesses are okay! We need to start somewhere. But we also need a

An interactive element with a horizontal slider labeled "STEP 190" and instructions:

  • At each step: Move forward 1 pixel.
  • If left of the road, turn right by 2°.
  • If right of the road, turn left by 2°.

Below the instructions, a red car is shown on a winding road with two hills.

Abstracting Over Time

We've put our variables under interactive control, but it's difficult to get a clear sense of how the parameter affects the car's motion. We need a broader view.

Imagine looking for parking in a busy city, winding up and down the streets, hoping you'll chance upon an empty spot. Now imagine looking from a helicopter above the city. You'd instantly see every spot available! On the ground, you are limited to seeing a single street at any moment. From the air, you can see every street at once.

Likewise, our representation above, at any given moment, only depicts the system at one particular time. But we can go higher, and concoct a representation that statically depicts the system across all time.

Here, instead of showing the car, we show the car's entire trajectory. Mouse over the slider, and notice how much easier it is to see patterns. For instance, the system exhibits severe oscillation for turning rates between 1˚ and 2˚, and that oscillation appears to 'tighten' around the road as the parameter approaches 2˚. This pattern is difficult to notice from the ground.

There is no longer a time control – the function of the slider (to vary time) has been absorbed into the static visual representation. This picture represents the system for all time, not one particular time. We say that we have abstracted over time.

The representation in the previous section was fully concrete – the picture was drawn with every variable having a single, specific value. The representation here is abstract – it depicts the system for any value of the time variable.

At each step:

  • Move forward 1 pixel.
  • If left of the road, turn right by 3.0˚.
  • If right of the road, turn left by 3.0˚.
An interactive slider control is set to 3.0 degrees. Below it, a winding, two-lane road with yellow shoulder lines and white dashed lane markers is depicted. A red line representing a car's trajectory is shown oscillating around the road, staying within its boundaries, with the oscillations appearing tighter around the road at certain curves.

called "Monte-Carlo analysis".

However, it's difficult to deliberately explore a random space that doesn't offer well-defined dimensions to move in. In designing this algorithm, we want to understand why it behaves as it does for various data. It's thus very helpful for our data to have parameters that we can control, and thereby explain.

An arbitrary road could look like almost anything. In order to tame this data space, we choose some aspect of the road which we suspect is significant - an aspect that reflects some challenge that our algorithm will face. Our algorithm is currently built around a fixed turning rate which determines how sharply the car turns. We might therefore suspect that the sharpness of the bend in the road will play an important role.

Here, we have called out the bend angle as an explicit parameter of the data. Mouse over the lower slider to bend the road.

*This is not necessarily the case for all algorithms. For some algorithms, we don't expect to understand why or how they work. Machine-learning and genetic algorithms, in particular, might design their own rules and associations which we never actually see. (These algorithms obviously present their own challenges for designers.) This essay considers systems whose behavior emerges from human-authored rules, and thus human understanding is an essential part of the design process.

Note that we're down on the first rung of the ladder now - we've only abstracted over time at this point. We've controlled the data (the bend angle) and controlled the algorithm (the turning rate), but at any given moment, the static representation only depicts one particular bend and one particular turning rate.

Play with these parameters for a bit, and see what you notice. Can you find situations where the car gets so confused that it starts going the wrong way?

Crank up the bend to 75° or so, and notice that there really is no turning rate that yields reasonable behavior. Any turning rate sharp enough to make it around the bend leads to large oscillations on the straightaway. Clearly our algorithm will have to be adaptive in some way. Our insights here will inform our design decisions later on.

Now that we are able to adjust the road, we can dig into our hypothesis

At each step:

  • Move forward 1 pixel.
  • If left of the road, turn right by 2.0°.
  • If right of the road, turn left by 2.0°.

Road bends at 48°.

An interactive user interface element with sliders allows adjustment of car movement parameters and road curvature. Below this, a diagram displays a winding road with yellow lane markings and red circles indicating points of interest or curvature along the path.

warped trajectories on the "unbent" road, by driving the car along the bent road above it, and comparing how the marker moves.

Notice how the interaction ties together the abstract representations, as well as provides steps down to the more concrete representations.

Three Steps Up

The higher we climb, the broader our view of the system, and the more high-level patterns we can notice. Here is a third-level abstraction – a representation of the system for all time, all turning rates, and all bend angles. The color represents the time to completion, from red (fast) to black (mid-range) to white (slow).

We’re pretty far up in the clouds now – this representation bears no resemblance to the motion of a car, and omits most lower-level details. But as you should expect, those details are available by interactively stepping down.

  • Mouse over the chart to step down two levels, and see the trajectory for that particular turning rate and bend angle. Look for pixels whose color is conspicuously different from their neighbors, and try to figure out why they stand out.
  • Mouse over the y-axis to step down just one level, and see trajectories for that particular turning rate.
  • Mouse over the x-axis to step down one level, and see trajectories for that particular bend angle.

Each abstraction from earlier can be seen as a slice of this third-level abstraction.

A heatmap-like chart displays turning rate on the y-axis (1 to 10 degrees) and bend angle on the x-axis (0 to 90 degrees). The chart uses a color gradient from red to black to white to indicate "time to completion." A mouse cursor hovers over a region of the chart where colors transition from darker (red/black) to lighter (white) values.

Below the chart, a diagram shows a winding road with a yellow line representing a car's trajectory. A caption below the diagram reads: "Car turns by 4.3° per step. Road bends by 55°."

Collective dynamics of 'small-world' networks

Duncan J. Watts* & Steven H. Strogatz

Department of Theoretical and Applied Mechanics, Kimball Hall, Cornell University, Ithaca, New York 14853, USA

ABSTRACT

Networks of coupled dynamical systems have been used to model biological oscillators, Josephson junction arrays, excitable media, neural networks, spatial games, genetic control networks and many other self-organizing systems. Ordinarily, the connection topology is assumed to be either completely regular or completely random. But many biological, technological and social networks lie somewhere between these two extremes.

Here we explore simple models of networks that can be tuned through this middle ground: regular networks 'rewired' to introduce increasing amounts of disorder. We find that these systems can be highly clustered, like regular lattices, yet have small characteristic path lengths, like random graphs. We call them 'small-world networks', by analogy with the small-world phenomenon (popularly known as six degrees of separation). The neural network of the worm Caenorhabditis elegans, the power grid of the western United States, and the collaboration graph of film actors are shown to be small-world networks.

Models of dynamical systems with small-world coupling display enhanced signal-propagation speed, computational power, and synchronizability. In particular, infectious diseases spread more easily in small-world networks than in regular lattices.

ALGORITHM

To interpolate between regular and random networks, we consider the following random rewiring procedure.

We start with a ring of n vertices

where each vertex is connected to its k nearest neighbors

We choose a vertex, and the edge to its nearest clockwise neighbour.

With probability p, we reconnect this edge to a vertex chosen uniformly at random over the entire ring, with duplicate edges forbidden. Otherwise, we leave the edge in place.

We repeat this process by moving clockwise around the ring, considering each vertex in turn until one lap is completed.

Next, we consider the edges that connect vertices to their second-nearest neighbours clockwise.

As before, we randomly rewire each of these edges with probability p.

We continue this process, circulating around the ring and proceeding outward to more distant neighbours after each lap, until each original edge has been considered once. As there are nk/2 edges in the entire graph, the rewiring process stops after k/2 laps.

For p = 0, the ring is unchanged.

As p increases, the graph becomes increasingly disordered.

At p = 1, all edges are re-wired randomly.

A series of ten diagrams illustrates the Watts-Strogatz small-world network model. The first row of five diagrams shows the initial setup and the first rewiring step: starting with a ring of 12 vertices (n=12), each connected to its 4 nearest neighbors (k=4). An edge to a nearest clockwise neighbor is selected. With probability 'p', this edge is reconnected to a randomly chosen vertex; otherwise, it remains in place. This process is repeated clockwise around the ring. The second row of five diagrams continues the process: considering edges to second-nearest neighbors and rewiring them with probability 'p'. The last three diagrams visually represent the effect of the probability 'p': for p=0, the network remains a regular ring; as p increases, the network becomes increasingly disordered; and for p=1, all edges are randomly rewired.

ALGORITHM To interpolate between regular and random networks, we consider the following random rewiring procedure.

  • We start with a ring of n vertices
    n=12
  • where each vertex is connected to its k nearest neighbors
    k=4
  • like so.
  • We choose a vertex, and the edge to its nearest clockwise neighbour.
  • With probability p, we reconnect this edge to a vertex chosen uniformly at random over the entire ring, with duplicate edges forbidden. Otherwise, we leave the edge in place.
  • We repeat this process by moving clockwise around the ring, considering each vertex in turn until one lap is completed.
  • Next, we consider the edges that connect vertices to their second-nearest neighbours clockwise.
  • As before, we randomly rewire each of these edges with probability p.
  • We continue this process, circulating around the ring and proceeding outward to more distant neighbours after each lap, until each original edge has been considered once.
  • For p=0, the ring is unchanged.
  • As p increases, the graph becomes increasingly disordered.
    p=0.15
  • At p=1, all edges are re-wired randomly.

This construction allows us to 'tune' the graph between regularity (p = 0) and disorder (p = 1), and thereby to probe the intermediate region 0 < p < 1.

METRICS We quantify the structural properties of these graphs by their characteristic path length L(p) and clustering coefficient C(p).

L(p) measures the typical separation between two vertices (a global property). C(p) measures the cliquishness of a typical neighbourhood (a local property).

  • L is defined as the number of edges in the shortest path between two vertices
    averaged over all pairs of vertices.
    • shortest path = 1 edge
    • shortest path = 3 edges
  • C is defined as follows. Suppose a vertex v has kv neighbours.
    kv = 4 neighbours
  • Then at most kv(kv - 1)/2 edges can exist between them. (This occurs when every neighbor of v is connected to every other neighbour of v.)
    at most 6 edges between 4 neighbours
  • Let Cv denote the fraction of these allowable edges that actually exist. Define C as the average of Cv over all vertices.
    4 out of 6 edges exist Cv = 4/6 = 0.67

For friendship networks, these statistics have intuitive meanings: L is the average number of friendships in the shortest chain connecting two people, and thus C measures the cliquishness of a typical friendship circle.

SMALL WORLDS

  • The regular lattice at p = 0 is a highly clustered, large world where L grows linearly with n.
  • The random network at p = 1 is a poorly clustered, small world where L grows only logarithmically with n.
  • These limiting cases might lead one to suspect that large C is always associated with large L, and small C with small L. On the contrary, we find that there is a broad interval of p over which L(p) is almost as small as Lrandom yet Cp >> Crandom.

Diagrams illustrating a network rewiring procedure. The first row shows: 1. A circle of 12 vertices. 2. Each vertex connected to its 4 nearest neighbors (a regular lattice). 3. A similar regular lattice emphasizing connections. 4. A regular lattice with one vertex and one clockwise edge highlighted. 5. The highlighted edge rewired to a random vertex, shown with a dashed line. 6. A regular lattice with a slider indicating progress around the ring.

The second row shows: 1. A regular lattice with one vertex and an edge to its second-nearest clockwise neighbor highlighted. 2. The second-nearest neighbor edge rewired to a random vertex. 3. (No diagram) 4. A perfectly regular lattice (p=0). 5. A graph with some rewired edges, showing increased disorder (p=0.15). 6. A graph with all edges rewired randomly (p=1).

Diagrams illustrating path length and clustering coefficient. Under L(p): 1. Two nodes connected by a single edge (shortest path = 1 edge). 2. Two nodes connected by a path of three edges (shortest path = 3 edges). Under C(p): 1. A central red node connected to 4 other nodes. 2. A central red node connected to 4 other nodes, with all 6 possible edges existing between the 4 surrounding nodes. 3. A central red node connected to 4 other nodes, with 4 out of the 6 possible edges existing between the 4 surrounding nodes.

1. Reactive Documents

Ten Brighter Ideas was my early prototype of a reactive document. The reader can play with the premise and assumptions of various claims, and see the consequences update immediately. It’s like a spreadsheet without the spreadsheet. Give it a try.

Here is a more simplistic example of the same concept.

Proposition 21: Vehicle License Fee for State Parks

The way it is now:
California has 278 state parks, including state beaches and historic parks. The current $400 million budget is insufficient to maintain these parks, and 150 parks will be shut down at least part-time. Most parks charge $12 per vehicle for admission.

What Prop 21 would do:
Proposes to charge car owners an extra $18 on their annual registration bill, to go into the state park fund. Cars that pay the charge would have free park admission.

Analysis:
Suppose that an extra $26 was charged to 100% of California taxpayers. Park admission would be free for those who paid the charge.

This would collect an extra $283 million ($355 million from the tax, minus $72 million lost revenue from admission) for a total state park budget of $683 million. This is sufficient to maintain the parks and fund a program to bring safety and cleanliness up to acceptable standards.

Park attendance would rise by 35%, to 101 million visits each year.

Is this a good proposition? It’s hard to evaluate without context. The active reader might wonder, “Why $18? What if the tax were more or less?” Or, “Could park admission be raised instead?” If we were reading this on paper, such questions could only be answered by a phone call or heavy research.

This proposition was real, but the analysis is made up for this example, and is probably wildly inaccurate.

An icon showing two stylized industrial cooling towers or smokestacks, emitting smoke or steam.

2. Explorable Examples

The following is a typical description of a digital filter, as you might find in a typical textbook.

Below is a simplified digital adaptation of the analog state variable filter

The coefficients and transfer function are:

kf = 0.764 kq = 0.231

H(z) = 0.083 / (1 - 1.243z-1 - 0.824z-2)

Some example frequency responses:

  • Fc = 5.3 KHz, Q = 4.54
  • Fc = 1.2 KHz, Q = 3.5

Our author was kind enough to provide a couple of examples - many authors would consider the

A block diagram illustrates the simplified digital adaptation of an analog state variable filter with connections, summation points, and a delay element (z^-1). Next to it, an output waveform shows a decaying oscillation after an initial step input. Below this, a circular pole-zero plot shows two poles inside the unit circle. Further down are two graphs illustrating frequency responses, each showing a resonant peak, characteristic of a band-pass filter. The left graph peaks at 5.3 KHz and the right at 1.2 KHz.

3. Contextual Information

As much as we might wish authors to write explorable explanations, many won't. And even authors with good intentions can't predict everything that the reader will want to explore. And some authors, again, don't have good intentions. So, let's ask:

How do we make existing documents explorable? How can active readers ask questions and question assumptions while reading normal text?

For one simple example, consider the following passage that you might find on a typical advocacy site:

Renewable Energy In California

California leads the nation in installed wind generation capacity. Over a third of the

3. Contextual Information

As much as we might wish authors to write explorable explanations, many won't. And even authors with good intentions can't predict everything that the reader will want to explore. And some authors, again, don't have good intentions. So, let's ask:

How do we make existing documents explorable? How can active readers ask questions and question assumptions while reading normal text?

For one simple example, consider the following passage that you might find on a typical advocacy site:

Renewable Energy In California

California leads the nation in installed wind generation capacity.

tangle

explorable explanations made easy

Tangle is a JavaScript library for creating reactive documents. Your readers can interactively explore possibilities, play with parameters, and see the document update immediately. Tangle is super-simple and easy to learn.

This is a simple reactive document.

When you eat 6 cookies, you consume 300 calories.

This is the HTML for that example.

When you eat <span data-var="cookies" class="TKAdjustableNumber">cookies</span>,
you consume <span data-var="calories">calories</span>.

And this is the JavaScript.

var tangle = new Tangle(document, {
    initialize: function () { this.cookies = 3; },
    update: function () { this.calories = this.cookies * 50; }
});

Write your document with HTML and CSS, as you normally would. Use special HTML attributes to indicate variables. Write a little JavaScript to specify how your variables are calculated. Tangle ties it all together.

Screenshot of a web page demonstrating the "Tangle" JavaScript library for creating reactive documents. It displays an interactive text example about cookies and calories, followed by the corresponding HTML and JavaScript code that enables its reactivity.

Ten Brighter Ideas

  1. Conservation is key and simply achieved. Start by
    • turning off lights
    • unplugging electrical equipment when not in use
  2. If every U.S. household installed just one compact fluorescent light bulb, it would displace the electricity provided by one nuclear reactor. 1=1!

    Twenty compact fluorescents in every household would displace the need for at least 25% of all U.S. reactors.

  3. Updating heating, lighting, cooling and other electrical appliances with energy-efficient models can
    • save more energy than all operating U.S. reactors produce annually
    • reduce home electricity use by at least 20%.
  4. Energy efficiency is the cheapest and fastest way to reduce carbon emissions.

    It is at least seven times more cost-effective at displacing carbon than nuclear power.

  5. Homeowners and renters alike can choose to buy green power instead of nuclear-generated electricity. Check with your electric utility to find out how.

Premise

Suppose 40% of US households always turned off lights in unoccupied rooms.

Result

This would save 19.7 TWh per year.

Context

  • This is the output of 2.6 nuclear reactors. or 2.5% of the 104 US nuclear reactors.
  • This is the output of 16.1 coal plants. or 1.1% of the 1445 US coal plants.
  • This is 19% of US residential lighting energy.
  • This is 1.5% of US residential electricity consumption.
  • This is 0.5% of US total electricity consumption.
A series of icons illustrate the context points: nuclear power plant symbols, coal power plant symbols, a lightbulb, a house, and a map of the United States.
a[n+1] = a[n] + 0.10
Screenshot of a custom coding environment displaying the equation "a[n+1] = a[n] + 0.10" within an input field, with a timeline and search bar control above it.

Parameters displayed: Δt = 126.00 / 60.00 Hz, Q. a < 0

a[t+1] &leftarrow; a[t] + 0.05 * b[t]
b[t+1] &leftarrow; b[t] - 0.05 * a[t+1]
c[t+1] &leftarrow; cond(a[t+1] > 0, 1, -1)
d[t+1] &leftarrow; d[t] + 0.03 * c[t+1]
Screenshot of a visual programming environment displaying four mathematical equations that update variables over time. To the right of each equation, a corresponding waveform visually represents its output. A yellow line connects the first equation's output to a time parameter labeled 'Δt = 126.00 / 60.00 Hz'.

Δn = 73.00 f = 604.11 Hz

a[n+1] = a[n] + 0.086 * b[n]
b[n+1] = b[n] - 0.086 * a[n+1]
c[n+1] = cond(a[n] > 0, 1, -1)
d[n+1] = d[n] + 0.03 * c[n]
Screenshot of a coding environment or waveform visualization tool. It displays a small line graph with a diagonal line at the top. Below this, four equations are shown defining a system, adjacent to four rows of animated waveforms. The waveforms have associated mean values: -0.00, 0.00, -0.01, and -0.02.
//
function drawTree () {
  var blossomPoints = [];

  resetRandom();
  drawBranches(0, Math.PI/2, canvasWidth/2, canvasHeight, 30, ...);
  drawBlossoms(blossomPoints);
}

function drawBranches (i,angle,x,y,width,blossomPoints) {
  ctx.save();
  var length = tween(i, 20, 12, 3) + random(0.7, 1.3);
  if (i > 8) { length = 0; }

  ctx.translate(x,y);
  ctx.rotate(angle);
  ctx.fillStyle = "#000";
  ctx.fillRect(-width/2, length, width);
  ctx.restore();

  var tipX = x + (length - width/2) * Math.cos(angle);
  var tipY = y + (length - width/2) * Math.sin(angle);

  if (i > 4) {
    blossomPoints.push({x,y,tipX,tipY});
  }

  if (i < 8) {
    drawBranches(i + 1, angle + random(-0.15, -0.05) * Math...);
    drawBranches(i + 1, angle + random(0.15, 0.05) * Math...);
  }

  else if (i > 12) {
    drawBranches(i + 1, angle + random(0.25, -0.05) * Math...);
A split-screen view showing a code editor on the right and the graphical output of the code on the left. The left side displays a stylized image of a tree with a dark trunk and lush pink blossoms, set against a light blue sky and green rolling hills. The right side shows JavaScript code defining functions like `drawTree` and `drawBranches`, which likely generate the tree illustration. A horizontal dark gray bar with a light gray slider is positioned over a line of code, highlighting the `tween` function parameters.
function drawScene(canvas) {
	ctx = canvas.getContext("2d");
	extendCanvasContext(ctx);

	canvasWidth = parseInt(canvas.getAttribute("width"));
	canvasHeight = parseInt(canvas.getAttribute("height"));

	drawSky();
	drawMountains();
	drawTree();
}

// sky
function drawSky() {
	ctx.save();

	var gradient = ctx.createLinearGradient(0,0,0,canvasHeight);
	gradient.addColorStop(0, "#80b0ff");
	gradient.addColorStop(1, "#a0f0ff");

	ctx.fillStyle = gradient;
	ctx.fillRect(0,0,canvasWidth,canvasHeight);

	ctx.fillCircle(110, 50, 100);
}
// mountains
A split-screen view showing a code editor on the right and its graphical output on the left. The left side displays a stylized drawing of a cherry blossom tree with pink foliage, green mountains in the background, a light blue sky, and a large black circle in the upper left corner. The right side shows JavaScript code for drawing this scene, specifically defining functions like `drawScene` and `drawSky`, which sets a gradient background and draws a circle.
function drawScene (canvas) {
    ctx = canvas.getContext("2d");
    extendCanvasContext(ctx);

    canvasWidth = parseInt(canvas.getAttribute("width"));
    canvasHeight = parseInt(canvas.getAttribute("height"));

    drawSky();
    drawMountains();
    drawTree();
}

//
// sky
//
function drawSky () {
    ctx.save();

    var gradient = ctx.createLinearGradient(0,0,canvasWidth,canvasHeight);
    gradient.addColorStop(0, "#b4e0fe");
    gradient.addColorStop(1, "#2d3f8f");

    ctx.fillStyle = gradient;
    ctx.fillRect(0,0,canvasWidth,canvasHeight);

    ctx.restore();
    ctx.fillCircle(386, 116, 70);
}
//
// mountains
//
A split screen showing a code editor on the right and the visual output of the code on the left. The left side displays a stylized landscape illustration with a black cherry blossom tree covered in pink flowers, light blue mountains in the background, a light blue sky, and a solid black circle representing the sun or moon.
//
// scene
//
var ctx, canvasWidth, canvasHeight;

function drawScene(canvas) {
  ctx = canvas.getContext("2d");
  extendCanvasContext(ctx);

  canvasWidth = parseInt(canvas.getAttribute("width"));
  canvasHeight = parseInt(canvas.getAttribute("height"));

  drawSky();
  drawMountains();
  drawTree();
}

//
// sky
//
function drawSky() {
  ctx.save();

  var gradient = ctx.createLinearGradient(0, 0, 0, canvasHeight);
  gradient.addColorStop(0, "#b4e0fe");
  gradient.addColorStop(1, "#ad3f8ff");

  ctx.fillStyle = gradient;
  ctx.fillRect(0, 0, canvasWidth, canvasHeight);

  ctx.restore();
  ctx.fillStyle = "#ecff6a";
}
A split-screen view showing a code editor on the right and its visual output on the left. The left panel displays a vibrant illustration of a cherry blossom tree with pink flowers, a black trunk, and red ground/mountains under a blue sky with a yellow sun. The right panel shows JavaScript code defining functions like `drawScene` and `drawSky`, which correspond to elements in the illustration. A magnifying glass icon hovers over the `drawMountains()` line in the code.

this.yVelocity = -25;
}

this.yVelocity += 100 * dt;
this.y += this.yVelocity * dt;

var hitInfo = this.hitTest();
if (hitInfo.bumpedY == this.y) {
  this.jumping = (hitInfo.bumpedY != this.y);
  if (hitInfo.bumpedY != this.y) {
    this.yVelocity = 0;
  }
}

this.x = hitInfo.bumpedX;
this.y = hitInfo.bumpedY;

this.running = (this.x != oldX) && !this.jumping;
this.facingLeft = (this.x < oldX) || (this.x == oldX && this.facingLeft);

if (hitInfo.hitObject) {
  this.yVelocity = 100;
  hitInfo.hitObject.stomp();
}

if (this.y < -40 || this.y > 40) {
  this.initialize();
}

};

// GameEnemy
// GameEnemy
var GameEnemy = new Class({
  Extends: GameObject,
  

An interactive slider is shown adjusting the value `100` within the line `this.yVelocity = 100;`.

A split screenshot showing a 2D platformer game on the left and a code editor on the right. The game features a small green turtle-like character on a platform over water, with a red character in mid-air performing a high jump, leaving a dotted trajectory behind it. A glowing yellow star is on a higher platform to the right. The code editor displays JavaScript code related to game physics and character movement. In the code, a horizontal slider highlights and modifies the numerical value '100' in a line of code setting 'this.yVelocity'.
  • 70k
  • 1.2k
  • 22uF
An electronic circuit diagram for a two-stage oscillator, likely an astable multivibrator. It features two NPN transistors, two LEDs with light emission arrows, two 70k resistors, two 1.2k resistors, and three capacitors (one labeled 22uF). The circuit shows connections to a positive power supply (upward triangles) and ground (inverted triangles).
A screenshot of a graphical programming environment within a macOS application window. The interface displays interconnected electronic components, including two capacitors labeled '22uF', multiple resistors with values like '29k', '70k', and '1.2k', and two transistor symbols. Associated with these components are visual representations of waveforms, some appearing as regular pulses and others as triangular or sawtooth patterns, illustrating a circuit simulation or signal processing application.
Screenshot of a graphical user interface showing a horizontal sequence of colored blocks and waveforms, likely representing a timeline or code execution environment, with numerical labels such as 29k, 22uF, 4.0k, 70k, and 1.2k.

Interface: Visual Programming Environment

Behaviors

  • ignore target
  • track target
  • chase target
  • spring toward target
  • bubble
  • rise

Shapes

Actions

  • scale
  • rotate
  • behave
  • record
  • delete

Examples

Example 1

On each frame...

  • draw line from self to target
  • scale line by 50%

Screenshot of a visual programming environment's user interface. A left panel lists controls under "Behaviors," "Shapes," and "Actions." The "Shapes" section shows icons for a pen/line, a square, and a circle. The main content area demonstrates a black fish object interacting with a black star target object. Small example frames illustrate a sequence: a fish, then the fish drawing a turquoise line to the star, and finally the line scaled down. A larger frame below shows the fish with a shorter turquoise line connected to the star, demonstrating the "scale line by 50%" action.

Chase Target Application Interface

Screenshot of an application interface demonstrating object behaviors. A left panel lists "Behaviors," "Shapes" (with drawing tools), and "Actions," with "chase target" selected under Behaviors. The main area displays a white canvas with a black fish and a black star. A smaller preview at the top right shows "Example 1" with the fish and star on a light blue background.

Spring Toward Target

Screenshot of an interactive visual programming or simulation environment. The interface features a left panel with sections for "Behaviors" (listing options like ignore target, track target, and the highlighted 'spring toward target'), "Shapes" (with icons for pen, square, and circle), and "Actions" (including scale, rotate, behave, record, and delete). The top-center section displays "Examples" as a sequence of five small frames, each illustrating a step in the 'spring toward target' behavior using a fish and a star, with descriptions like "end of velocity" and "scale line by 13%". The main canvas shows a larger black fish with a red and blue line segment extending from its head towards a black star, with the text "scale line by 13%" displayed above the canvas.

Interactive Programming Environment for Defining Object Behaviors

Screenshot of an application interface demonstrating object behaviors. On the left, a control panel with sections for 'Behaviors' (including 'spring toward target' highlighted), 'Shapes', and 'Actions'. On the right, a white canvas shows a black fish shape and a black star shape, with the star appearing to interact with the fish. A small preview window in the top left of the canvas shows a fish against a lighter background.

Predator/Prey Relationship

In an ecosystem, predators and prey often have population cycles that are inversely related. This simulation lets you explore these dynamics. The variables here change for the predator and prey populations relative to their optimal environment.

A diagram illustrates a predator/prey relationship, featuring two dark gray rectangular boxes. The left box, labeled "prey population", and the right box, labeled "predator population", each contain a white wavy line pattern. An arrow points from the prey population box to the predator population box. Below this, a line graph with a dark background displays two oscillating curves, one light gray for "predators" and one white for "prey", showing population cycles over time. In the bottom right corner, a black square contains a white, irregular, roughly circular outline. A small white icon, resembling a lamp or a tool, is visible in the top left corner of the slide.

Predator/Prey Relationship

The populations of a predator and its prey are dependent on one another in a cyclical population growth. Prey overfeed the prey and the prey population shrinks. This decreases then starve and their population shrinks, allowing the prey population to grow back.

A diagram illustrating the Predator/Prey Relationship with population curves over time. Two smaller line graphs are at the top, side-by-side. The left graph shows multiple yellow population curves and is labeled "predators". The right graph shows multiple yellow population curves and is labeled "pigs prey". Below these, a large line graph displays a longer series of oscillating yellow population curves, representing a cyclical population relationship over 16 years, with the left y-axis labeled "predators".

Changing an Array

let blu = Graphic(image: ⚾️)
let theOrigin = Point(x: 0, y: 0)
scene.place(blu, at: theOrigin)

var images = [⚽️, 🟢, ⚾️, 🟠, 🏈]
let rugbyBall = 🏈

var position = theOrigin

// Insert and remove items.
images.insert(rugbyBall, at: 1)
images.remove(at: 4)

// Place images.
for image in images {
	var graphic = Graphic(image: image)
	position.x += 75
	position.y += 75
	scene.place(graphic, at: position)
}
Screenshot of an iPad showing a Swift Playgrounds-like environment. The left pane displays Swift code that manipulates an array of images. The right pane shows a 2D interactive canvas with a blue teardrop-shaped character at the origin (0,0) and a series of sports balls (soccer ball, green circle, baseball, orange circle, American football, basketball) arranged diagonally upwards and to the right, illustrating their positions on an X-Y coordinate system with labeled axes and grid lines. A "Run My Code" button is visible at the bottom of the right pane.

The ongoing ladder of abstraction, which allows humans to confer with computers more intuitively and more deeply

  • MoaD
  • Sketchpad
  • APL
  • Bret Victor
  • Chris Latter
  • We are here
A diagram depicting an ascending ladder or series of steps, with each step labeled to represent a stage of abstraction in human-computer interaction. The steps are labeled from bottom to top: MoaD, Sketchpad, APL, Bret Victor, Chris Latter, and finally "We are here" at the top.
“The fullest representations of humanity show people to be curious, vital, and self-motivated. At their best, they are agentic and inspired, striving to learn; extend themselves; master new skills; and apply their talents responsibly.”

Seek to augment human creativity, not to replace it.

In the past, we have been writing letters to rather than conferring with our computers (1963)

Notes on a book of Thought

  • The mouse
  • Hypertext approach
  • On-line conferencing
  • Joint development
  • NLS (oN-Line System)
  • Visual programming
  • Content addressing
  • Remote collaboration
  • Connecting the display
The fullest representations of humanity show people to be curious, vital, and self-motivated. At their best, they are agents and inspired, striving to learn, extend themselves, master new skills, and apply their talents responsibly.
A collage of faded historical images and text snippets related to computing and human-computer interaction provides a background to the main statement.

Why I love SolveIt

June 03, 2026

SolveIt Close reading Personalised learning

  • “SolveIt responses are concise.”
  • “I almost always use Learning mode. It can feel like coding with training wheels on, but training wheels with resistance. It drags you back, forces you to think about what you are doing.”
  • “The ability to edit previous message history is, for me, the most important feature... The context repairs itself. This alone changes how I work.”
  • “Over a long dialog this builds into something where the context is so aligned with your thinking that the conversation starts to flow as if from a single mind rather than human and LLM.

Why I love SolveIt

June 03, 2026

SolveIt Close reading Personalised learning
  • “SolveIt responses are concise.”
  • “I almost always use Learning mode: It can feel like coding with training wheels on, but also ... resistance. It drags you back, forces you to think about what you are doing.”
  • “The ability to edit previous message history is, for me, the most important feature... The context repairs itself. This alone changes how I work.”
  • “Over a long dialog this builds into something where the context is so aligned with your thinking that the conversation starts to flow as if from a single mind rather than human and LLM.”

Screenshot of a blog post interface from "Chris Thomas's Blog". The article is titled "Why I love SolveIt" and lists reasons for using the tool. A macOS dock displaying app icons (PowerPoint, Google Chrome, Vivaldi, iTerm, Finder) partially covers some of the article's text.

Recursive Language Models

  • Alex L. Zhang MIT CSAIL altzhang@mit.edu
  • Tim Kraska MIT CSAIL kraska@mit.edu
  • Omar Khattab MIT CSAIL okhattab@mit.edu

Abstract

We study allowing large language models (LLMs) to process arbitrarily long prompts through the lens of inference-time scaling. We propose Recursive Language Models (RLMs), a general inference strategy that treats long prompts as part of an external environment and allows the LLM to programmatically examine, decompose, and recursively call itself over snippets of the prompt. We find that RLMs successfully handle inputs up to two orders of magnitude beyond model context windows and, even for shorter prompts, dramatically outperform the quality of base LLMs and

Recursive Language Models

Screenshot of a web application displaying a document titled 'Recursive Language Models', with sections for authors and an abstract, and an interactive input area labeled 'Code', 'Note', 'Prompt', and 'Raw'.

Recursive Language Models

Screenshot of the Solveit web application interface.

solve.it/dashboard

  • 10. Dashboard - solve.it.com/dashboard
  • 3. Solve It With Code - solve.it.com
  • 6. SolveIt - Billing - solve.it.com/billing
  • solve - Google Search
  • AnswerDotAI/solve-lp: The landing page + auth app for the solve it course github.com/AnswerDotAI/solve-lp
  • SolveIt - vanilla-symbol-pulls-u1y.solve.it.com
  • SolveIt - localhost:5001/?at=aai-ws%2Fsolveit%2Fnbs&folder;=aai-ws%2Fsolveit&content;=
  • 6. SolveIt - ribs + fastlim aai-ws - localhost:5001/?at=aai-ws%2Ffastlim%2Fnbs
A screenshot of a Chrome web browser window. The address bar displays "solve.it/dashboard" and an autocomplete dropdown shows a list of recent URLs and search suggestions related to "solve.it" and "AnswerDotAI/solve-lp".

solve.it.com

Screenshot of a Google Chrome browser displaying a search bar with a dropdown list of URLs and search suggestions related to 'solve.it.com'.

How To Solve It With Code

Screenshot of the SolveIt website displaying information about a course titled "How To Solve It With Code."

Recursive Language Models

Screenshot of the Solveit web application displaying a research paper titled "Recursive Language Models", including the title, authors, and abstract section.

1 Introduction

The slide presents two line graphs comparing language model performance. The first graph is titled "GPT-5" and the second "RLM(GPT-5)". Both graphs plot "Score (%)" on the y-axis against "Input Context Length (log scale)" on the x-axis, with values ranging from 8k to 1M.

The lines represent performance metrics: "S-NIAH", "OOLONG-Pairs", and "OOLONG".

Two line graphs illustrate language model performance across increasing input context lengths. The left graph, titled "GPT-5", shows that the S-NIAH metric maintains high scores around 90-100% up to 262k context length, then decreases to around 30% at 1M. The OOLONG and OOLONG-Pairs metrics show a sharp drop in scores, falling to near zero around 33k context length and remaining there. The region from 262k to 1M context length is highlighted in red.

The right graph, titled "RLM(GPT-5)", displays more stable performance for all three metrics. S-NIAH consistently scores around 100%. OOLONG-Pairs and OOLONG maintain scores between 40% and 80% across all context lengths shown, with a slight dip around 131k and then a recovery. The region from 262k to 1M context length is highlighted in green, indicating sustained performance for all metrics.

solveit chats/rlms/rlmreadthru

Screenshot of the 'solveit' web application displaying a line graph titled 'Input Context Length (log scale)' with data labeled 'OOLONG-Pairs', and a text box containing a detailed note on language model context and inference.

Prompt: 114

I'm doing a close read of this paper. In particular, I'll be investigating with you whether Solveit itself can be used as an RLM platform. As I read, I'll ask at the point I've read to. First, teach me about the tasks in fig 1.

Assistant: 482

Figure 1 uses three tasks chosen to span a spectrum of information density - how much of the prompt you must actually process to answer correctly, and how that scales with prompt length. That's the key axis the authors care about.

S-NIAH (Single Needle-in-a-Haystack): find one specific phrase or number buried in a large pile of unrelated text. The crucial property is that the “needle” stays the same size no matter how long the haystack gets – so the work required is roughly constant regardless of input length. Frontier models are already good at this.

OOLONG: a reasoning/aggregation task where the answer depends on nearly every line in the prompt (e.g. “classify each question by category, then tell me which category is more common”). You can’t skip anything, so the work scales linearly with input length. Much harder than NIAH at the same length.

OOLONG-Pairs: the authors' own modification of OOLONG, where the answer requires aggregating over pairs of entries (e.g. “list all pairs of users where both satisfy some property”). This makes the work scale quadratically with input length – and they deliberately designed the queries so you can’t cheat by looking at entries individually.

So the three form a neat progression: constant → linear → quadratic complexity. That’s why in Fig 1 GPT-5 holds up fine on S-NIAH but degrades...

Screenshot of a web-based chat interface named Solveit, displaying a user prompt and an assistant's detailed explanation of three tasks related to information density: S-NIAH, OOLONG, and OOLONG-Pairs.

solveit chats/rlms/rlmreadthru

Screenshot of the Solveit application interface, featuring a chat window. The interface displays a user prompt asking about tasks in "fig 1," followed by an assistant's detailed explanation of three tasks: S-NIAH (Single Needle-in-a-Haystack), OOLONG, and OOLONG-Pairs, outlining their information density and scaling complexities as constant, linear, and quadratic respectively.

Despite rapid progress in reasoning and tool use, modern language models still have limited context lengths and, even within these limits, appear to inevitably exhibit context rot (Hong et al., 2025), the phenomenon illustrated in the left-hand side of Figure 1 where the quality of even frontier models like GPT-X degrades quickly as context nets longer. Though we expect context lengths to steadily rise through improvements in training.

A screenshot of the Solveit web application interface, displaying two line graphs side-by-side and an accompanying text note within a chat-like interface.

The left graph, titled "GPT-5", plots "Score (%)" on the Y-axis against "Input Context Length (log scale)" on the X-axis (from 4k to 1M). It shows three performance curves: S-NHAH, OOLONG, and OOLONG-Pairs. The S-NHAH score remains consistently high (around 95-100%). OOLONG and OOLONG-Pairs scores start around 80-85% but drop sharply to near zero for input context lengths beyond 32k, particularly in a red-shaded region from 262k to 1M, indicating significant performance degradation.

The right graph, titled "RLM(GPT-5)", also plots "Score (%)" against "Input Context Length (log scale)". It shows S-NHAH, OOLONG-Pairs, and OOLONG performance curves. Here, S-NHAH again remains high. Both OOLONG and OOLONG-Pairs show a more gradual decline in score, maintaining scores above 40% even at 1M context length. A green-shaded region from 262k to 1M highlights this sustained performance at longer context lengths, indicating improvement over the GPT-5 model shown in the left graph.

Prompt: 114

I'm doing a close read of this paper. In particular, I'll be investigating with you whether Solveit itself can be used as an RLM platform.

As I read, I'll ask at the point I've read to.

First, teach me about the tasks in fig 1.

Assistant: 482

Figure 1 uses three tasks chosen to span a spectrum of information density — how much of the prompt you must actually process to answer correctly, and how that scales with prompt length. That’s the key axis the authors care about.

S-NIAH (Single Needle-in-a-Haystack): find one specific phrase or number buried in a large pile of unrelated text. The crucial property is that the “needle” stays the same size no matter how long the haystack gets — so the work required is roughly constant regardless of input length. Frontier models are already good at this.

OOLONG: a reasoning/aggregation task where the answer depends on nearly every line in the prompt (e.g. “classify each question by category, then tell me which category is more common”). You can’t skip anything, so the work scales linearly with input length. Much harder than NIAH at the same length.

OOLONG-Pairs: the authors’ own modification of OOLONG, where the answer requires aggregating over pairs of entries (e.g. “list all pairs of users where both satisfy some property”). This makes the work scale quadratically with input length — and they deliberately designed the queries so you can’t cheat by looking at entries individually.

So the three form a neat progression: constant → linear → quadratic complexity. That’s why in Fig 1 GPT-5 holds up fine on S-NIAH but degrades

Screenshot of a chat interface for the Solveit application, displaying a user prompt and an assistant's detailed response about three tasks related to a research paper figure.

solveit chats/rlms/rlmreadthru

Note: 113

Figure 2: A Recursive Language Model (RLM) treats prompts as part of the environment. It loads the input prompt as a variable inside a Python REPL environment E and writes code to peek into, decompose, and invoke itself recursively over programmatic snippets of the variable.

Note: 460

We introduce Recursive Language Models (RLMs), a general-purpose inference paradigm for dramatically scaling the effective input and output lengths of modern LLMs. The key insight is that long prompts should not be fed into the neural network (e.g., Transformer) directly but should instead be treated as part of the environment that the LLM can symbolically interact with.

As Figure 2 illustrates, an RLM exposes the same external interface as an LLM: it accepts a string prompt of arbitrary structure and produces a string response. Given a prompt P, the RLM initializes a Read-Eval-Print Loop (REPL) programming environment in which P is set as the value of a variable. It then offers the LLM general context about the REPL environment (e.g., the length of the string P), and permits it to write code that peeks into and decomposes P, and to iteratively observe any side effects from execution. Crucially, RLMs encourage the

Prompt: 49
Can you see figure 2?

Assistant: 467
Yes, I can see it clearly. Here's what Figure 2 depicts:

The outer box is the RLM at root / depth=0. Inside it sits a Language Model (LM) and an Environment E (the green REPL area). Critically, there's a red X on the arrow from the prompt directly into the LM — signalling that the long prompt is not fed straight into the model.

Inside the environment, the prompt is loaded as a variable, and the LM writes REPL code across turns:

  • In[1]: print(prompt[:100]) — peeking at the start of the prompt
  • Out[1]: shows the first chunk ("You are reading an extremely long book...")
  • In[2]: part1, part2 = prompt.split('Chapter 2') then pre_cata = llm_query(...) and post_cata = llm_query(...) — decomposing the prompt and recursively querying

On the right, those llm_query calls spawn RLM (depth=1) boxes — each its own Prompt + LM — which return Sub-Responses (e.g. "The river flask", "Herod's ring") back into the environment.

Finally, In[N]: print(FINAL_ANSWER) produces Out[N], and the Final Response is stitched together from the recursive sub-answers.

So the figure captures the whole loop: peek → decompose → recurse → aggregate, all driven by code in a persistent REPL.

Code Note Prompt Raw

Screenshot of a web application interface named "solveit" displaying a chat conversation. The interface has navigation tabs at the top, and in the main content area, a user asks "Can you see figure 2?". An AI Assistant's detailed response explains a recursive querying process involving a Language Model (LM) and an Environment. Below the chat, there are tabs for "Code", "Note", "Prompt", and "Raw" with the "Code" tab selected.

solveit chats/rlms/rlmreadthru

Prompt: 49
Can you see figure 2?

Assistant: 467
Yes, I can see it clearly. Here's what Figure 2 depicts:

The outer box is the RLM at root / depth=0. Inside it sits a Language Model (LM) and an Environment & (the green REPL area). Critically, there's a red X on the arrow from the prompt directly into the LM — signalling that the long prompt is not fed straight into the model.

Inside the environment, the prompt is loaded as a variable, and the LM writes REPL code across turns:

  • In[1] : print(prompt[:100]) — peaking at the start of the prompt
  • Out[1] : shows the first chunk (“You are reading an extremely long book…”)
  • In[2] : part1, part2 = prompt.split(‘Chapter 2’) then pre_cata = llm_query(...) and post_cata = llm_query(...) — decomposing the prompt and recursively querying

On the right, those llm_query calls spawn RLM (depth=1) boxes — each its own Prompt + LM — which return Sub-Responses (e.g. “The river flask”, “Herod’s ring”) back into the environment.

Finally, In[N] : print(FINAL_ANSWER) produces Out[N], and the Final Response is stitched together from the recursive sub-answers.

So the figure captures the whole loop: peek → decompose → recurse → aggregate, all driven by code in a persistent REPL.

Screenshot of an interactive AI chat interface displaying a user prompt and an assistant's detailed explanation. The interface is titled 'solveit chats/rlms/rlmreadthru' and shows a 'Prompt: 49' asking "Can you see figure 2?" followed by an 'Assistant: 467' response. The assistant's text provides a structured explanation of a process involving an RLM (Recursive Language Model) and an Environment, detailing how prompts are processed, decomposed, recursively queried using `llm_query` calls, and then aggregated into a final response.

Prompt: 133

Whilst you (SolveitAI) do have a subagent tool, I'm not sure we're going to need it to replicate this - it seems your regular tool calling in the normal loop will be sufficient to answer questions like this using just pyrun. Does that sound right? Or will recursive subagents turn out to be important?

Assistant: 540

Partly right — and the paper itself gives us the answer via its ablation. There are really two separable ideas in an RLM:

  1. Prompt-as-environment (the REPL part): load the long input as a variable, peek/filter/decompose it with code instead of reading it all into context. This maps directly onto my normal loop with pyrun. I can hold a 10M-token doc as a Python string and only ever pull small slices into my actual context.

  2. Recursive sub-calls (the fan-out part): spawn fresh LM calls over chunks to semantic work.

The crucial finding is Observation 2 + the RLM (no sub-calls) row in Table 1. The no-sub-calls ablation — which is essentially “just me + pyrun” — already scales beyond the context window and even beats the full RLM on some tasks (CodeQA, BrowseComp+). So for retrieval-ish or constant-density tasks, my regular loop should genuinely suffice.

Where subagents become important is information-dense tasks (OOLONG, OOLONG-Pairs), where the answer depends on semantically classifying every line/pair. There, the no-sub-calls version dropped 10–59%, because the root model can’t apply judgment to thousands of chunks without either (a) reading them all itself — context rot — or (b) falling back to keyword heuristics. Sub-calls let you apply LM judgment to a chunk without polluting the root context.

So my prediction: for your close-read experiments, pyrun alone will replicate the interesting part surprisingly far. Subagents will only become

Screenshot of the SolveIt AI chat interface, displaying a prompt and a detailed assistant response regarding the capabilities of large language models and subagents, specifically mentioning the tool 'pyrun'.

solveit chats/rlms/rlmreadthru

Prompt 49: Can you see figure 2?

Assistant 467: Yes, I can see it clearly. Here's what Figure 2 depicts:

  • The outer box is the RLM at root / depth=0. Inside it sits a Language Model (LM) and an Environment & (the green REPL area). Critically, there's a red X on the arrow from the prompt directly into the LM — signalling that the long prompt is not fed straight into the model.
  • Inside the environment, the prompt is loaded as a

Prompt: 133

Whilst you (SolveitAI) do have a subagent tool, I'm not sure we're going to need it to replicate this - it seems your regular tool calling in the normal loop will be sufficient to answer questions like this using just pyrun. Does that sound right? Or will recursive subagents turn out to be important?

Assistant: 540

Partly right — and the paper itself gives us the answer via its ablation. There are really two separable ideas in an RLM:

  1. Prompt-as-environment (the REPL part): load the long input as a variable, peek/filter/decompose it with code instead of reading it all into context. This maps directly onto my normal loop with pyrun. I can hold a 10M-token doc as a Python string and only ever pull small slices into my actual context.
  2. Recursive sub-calls (the fan-out part): spawn fresh LM calls over chunks to semantic work.

The crucial finding is Observation 2 + the RLM (no sub-calls) row in Table 1. The no-sub-calls ablation — which is essentially "just me + pyrun" — already scales beyond the context window and even beats the full RLM on some tasks (CodeQA, BrowseComp+). So for retrieval-ish or constant-density tasks, my regular loop should genuinely suffice.

Where subagents become important is information-dense tasks (OOLONG, OOLONG-Pairs), where the answer depends on semantically classifying every line/pair. There, the no-sub-calls version dropped 10–59%, because the root model can't apply judgment to thousands of chunks without either (a) reading them all itself — context rot — or (b) falling back to keyword heuristics. Sub-calls let you apply LM judgment to a chunk without polluting the root context.

So my prediction: for your close-read experiments, pyrun alone will replicate the interesting part surprisingly far. Subagents will only become

Screenshot of an AI chat interface named "solveit" displaying a conversation between a user prompt and an assistant's detailed response. The interface also shows tabs for Code, Note, Prompt, and Raw at the bottom, indicating an interactive environment.

solveit chats/rlms/rlmreadthru

Prompt: 133

Whilst you (SolveitAI) do have a subagent tool, I'm not sure we're going to need it to replicate this - it seems your regular tool calling in the normal loop will be sufficient to answer questions like this using just pyrun. Does that sound right? Or will recursive subagents turn out to be important?

Assistant: 540

Partly right — and the paper itself gives us the answer via its ablation. There are really two separable ideas in an RLM:

  1. Prompt-as-environment (the REPL part): load the long input as a variable, peek/filter/decompose it with code instead of reading it all into context. This maps directly onto my normal loop with pyrun. I can hold a 10M-token doc as a Python string and only ever pull small slices into my actual context.
  2. Recursive sub-calls (the fan-out part): spawn fresh LM calls over chunks to semantic work.

The crucial finding is Observation 2 + the RLM (no sub-calls) row in Table 1. The no-sub-calls ablation — which is essentially "just me + pyrun" — already scales beyond the context window and even beats the full RLM on some tasks (CodeQA, BrowseComp+). So for retrieval-ish or constant-density tasks, my regular loop should genuinely suffice.

Where subagents become important is information-dense tasks (OOLONG, OOLONG-Pairs), where the answer depends on semantically classifying every line/pair. There, the no-sub-calls version dropped 10–59%, because the root model can't apply judgment to thousands of chunks without either (a) reading them all itself — context rot — or (b) falling back to keyword heuristics. Sub-calls let you apply LM judgment to a chunk without polluting the root context.

So my prediction: for your close-read experiments, pyrun alone will replicate the interesting part surprisingly far. Subagents will only become...

Screenshot of the Solveit AI chat interface displaying a conversation between a user and an AI assistant. The interface shows a chat window with a user prompt and a detailed multi-paragraph AI response, along with navigation tabs and an input area at the bottom.

Solveit Chat: chats/rlms/rlmreadthru

Prompt 133: Whilst you (SolveitAI) do have a subagent tool, I'm not sure we're going to need it to replicate this - it seems your regular tool calling in the normal loop will be sufficient to answer questions like this using just pyrun. Does that sound right? Or will recursive subagents turn out to be important?

Assistant 540: Partly right — and the paper itself gives us the answer via its ablation. There are really two separable ideas in an RLM:

  1. Prompt-as-environment (the REPL part): load the long input as a variable, peek/filter/decompose it with code instead of reading it all into context. This maps directly onto my normal loop with pyrun. I can hold a 10M-token doc as a Python string and only ever pull small slices into my actual context.
  2. Recursive sub-calls (the fan-out part): spawn fresh LM calls over chunks to do semantic work.

The crucial finding is Observation 2 + the RLM (no sub-calls) row in Table 1. The no-sub-calls ablation — which is essentially "just me + pyrun" — already scales beyond the context window and even beats the full RLM on some tasks (CodeQA, BrowseComp+). So for retrieval-ish or constant-density tasks, my regular loop should genuinely suffice.

Where subagents become important is information-dense tasks (OOLONG, OOLONG-Pairs), where the answer depends on semantically classifying every line/pair. There, the no-sub-calls version dropped 10–59%, because the root model can't apply judgment to thousands of chunks without either (a) reading them all itself — context rot — or (b) falling back to keyword heuristics. Sub-calls let you apply LM judgment to a chunk without polluting the root context.

So my prediction: for your close-read experiments, pyrun alone will replicate the interesting part surprisingly far. Subagents will only become ...

Screenshot of the Solveit AI chat interface displaying a prompt and a detailed assistant response in a threaded conversation view.

Here are the three "recent work" citations, with links and summaries:

  1. 1. RULER - Hsieh et al., 2024 ("What's the Real Context Size of Your Long-Context Language Models?", COLM 2024)

    A synthetic benchmark that goes beyond vanilla NIAH. RULER has flexible configurations for customized sequence length and task complexity, expanding NIAH to encompass variations with diverse types and quantities of needles, and introduces new task categories — multi-hop tracing and aggregation. The headline finding: despite achieving nearly perfect accuracy in vanilla NIAH, almost all models exhibit large performance drops as context length increases; while all claim 32K+ context, only half maintain satisfactory performance at 32K. This is the source for the paper's claim that frontier models handle NIAH but struggle on harder long-context tasks.

  2. 2. Goldman et al., 2025 ("Is It Really Long Context if All You Need Is Retrieval?", EMNLP 2024)

    A position paper arguing the taxonomy point directly underpinning RLM's task design. It argues that conflating different tasks by their context length is unproductive, and proposes unpacking long-context based on the properties that make tasks harder with longer contexts. Specifically, it proposes two orthogonal axes of difficulty: (I) Diffusion — how hard is it to find the necessary information; (II) Scope — how much necessary information is there to find. They conclude that the most difficult and interesting settings, whose necessary information is very long and highly diffused, is severely under-explored. This is essentially the conceptual ancestor of the RLM paper's "information density" framing.

  3. 3. Context Rot - Hong et al., 2025 (Chroma technical report)

    The source of the term "context rot" itself. Evaluating 18 LLMs including GPT-4.1, Claude 4, Gemini 2.5, and Qwen3, they find models do not use their context uniformly; instead performance grows increasingly unreliable as input length grows. Crucially for clean measurement, their experiments hold task complexity constant while varying only input length, isolating the effect of input length alone. They show degradation even on trivial tasks — e.g. a simple word-replication task where as context length increases, performance consistently degrades across all models, with input length directly

solveit chats/rlms/rlmreadthru

A position paper arguing the taxonomy point directly underpinning RLM’s task design. It argues that conflating different tasks by their context length is unproductive, and proposes unpacking long-context based on the properties that make tasks harder with longer contexts. Specifically, it proposes two orthogonal axes of difficulty: (I) Diffusion — how hard is it to find the necessary information; (II) Scope — how much necessary information is there to find. They conclude that the most difficult and interesting settings, whose necessary information is very long and highly diffused, is severely under-explored. This is essentially the conceptual ancestor of the RLM paper’s "information density" framing.

3. Context Rot — Hong et al., 2025 (Chroma technical report)

The source of the term "context rot" itself. Evaluating 18 LLMs including GPT-4.1, Claude 4, Gemini 2.5, and Qwen3, they find models do not use their context uniformly; instead performance grows increasingly unreliable as input length grows. Crucially for clean measurement, their experiments hold task complexity constant while varying only input length, isolating the effect of input length alone. They show degradation even on trivial tasks — e.g. a simple word-replication task where as context length increases, performance consistently degrades across all models, with input length directly proportional to output length.

The through-line: all three establish that raw token count ≠ effective context, and that what the task demands (diffusion/scope, or density) matters more than length — exactly the premise the RLM paper builds on by treating the prompt as an environment to query rather than text to ingest.

Prompt: 68
Figure 1 used NIAH though, right? Would RULER have been more interesting?

Assistant: 368
Good catch — yes, Figure 1's simplest task is S-NIAH, which is essentially the vanilla NIAH that RULER was specifically built to improve upon.

a simple word-replication task where as context length increases, performance consistently degrades across all models, with input length directly proportional to output length.

The through-line: all three establish that raw token count ≠ effective context, and that what the task demands (diffusion/scope, or density) matters more than length — exactly the premise the RLM paper builds on by treating the prompt as an environment to query rather than text to ingest.

Prompt: 68

Figure 1 used NIAH though, right? Would RULER have been more interesting?

Assistant: 368

Good catch — yes, Figure 1's simplest task is S-NIAH, which is essentially the vanilla NIAH that RULER was specifically built to improve upon.

Here's the tension I see: RULER's whole contribution is that vanilla NIAH is too easy and unrepresentative — frontier models ace it even at 1M tokens. So using plain S-NIAH as the “constant complexity” anchor in Figure 1 is a slightly odd choice given they cite RULER approvingly.

But I think it's actually defensible: their Figure 1 narrative needs a task that's deliberately flat in complexity, to serve as the “easy baseline” that GPT-5 handles well. S-NIAH being trivial is the point — it shows the bottom of the difficulty spectrum (constant → linear → quadratic). RULER's harder variants (multi-hop tracing, aggregation) would muddy that clean progression because they'd introduce their own scaling behavior.

So it's less “RULER would've been more interesting” and more “they wanted the boring end of the spectrum on purpose.”

That said — there's a real question of whether OOLONG and OOLONG-Pairs alone already cover the interesting territory, making S-NIAH almost a throwaway.

Screenshot of a web application interface named 'solveit' displaying a chat discussion about research tasks like S-NIAH and RULER.

But I think it's actually defensible: their Figure 1 narrative needs a task that's deliberately flat in complexity, to serve as the "easy baseline" that GPT-5 handles well. S-NIAH being trivial is the point — it shows the bottom of the difficulty spectrum (constant → linear → quadratic). RULER's harder variants (multi-hop tracing, aggregation) would muddy that clean progression because they'd introduce their own scaling behavior. So it's less "RULER would've been more interesting" and more "they wanted the boring end of the spectrum on purpose." That said — there's a real question of whether OOLONG and OOLONG-Pairs

Prompt: 72

Oh answered my question already. :) How hard are the two new tasks mentioned here? Give me an example from each.

Assistant: 499

The two new ones here are BrowseComp-Plus and LongBench-v2 CodeQA. Both appear with real examples elsewhere in the paper:

BrowseComp-Plus (multi-hop QA, "DeepResearch" style) — moderately hard. You get ~1000 documents (millions of tokens) and must stitch evidence across several of them. The example from B.1:

"...provincial festivities in the region, where all three winners came from the same province. A beauty pageant was also a part of the celebration. What are the first and last names of the person who won that contest that year?"

You have to find the right festival, identify the province/year, then find the pageant winner — a chain of hops, with hard-negative documents deliberately mixed in to mislead.

LongBench-v2 CodeQA (code repo understanding) — hard for frontier models. You get a whole codebase (~900K tokens) and a multiple-choice question requiring you to understand how it actually works. The example from B.4 gives 4 long paragraph-length statements about a LoRA-training repo (how jobs inherit from BaseJob, how configs/.yml files work, multi-GPU support, inference via run.py...) and asks:

"...check which one is right statement? ...answer with exactly one number choice... (indexed from 0 to 3)."

So you must verify detailed claims against the real code to pick the single correct one.

Screenshot of the solveit chat interface showing a prompt and an AI assistant's response about two new research tasks: BrowseComp-Plus and LongBench-v2 CodeQA, with examples for each.

Prompt: 88

I recall a paper with datasets like "bamboozle" and "bamgoogle" or something that was designed for answering 2 hop questions - does that ring a bell?

Assistant: 338

Yes! You're thinking of Bamboogle — introduced in "Measuring and Narrowing the Compositionality Gap in Language Models" (Press et al., 2022, the Self-Ask paper).

Bamboogle is a small, hand-crafted set of 125 two-hop compositional questions, deliberately designed so that a search engine can't answer them directly (hence the playful name — questions that "bamboozle" Google). Each requires composing two facts, e.g.:

"Who was president of the U.S. when the band that sang 'Bohemian Rhapsody' was formed?"

You must hop:

  1. (1) which band sang it → Queen,
  2. (2) when were they formed → 1970,
  3. (3) who was president then → Nixon. Neither hop alone gives the answer.

The "compositionality gap" they measured: models often know each individual fact but fail to compose them — and that gap is what motivated the Self-Ask prompting method (explicitly asking and answering sub-questions before the final answer).

It's closely related conceptually to the multi-hop structure of BrowseComp-Plus we were just looking at.

Screenshot of a web application interface displaying a user prompt and an assistant's detailed response about the Bamboogle dataset and Self-Ask paper.

solveit chats/rlms/rlmreadthru learning

Prompt: 64

Maybe we should try one example of each task. Shall we start with CodeQA?

Assistant: 312

Good place to start. CodeQA is the most "Solveit-native" of the four — a big codebase loaded as a variable, with the root LM (me) slicing and recursing over it. That maps almost exactly onto what we already do here.

Before any code, let me check we agree on the setup. To run one real CodeQA example we need:

  1. The data — LongBench-v2's CodeQA split (on HuggingFace, THUDM/LongBench-v2). Each item has a context (the concatenated repo, ~23K-4.2M tokens), a question, four choices, and a gold answer.
  2. The harness — load one example's context into a Python variable, and then / play the root RLM: peek/grep/slice via pyrun, optionally spawn_agent for per-chunk semantic work, then commit to one of the 4 choices.
  3. Scoring — just check my choice against the gold answer.

Prompt: 117

I'm not trying to match the exact "loaded as a variable" thing. That's an implementation detail which I think we should aim to generalize and simplify.

Is there a way to grab a subset from HF, or do I need the whole dataset to get any of it?

Code Note Prompt Raw

1
A screenshot of a web-based chat interface application. The interface displays a conversation where a 'Prompt' initiates discussions and an 'Assistant' provides detailed responses, outlining a three-step setup for a CodeQA task. Below the conversation, there is an interactive code editor with tabs labeled 'Code', 'Note', 'Prompt', and 'Raw'.

solveit chats/rlms/rlmreadthru

4. ZIM LUKEILS, a question, four CHOICES, and a gold answer.

2. The harness – load one example’s context into a Python variable, and then / play the root RLM: peek/grep/slice via pyrun, optionally spawn_agent for per-chunk semantic work, then commit to one of the 4 choices.

3. Scoring – just check my choice against the gold answer.

Prompt: 117

I'm not trying to match the exact "loaded as a variable" thing. That's an implementation detail which I think we should aim to generalize and simplify.

Is there a way to grab a subset from HF, or do I need the whole dataset to get any of it?

Assistant: 239

You can grab just a subset – no need for the whole dataset.

The cleanest way is the HF datasets server, which lets you pull individual rows over HTTP without downloading anything. Either:

One wrinkle: LongBench-v2 is a single combined set with a domain / sub_task field rather than separate splits, so we'd filter for the code-related rows rather than asking for a "CodeQA split" directly.

A screenshot of a web application showing a conversational interface with a prompt and an assistant's response explaining how to access subsets of datasets.

solveit chats/rlms/rlmreadthru

Assistant: 239

You can grab just a subset — no need for the whole dataset.

The cleanest way is the HF datasets server, which lets you pull individual rows over HTTP without downloading anything. Either:

One wrinkle: LongBench-v2 is a single combined set with a domain / sub_task field rather than separate splits, so we'd filter for the code-related rows rather than asking for a "CodeQA split" directly.

Prompt: 53

Is it the "Code Repository Understanding" domain?

Assistant: 91

Yes — LongBench-v2 organizes tasks into six categories, and Code Repository Understanding is the one the paper's CodeQA draws from. So filtering rows where domain == "Code Repository Understanding" should isolate the CodeQA examples.

Shall I write the couple of lines to stream and grab the first such row?

A screenshot of a web-based AI assistant chat interface named "solveit", displaying a conversation about accessing and filtering datasets. The assistant provides instructions for streaming data from "THUDM/LongBench-v2" and using the HF rows API, discussing how to filter by a "Code Repository Understanding" domain. An interactive input area with tabs for "Code", "Note", "Prompt", and "Raw" is visible at the bottom.

solveit chats/rlms/rlmreadthru learning

diff at 1481986 looks like the prime candidate. Let me read its signature and body.

pyrun(code="print(ctx[1481986:1483600]))")
def diff(ctx, f, x, n=1, **options):n..."

The docstring explicitly enumerates the recognized kwargs. So far I see method, direction, addprec, relative ... let me read the rest.

pyrun(code="print(ctx[1483600:1484300]))")

Choose 'h'' relative to the magnit...

The docstring lists the full set of recognized keyword arguments: method, direction, addprec, relative, h, singular, radius.

Now checking each choice against that set:

  • A: singular ✔, addprec ✔, function
  • B: h ✔, method ✔, direction ✔ — all recognized
  • C: relative ✔, fc ✘, y
  • D: radius ✔, x ✘ (positional), step ✘ (it's a value of method, not a kwarg)

So the answer is B.

Code: 43

ans

Output:

Code Note Prompt Raw

1
Screenshot of an interactive web application interface named "solveit", showing a conversation-like interaction with code execution, text analysis, and a multiple-choice question with the correct answer highlighted.

Solveit AI Evaluation Interface

An interactive session within the Solveit chat environment, displaying a problem and an AI's response.

The problem is introduced by the command: pyrun(code="print(ctx[1483600:1484300])") with the instruction: "Choose 'h' relative to the magnit..."

The docstring lists the full set of recognized keyword arguments: method, direction, addprec, relative, h, singular, radius.

The system then checks each choice against that set:

    Output: 'B'

    Prompt: 61

    Nice! Describe the method you used to search for the info you needed.

    Assistant: 319

    My approach was a quick locateinspectverify pass:

    1. Targeted regex search for candidate functions. Rather than read 1.9M chars, I searched for `def` names matching `*diff*` or `*deriv*`, which gave ~20 candidates with their offsets.
    2. Picked the best match by name/signature. `diff(ctx, f, x, n=1, **options)` stood out — the `**options` told me the recognized kwargs would be documented or unpacked nearby.
    3. Read just that slice. I jumped straight to the byte offset and read the docstring, which happened to enumerate the kwargs under an explicit "Options" heading — `method`, `direction`, `addprec`, `relative`, `h`, `singular`, `radius`.
    4. Matched choices against that set by elimination — only B had all three as genuine kwargs.

    The key efficiency: I only ever pulled a few hundred bytes into context at a time, using regex+offsets to navigate — never loading the whole string.

    Screenshot of a web-based AI assistant interface displaying a conversation and an output.

    Moving away from Tailwind, and learning to structure my CSS

    Screenshot of the Solveit web application displaying an article.

    Moving away from Tailwind, and learning to structure my CSS

    When I started thinking about structuring CSS, I was intimidated at first: I'm not very good at structuring my CSS! But then I started reading blog posts talking about how to structure CSS (like A whole cascade of layers or How I write CSS in 2024) and I realized a couple of things:

    1. Every CSS code base has a bunch of different things going on (layouts! fonts! colours! common components!)
    2. It's extremely useful to have systems or guidelines to manage each of those things, otherwise things descend into chaos
    3. Tailwind has systems for some of these, and I already know those systems! Maybe I can imitate the systems I like!

    For example, Tailwind has:

    • a reset stylesheet
    • a colour palette
    • a font scale

    the systems I'm going to talk about

    A screenshot of the 'solveit' application interface, displaying a blog post about structuring CSS.

    solveit chats/frameworkfromscratch

    • a colour palette
    • a font scale

    the systems I'm going to talk about

    I'm going to talk about a few aspects of my CSS codebase and my thoughts so far what kind of rules I want to impose on the codebase for each one. Some of them are copied from Tailwind and some aren't.

    1. reset
    2. components
    3. colours
    4. font sizes
    5. utility classes
    6. the base
    7. spacing
    8. responsive design
    9. the build system
    Screenshot of the Solveit web application interface, showing a discussion or note panel with a list of CSS-related topics.

    Note 152

    Note 1,428

    • NB: styles below; edit to view them.

    Prompt: 58

    I'll follow Julia's lead here then. I've pasted in the resets above.

    Assistant: 359

    Nice — that's step 1 (reset) done. A couple of observations worth noting as you work through it:

    • Putting it inside @layer base is a smart move. It means everything in your reset has the lowest priority, so any component CSS you write later will win over it without you needing to fuss about specificity. That matches Julia's interest in @layer as a structuring tool.
    • This is the full ~200-line Preflight you described copying — it includes both the modern-normalize parts and Tailwind's opinionated bits (the margin: 0 on headings/p, the unstyled ol/ul, block-level images, border-width: 0 on everything).
    • That last point is the one to keep in mind: with border-width: 0 on every element, a plain border: 1px solid won't show up unless you also set a...

    Screenshot of the Solveit web application, an interactive chat-like interface for working with code and notes. The interface displays various text entries including notes, a prompt, and an assistant's response detailing CSS styling considerations and Tailwind's Preflight.

    Solveit: Chats/Framework from Scratch

    167 img, svg, video, canvas, audio, iframe, embed, object {
    168   display: block;
    169   vertical-align: middle;
    170 }
    171 
    172 img, video {
    173   max-width: 100%;
    174   height: auto;
    175 }
    176 
    177 [hidden] { display: none; }
    178 
    179 </style>
    Screenshot of the Solveit web application, showing an interactive code editor displaying CSS styles and related notes, including a source URL for Tailwind CSS and a Perl cleanup command.

    Note: 152

    Note: 1,428

    • NB: styles below; edit to view them.
    list-style: none;
    margin: 0;
    padding: 0;
    }
    
    html {
      font-family: ui-sans-serif, system-ui, -apple-system, BlinkMacSystemFont, "Segoe UI", Roboto, "Helvetica Neue",
        Arial, "Noto Sans", sans-serif, "Apple Color Emoji", "Segoe UI Emoji", "Segoe UI Symbol", "Noto Color Emoji";
      line-height: 1.5;
    }
    body {
      font-family: inherit;
    Screenshot of an interactive web-based code editor interface for 'solveit chats/frameworkfromscratch', displaying CSS code with "Note" tab active.

    solveit chats/frameworkfromscratch

    Screenshot of the 'solveit' web application, displaying CSS code in an editor interface.

    Note: 152

    Note: 1,428

    NB: styles below; edit to view them.
    
    <style>
    @layer

    solveit chats/frameworkfromscratch

    Prompt: 58

    I'll follow Julia's lead here then. I've pasted in the resets above.

    Assistant: 359

    Nice — that's step 1 (reset) done. A couple of observations worth noting as you work through it:

    • Putting it inside @layer base is a smart move. It means everything in your reset has the lowest priority, so any component CSS you write later will win over it without you needing to fuss about specificity. That matches Julia's interest in @layer as a structuring tool.
    • This is the full ~200-line Preflight you described copying — it includes both the modern-normalize parts and Tailwind's opinionated bits (the margin: 0 on headings/p, the unstyled ol/ul, block-level images, border-width: 0 on everything).
    • That last point is the one to keep in mind: with border-width: 0 on every element, a plain border: 1px solid won't show up unless you also set a
    Screenshot of the "solveit chats/frameworkfromscratch" web application, displaying interactive notes, prompts, and assistant responses related to CSS and Tailwind CSS, resembling a chat interface with code snippets.

    solveit chats/frameworkfromscratch

    Note: 152

    Note: 1,428

    • NB: styles below; edit to view them.

    Prompt: 58

    I'll follow Julia's lead here then. I've pasted in the resets above.

    Assistant: 359

    Nice — that's step 1 (reset) done. A couple of observations worth noting as you work through it:

    • Putting it inside @layer base is a smart move. It means everything in your reset has the lowest priority, so any component CSS you write later will win over it without you needing to fuss about specificity. That matches Julia's interest in @layer as a structuring tool.
    • This is the full ~200-line Preflight you described copying — it includes both the modern-normalize parts and Tailwind's opinionated bits (the margin: 0 on headings/p, the unstyled ol/ul, block-level images, border-width: 0 on everything).

    That last point is the one to keep in mind: with border-width: 0 on every element, a plain border: 1px solid won't show up unless you also set a

    Screenshot of the 'solveit' application interface, displaying a conversational flow with notes, prompts, and assistant responses. The content includes a URL, a Perl command-line code snippet, and explanatory text with highlighted CSS properties and concepts like '@layer base'.

    Prompt: 121

    FYI the reason I added the layer is so it's a lower priority to the unlayered solveit css, so it doesn't break the UI here.

    Can you give me a concise example I can try out showing 2 little @layers (with new unused names) we define and use?

    Assistant: 211

    Here's a small one — define two named layers, declare their order, then put a rule in each:

    @layer theme, widgets;
    
    @layer theme {
      p { color: rebeccapurple; }
    }
    
    @layer widgets {
      p { color: teal; }
    }

    The key idea: the @layer theme, widgets; line at the top sets the priority order (later = wins). So even though theme and widgets both target p, the text comes out tealwidgets is declared last, so it beats theme, regardless of source order or specificity.

    Try dropping that into a <style> block with a <p> and see.

    Screenshot of a web-based chat interface from "solveit chats/frameworkfromscratch" displaying a prompt and an assistant's response with a CSS code example demonstrating `@layer` rules.

    solveit chats/frameworkfromscratch

    Screenshot of a web-based interface displaying HTML and CSS code examples, alongside a note section.

    Prompt: 107

    OK I'm thinking we'll actually use TAC, but without web components (but will use some new HTMX approaches instead). We might make some little modifications too. Help me start with a small component example, perhaps from the TAC article and examples above.

    Assistant: 418

    Let's start with the Badge — it's the simplest self-contained TAC component, and it's pure CSS (the JS evolution comes later). Here's a version you can drop into an `` cell:

    %%html
    <style>
    @layer components {
      x-badge {
        display: none;
        min-width: 1.25rem;
        height: 1.25rem;
        border-radius: 0.625rem;
        place-content: center;
        background-color: blue;
        color: white;
      }
      x-badge[count]::before { content: attr(count); padding: 0 6px; }
      x-badge[count]:not([count="1"]):not([count="0"]) { display: inline-flex; }
    }
    </style>

    A screenshot of a chat interface from the Solveit application, displaying an AI conversation and a code block in an HTML cell.

    ATTRIBUTE: count carries the data and drives visibility — show only when count is present and non-zero

    No classes, no JS — just a tag styled by its attribute

    I wrapped it in @layer components to match the structure you’re building. Give it a run and see the badge appear only on the non-zero one.

    Code: 425

    %<html>
    <style>
    x-badge {
      display: none; min-width: 1.25rem; height: 1.25rem; border-radius: 0.625rem;
      place-content: center; background-color: blue; color: white;
    }
    x-badge[count]::before { content: attr(count); padding: 0 6px; }
    x-badge[count]:not([count=""]):not([count="0"]) { display: inline-flex; }
    </style>
    <p>Cart <x-badge count="3"></x-badge></p>
    <p>Empty <x-badge count="0"></x-badge></p>

    Output:

    • Cart 3
    • Empty

    Screenshot of a code playground interface for “Solveit” showing HTML and CSS code for an “x-badge” component. The output panel demonstrates the badge displaying a count of “3” next to “Cart” and no badge next to “Empty” (for a count of “0”).

    Code: 2,419

    Div(roles_grid(), Div(roles_grid(), cls="darktheme", style="background:#000;--on-bold:var(--bg)"),
      style="display:flex;gap:16px")

    Output:

    • subtle neutral
    • subtle pri
    • subtle danger
    • subtle warning
    • subtle success
    • subtle info
    • subtle sec

    The output also includes two additional columns of colored labels. One column shows labels marked "bold" in various colors, and another shows labels marked "subtle" against a dark background, reflecting the same semantic categories.

    Screenshot of a user interface development environment, showing a code snippet and its visual output displaying a grid of color swatches. The output grid has three columns. The first column shows "subtle" styled text labels like "neutral", "pri", "danger", "warning", "success", "info", and "sec", each in a different color against a light background. The second column displays "bold" labels in brighter variations of the same colors on a light background. The third column presents "subtle" labels in the same colors but on a dark, inverted theme background.

    • .danger-subtle → subtle bg + normal fg (the alert-box look)
    • .danger-text → just coloured text (the accent look)

    That mirrors the three things we already validated. Here's a generator:

    def role_cls(r): return [f".{{r}}-bold {{ background:var(--{{r}}-bold); color:var(--on-bold); }}",
    	f".{{r}}-subtle {{ background:var(--{{r}}-subtle); color:var(--fg); }}",
    	f".{{r}}-text {{ color:var(--{{r}}); }}"]
    clines = [l for r in roles for l in role_cls(r)]
    print("n".join(clines))

    Each role expands to three classes pulling from the exact tokens we tested, so the classes inherit the light/dark flipping for free.

    Code: 149

    def col_cls(n,i): return [f".col{{{n}}}{{{i}}} {{ color:var(--col{{{n}}}{{{i}}}); }}", f".col{{{n}}}{{{i}}}-bg {{ background:var(--
    col{{{n}}}{{{i}}}); }}"]
    cclines = [l for n in range(1,8) for i in range(1,8) for l in col_cls(n,i)]

    Note: 50

    4. Font sizes

    4. font sizes

    One thing I appreciated about Tailwind was that if I wanted to set a font size, I could just think "hm, I want the text to be big", write text-lg, and be done with it! And maybe if it's not big enough I'd use xl or 2xl instead. No trying to remember whether I'm using em or px or rem.

    So I defined a bunch of variables, taken from Tailwind, like this:

    --size-xs: 0.75rem;
    --line-height-xs: 1rem;
    
    --size-sm: 0.875rem;
    --line-height-sm: 1.25rem;

    Then if I want to set a font size, I can do it like this. It's a little more verbose than Tailwind but I'm happy with it for now.

    h3 {
    	font-size: var(--size-lg);
    	line-height: var(--line-height-lg);
    }

    solveit chats/manualwork

    Screenshot of the Solveit chat application interface, displaying a conversation.

    solveit chats/manualwork

    Prompt: 182

    A is exactly the right next step, agreed - I'd forgotten I'd actually been planning to do that! I've added a slide about Ekers. I could briefly show some pushback from devs re how AI is causing problems, and then maybe move to showing what it looks like to really engage with the craft of software dev (Bret Victor et al). What might a path look like through and from there?

    Assistant: 1,153

    From there, two genuine choices — and you need to pick:

    • Path X — descend now. Now drop into dark flow / the gambling mechanism (LDW, METR's 40% gap, Lattner's "pull the lever again, try again"). It lands harder here than earlier would, because you've just shown the good thing that abdication throws away. Then climb back out via harness → ULMFiT/democratization → Lattner's "senior expert not junior cranker" → Solveit demo → Pólya close.
    • Path Y — stay in the light. Skip the heavy descent; go straight from the abstraction/abdication hinge into harnessing (democratization history, Lattner, Solvit, the Evans demo), and let the dark-flow material live only as the brief Beat-1 gesture. Warmer, more hopeful, less teeth.

    Given your audience (the reflecting-and-wondering, not the captured), I lean Path X but kept tight — they need enough of the mechanism to recognise the trap they're half-sensing, but you don't want to wallow in it. One sharp descent, then the climb.

    The real decision I can't make for you: do you want this talk to have teeth (X) or stay invitational (Y)? That changes how much gambling/dark-flow material you build next.

    Prompt: 141

    Screenshot of an AI chat interface named 'Solveit' displaying a conversation with a user prompt and an assistant's multi-part response offering two distinct paths for a presentation, followed by further interaction.

    recognise the trap they're narr-sensing, but you don't want to wallow in it. One sharp descent, then the climb.

    The real decision I can't make for you: do you want this talk to have teeth (X) or stay invitational (Y)? That changes how much gambling/dark-flow material you build next.

    solveit chats/manualwork

    Prompt: 141

    Actually first I might briefly show the dark flow idea, since it links to the tokenmaxxing stuff (i.e it's not just unproductive, but it's not supporting the things that supports

    autonomous, mastery-driven, growth-producing work.

    Slide 5 (Ekers) – The other side of the coin.

    The clinical convergence you agreed was the right next step. SDT says "present → flourishing"; BA says "absent → depression, restored → recovery." Two independent literatures, same active ingredient. The carrot is now un-handwave-able.

    Slide 6 (Positive vs Junk Flow) – The turn.

    Csikszentmihalyi's own words split flow from its counterfeit: the thing that "makes you grow" vs the "superficial experience... you become addicted to instead." This is the pivot from carrot toward threat.

    Slide 7 (Rachel / vibe coding) – Naming the mechanism.

    Classic vs quadrant model; the dark-flow framing applied to vibe coding specifically. Ties straight to your tokenmaxxing point — the leaderboard is the manufactured celebratory noise.

    Slide 8 (Autonomy/Mastery x Support/Decay) – The hinge, in miniature.

    This is the most important structural slide so far: it's your abstraction vs abdication distinction rendered as a 2x2. Same tool, two columns — Support ("break down barriers," "tackle more complex tasks") vs Decay ("illusion of control," "outsource challenges, decreasing effortful practice"). That is the pharmakon: AI isn't good or bad, it's the mode of holding it.

    So where we're up to: you've completed the positive case, made the turn through dark flow, and landed exactly on the fork we discussed. Slide 8 poses the question but doesn't yet resolve it — it shows the two columns exist without showing how to stay in the left one.

    • Slide 6 (Positive vs Junk Flow) – The turn.

      Csikszentmihalyi's own words split flow from its counterfeit: the thing that "makes you grow" vs the "superficial experience... you become addicted to instead." This is the pivot from carrot toward threat.

    • Slide 7 (Rachel / vibe coding) – Naming the mechanism.

      Classic vs quadrant model; the dark-flow framing applied to vibe coding specifically. Ties straight to your tokenmaxxing point – the leaderboard is the manufactured celebratory noise.

    • Slide 8 (Autonomy/Mastery x Support/Decay) – the hinge, in miniature.

      This is the most important structural slide so far: it's your abstraction vs abdication distinction rendered as a 2x2. Same tool, two columns — Support ("break down barriers," "tackle more complex tasks") vs Decay ("illusion of control," "outsource challenges, decreasing effortful practice"). That is the pharmakon: AI isn't good or bad, it's the mode of holding it.

    So where we're up to:

    You've completed the positive case, made the turn through dark flow, and landed exactly on the fork we discussed. Slide 8 poses the question but doesn't yet resolve it — it shows the two columns exist without showing how to stay in the left one.

    Intrinsic Motivation

    Screenshot of the Solveit tool interface displaying notes or document excerpts.

    Self-Determination Theory and the Facilitation of Intrinsic Motivation, Social Development, and Well-Being

    Screenshot of the "solveit" web application, displaying a chat or note-taking interface with various entries.

    Yet, it is also clear that the human spirit can be diminished or crushed and that individuals sometimes reject growth and responsibility. Regardless of social strata or cultural origin, examples of both children and adults who are apathetic, alienated, and irresponsible are abundant. Such non-optimal human functioning can be observed not only in our psychological clinics but also among the millions who, for hours a day, sit passively before their televisions, stare blankly from the back of their classrooms, or wait listlessly for the weekend as they go about their jobs. The persistent, proactive, and positive tendencies of human nature are clearly not invariantly apparent.

    The fact that human nature, phenotypically expressed, can be either active or passive,

    How does 'purpose' fit in?

    Screenshot of a Solveit chat interface displaying a prompt and a detailed response from an AI assistant regarding the concept of "purpose" in psychological theory.

    Recursive Language Models

    Screenshot of a research paper titled 'Recursive Language Models' displayed within an interactive web-based environment.

    How To Solve It With Code

    Screenshot of the Solve It website in a Chrome browser window.

    How To Solve It With Code

    TLDR

    Don't outsource your thinking to AI. Instead, use AI to become a better problem solver, clearer thinker, and more elegant coder.

    Across 10 lessons, which you can v

    • Classic data structures and a
    • More advanced methods app
    • pytorch, graph algorithms, an
    • Web programming using FastH1 w
    • Writing, including long form writing (with Eric Ries), blog posts, articles, and actually useful meeting notes
    • Reading, including academic papers and Eric Ries's latest book
    • Using web APIs
    • System administration and devops
    • Web scraping
    • Building startups that take advantage of what we've learned (with Eric Ries).

    These are normally each full-semester-length topics of their

    https://tinyurl.com/jhaienghttps://tinyurl.com/jhaieng
    A QR code linking to the provided tinyurl.

    AI Engineer Melbourne

    МВ ДМВ

    1 6 21

    5 12 60

    ЭЛЕКТРОНЬ КБ 409А

    An old, beige CRT television set with a black screen bezel. The screen displays a grey, pixelated double right-arrow icon. Text on the TV's front includes "МВ ДМВ", channel numbers, and "ЭЛЕКТРОНЬ КБ 409А".

    People

    • Armin Ronacher
    • Brett Victor
    • Chris Lattner
    • Dan Pink
    • Douglas Engelbart
    • George Hotz
    • Ivan Sutherland
    • Julia Evans
    • Kenneth Iverson
    • Mihaly Csikszentmihalyi
    • Rachel Thomas

    Technologies & Tools

    • APL
    • Flask
    • LLVM
    • MLIR
    • Mojo
    • Python
    • Solveit
    • Swift
    • Tailwind CSS
    • Tailwind Preflight

    Concepts & Methods

    • Behavioral Activation
    • Conway's Game of Life
    • Dark Flow
    • Eudaimonia
    • Flow
    • Hedonia
    • Illusion of Control
    • Self Determination Theory

    Organisations & Products

    • Answer.ai
    • comma.ai
    • Discord
    • Turing Award
    • Uber
    • Wall Street Journal

    Works

    • Breaking the Spell of Vibe Coding
    • Drive
    • Moving Away From Tailwind
    • Recursive Language Models
    • The Mother of All Demos