Fantastic Load-Time Savings and Where to Find Them
Introduction to the Challenge
Discussing initial apprehensions and setting the scene with a personal story of taking on a major project after a holiday, focusing on making a web app load faster.
The Task at Hand
Details the specific project of optimizing the web app 'Stile,' including its functionality and challenges faced by schools with limited internet connectivity.
Strategies for Improvement
Exploring various technical strategies to reduce load time, including code splitting and analyzing the bundling process, and the role of dynamic import in React.
Debugging Bundle Size Issues
Identification of issues with JavaScript bundle sizes through bundle analysis tools and the process of resolving these issues to enhance performance.
Optimizing Caching and Bundle Adjustment
Discussion on the importance of caching and splitting initial chunks for efficient downloading, using bundle analysis to track and correct caching misconfigurations.
Addressing Cache Busting and Compression
Addressing unexpected changes in content hashes and dealing with font file inconsistencies, highlighting tools and methods for identifying and resolving such issues.
Observing Real-World Effects
Using browser dev tools to monitor network activity and identify unnecessary downloads, leading to significant savings in page loading time.
Embracing HTTP2 and Further Splitting
Discussion on the benefits of HTTP2 multiplexing for loading smaller bundle chunks more efficiently, and the balance between chunk size and quantity for optimal performance.
Lessons Learned and Monitoring Progress
Reflections on the importance of monitoring bundle size changes and the introduction of DebugBear for continuous monitoring to prevent regression in bundle size optimizations.
Maintaining Optimizations and Conclusion
Strategies for maintaining optimizations through team training and tools, concluding with achievements from the project and encouraging audience questions.
I came here yesterday and I was like, this is a very big room.
And what my bio doesn't say is that I also quit academia.
So I wouldn't have to talk to a bunch of people I don't know.
Cause last time I tried giving a talk, I had a panic attack and quit my degree.
So if this doesn't work out, I might need another career.
Anyway, I'd like to start by taking a moment to set the scene.
I went on holiday last year to visit that best friend.
And when I came back, I didn't have a team anymore.
I had a giant plushie, an assignment column and a mandate.
The CEO said he wanted the web app to load 10 times faster.
So my manager said, have fun.
How do you make things load faster?
That's easy, you tell everyone to get better internet.
Thank you all for coming to my talk.
Okay, so maybe it's not quite that easy.
Let's talk about Stile for a moment while I work.
Stile is a single page web app that's used in school classrooms.
We have a bunch of cool engineers working on it.
You might have already seen some of them talk in this conference.
The simplest way to describe it is an editable science textbook replacement.
So we provide a library of content to use in classes and all the tools need to edit the content, teach it in the classroom and provide feedback on student work.
The front end is mostly just regular React.
I saw a couple of great talks yesterday about Server components.
Did anyone see those?
And, so for anyone who wasn't in those talks, one of the benefits was that you can keep some of your code in the server and reduce your bundle size.
I'm super excited about this concept, but Stile is all rendered on the client side.
So we don't have access to any of that yet.
So this talk is not about that.
Come back to the past with me.
We're an education company and that means our customers are schools from all over.
Often they're super limited in their technology choices.
Some of them don't even get a choice about which browsers to use.
They might be out in the outback with spotty satellite internet, and we definitely can't ask them to get better internet just to load Stile faster.
So we come back to the original question, how do you make things load faster?
You have to download less stuff.
There are a couple of concepts associated with downloading less stuff.
Obviously you have the cold load time where you don't have anything cached and you have to download everything you need.
But we were also moving from deploying a few times a week to continuous deployment multiple times a day.
And we didn't want people to be downloading any more data than they needed to as they use Stile throughout the day.
It's bad for them because it slows them down and it's bad for us because we're paying for the extra bandwidth and traffic, which means double the number of problems I have to solve.
I'm going to look, take a look at some of the ways I use to reduce load time and the tools I use to explore them, or more accurately, some of the ways we were doing things wrong, despite our best intentions and the tools I use to find them and make them less wrong.
Let's talk about code splitting.
So in the most basic version of JavaScript bundling, your bundler combines all of your JavaScript code into a single larger file that you serve to your users.
And this code does a lot of stuff, and there's a lot of it, so it can be a pretty huge download.
Codesplitting is the concept of splitting that big file up into smaller files, and this means our users don't have to download all the code at once, or even at all.
And when we talk about splitting here, we're actually talking about two things.
So one is splitting out code that can be loaded on demand, so we can reduce cold load times.
And the other is splitting up code so you don't have to re download it all on every small change.
These things are both pretty important.
At Stile up until this point, we had mostly been thinking about splitting out code to load and demand.
So let's start there.
We think of our app as being used by two main classes of users, students and teachers.
So students are mostly working through lessons, and answering questions while teachers need to do things like browse the content library.
There are a lot of features which we think of as just teacher code.
Students and teachers don't need to download, don't need to do all the same things.
So they don't need to download all the same code, but also any given user probably isn't doing every possible thing in one session.
So we like to just serve them the code they need for their core experience.
And not make them download the code for a particular feature until they actually need it.
So the answer to this is to split your bundle up into smaller chunks of JavaScript, according to their function, and load them on demand.
And we were already doing this, so it's one of the first places I started looking for savings.
The modern ES6 way to do this is using dynamic import.
You have your standard import statement, it imports code statically and evaluates it at load time.
The import function asynchronously loads a module and returns a promise, which you can then use to reference that loaded module.
React Lazy Loading, It relies on this idea as well.
So it provides a wrapper that will only load your component when it's needed.
If your bundler supports code splitting on dynamic imports, it will split the bundle at that point and put the lazily loaded code into a different file.
And you can configure this however you like.
So you can have a different file for every dynamic import.
You can merge all dynamic imports into a single file or anything in between.
Most bundlers support this kind of code splitting now, but some support it more completely than others.
So you should check the docs for the right config.
We actually use required.ensure, which is an older function.
It's specific to Webpack and it's now deprecated, but it basically does the same thing as dynamic import.
Either way, you tell Webpack what modules you want to lazily import, and maybe what chunk you want to put them in, and it will do the tree shaking to figure out what code lies down that path, and sort out all the modules and the chunks and the asynchronous loading for you.
It can also work out where you have code that's shared by multiple chunks, and pop that into a separate file, so you don't have repeated code between the chunks.
And in general, it can do the same thing with any of the other chunks I'm going to talk about today.
We have these chunks already defined in our code, but when I looked at the output, some of them looked really suspiciously small, almost empty small.
Hang on, let me just zoom in on this for you.
That's better.
Okay, when I looked at one of the small chunks, it only had one module in it.
And when I searched for the rest of the code that went with that functionality, I found it in the main chunk.
That's when I decided it was time to bring in the bundle analysis tools.
There are a whole bunch of these and they're bundle dependent because they use the stats generated by your bundler.
But the idea is the same for all of them.
I'm going to talk about the ones I use which work with Webpack.
What I was really interested in was a dependency tree.
The one I found easiest to set up was StataScope, so it looks like this.
You can install StataScope as a Webpack plugin, and it will give you this nice report when you do a build.
It lets you navigate the dependency tree of your bundle, so you can see things like which chunks each module is included in, and where each module was imported from, to see how it got into a chunk in the first place.
So in this extremely contrived reproduction, I have set cats up to be dynamically imported.
These are very far away from me, I don't know the pointer thing, I forget the pointer.
The, but I've set cats up to be dynamically imported and I expect it to be in different chunks, the chonky cats chunk, that's what I've named it.
But when I run a webpack build and I grep for the code, I discover it's in the main chunk with all of my other code.
So I can bring it up in StatusScope and check the dependency tree and eventually I find the problem with me all along.
I have committed the cardinal sin of exploiting Fluffable from cats and importing it in bunnies.
And Bunnies is at the main chunk, so Bunnies is bringing Fluffable with it, but Fluffable comes with Cats, because they're defined in the same module.
And that drags everything else Cats depends on into the main chunk too, even though Fluffable doesn't actually care about any of it.
So this is another mystery solved.
The answer here is to move Fluffable into its own module.
And that way, Bunny still brings Fluffable into the main bundle, but now it's not tied to cats.
And cats and all of its dependencies go back to the ChunkyCats chunk.
So now that I had an idea of how code was getting into the initial chunk and how to get it out, I went to Webpack Bundle Analyzer to see what my chunks looked like.
This gives you a really nice visualization of what your bundle looks like, where the chunks are split, and what modules are taking up how much space in which chunks.
So in the context of the real Stile app, and not my fluffy animals, I used this to look for modules in the main chunk that looked like they were just for teachers, so they didn't need to be loaded by students.
And code that looked like it should have been in one of those existing on demand chunks because of what we was doing, but wasn't.
And then I could go back to stethoscope to track down how the code was getting into the main chunk and extract it.
Another thing these tools helped me discover was old configuration.
So I noticed that some of the code was actually including multiple chunks.
And they were both initial chunks.
So people would be downloading that same code twice on a cold load.
The way a bundler works is that you give it an entry point which is the top level file in your code tree.
And it starts there and looks for all the code that gets imported down the tree and pulls it into your bundle.
In the past, we defined two entry points which meant that Webpack was building two separate code trees into two separate bundles.
But we also imported one of those entry points Into the other one, so all the code in that tree was going into both of those bundles and we were shipping it twice.
We didn't need the extra entry point anymore, so just by removing it, we removed a bunch of duplication.
So this gets us through the first step, which is figuring out what code your users might not have to download at all, and making it so they don't have to download everything straight away.
We end up with one big but less big file that they have to download at the start, and a bunch of other files that they will download when needed.
This can already get you some great savings, but now that we feel like we've done a pretty good job cutting down the size of the initial chunk, how do we make that load faster for people?
Everyone has to download all this code the first time they visit the website, but you don't need to download files you already have, right?
The browser's cache files.
So if you're revisiting the same site and it hasn't changed, you should be able to read that file from your local cache instead of fetching over the network.
Conveniently, bundlers will put content hashes in output file names for you, so you can set the headers to cache those files forever and the cache busting will happen automatically.
If we can split up our big chunk in a way that some of the pieces aren't likely to change as often, then when we deploy a new version of the code, our users only have to re download the parts that change.
And this is a bit different from what we were trying to do with the on demand chunks.
Of course, those can also be cached.
But what we're thinking here is that we'd really like to split up that initial chunk a bit.
So if you're using that for the first time, you're still downloading all of it.
Straight away.
But after that, when we push out a new version with a few tweaks, you maybe only download half of it or a quarter of it.
How do we split up our chunk in a way that reduces case churn?
As real humans, one thing we can do is reason about our own code and find splits we think will work well.
We can decide what parts will almost always change together and which bits are likely to change independently of the rest of the code base.
For example, maybe you've built some code on top of some other code and it's highly coupled and you know if you change one part of it, you'll probably need to change the other part.
Or you have different teams working on different parts of the code, releasing on different cadences.
Or you want to split out your third party dependencies because they have their own release cadence.
Or your vendor dependency two years ago and you haven't touched it since.
Either way, you can explicitly specify chunks and tell them exactly what modules and folders you want in them.
And you don't have to limit this thinking to just what we would be caching either.
So most of us are going to be serving GZIP data and maybe your bundle contains a bunch of JSON data that you think would compress really well if you put it all together.
Better than if you mixed up with your JavaScript code.
Of course you can do this with all your chunks, not just your initial chunk.
Now we've seen two ways to improve load time using code splitting.
Splitting a bundle up into an initial chunk that always gets downloaded and some asynchronous chunks that get loaded on demand.
And then splitting up those chunks based on how your code changes to take advantage of caching.
This is all great when it works, but this is software engineering, and it's almost Halloween.
There's always something weird going on, and pretty soon in my investigation some spookiness appeared.
Remember how I very, briefly skimmed over using the content hash in the chunk file names for case busting?
Those content hashes were changing, but I hadn't changed the source code.
And the file sizes weren't changing either, just the content hashes.
So I went back to the tools.
My favorite tool to use here is actually just good old diff.
Actually, I use Vim, which means I feel obliged to tell you I use Vim, so I use VimDiff.
And when I diffed the files against each other, they looked almost the same, but there were a couple of lines that were in a different order.
And the code for it turned out to be code that we generate at build time.
Did you know that when you pass gulp.src a glob, it doesn't produce a stable file name ordering?
I didn't know this, and now I know.
So I thought we were sweet after I dealt with that.
But a little while later, I noticed another similar symptom in production.
So a chunk had changed hash, but not size, and I knew this chunk.
It was one of the chunks I split off the way I talked about before, where I know how that code changes, and I knew it hadn't changed.
So I went back to my trusty Vim diff.
And I was horrified because internally the bundle code refers to modules using generated IDs.
And in Webpack 5, those IDs are generated deterministically in production mode by default.
We were using Webpack 4, and the default there was to base the IDs off the order of modules.
So any time we added or removed a single module, depending on where it was used, it could change the content of all the chunks, not just the chunk it belongs to.
The moral of the story here is don't trust your bundler.
So that took care of most of the spookiness, but of course there's more.
Most of the chunks had stable content hashes at this point, but there was still one that was changing a lot.
And that was basically like this.
And then this.
But, actually this, so we generate a glyph font for our app in a pretty standard way.
So we roll up all that glyphs into a single SVG file and convert them to a TTF font file.
The first part of this pipeline looks completely normal.
The content hash of the SVG file that had all our glyphs in it was never changing.
But despite that, the font file we were generating from the SVG file had a different content hash on every build.
So the chunk that referred to the font also had a different content hash on every build, so I'm sure you know where this is going.
Yeah, okay.
At this point, the only tool I could really depend on was a vague sense of despondency as I stared off into the distance, sobbing.
Anyway, it turns out that the font creation timestamp is embedded into the font file and this was different on every build.
So, Overriding it, sorted out, that last bit of spooky.
So now we've talked about how to make your chunks more cacheable and fix them when they're not.
Where can we find even more savings?
Browser dev tools.
So I loaded our page and I stared at the network tab for a while, and then I reloaded it and I stared at the network tab some more.
And I wondered why our super nice, but big loading animation, was getting downloaded again, instead of loading from the cache.
So we serve this file statically from S3 so it can show off while the browser is getting everything together from the latest version of the app.
And the whole point is to improve the user experience and give them some feedback while they're waiting for the page to load.
But, we hadn't configured it to cache at all, so instead of improving their experience, we were actually slowing them down by making them download extra stuff before the page loaded.
We configured the file through S3 to be cached forever.
And at this point, you're probably thinking that everything in this talk involves splitting or caching.
o.
Let's talk about more splitting.
We split our one big bundle into multiple chunks, so we don't have to load everything at once.
And we split those chunks into more chunks, so we can cache them better.
But we still have a relatively small number of relatively large files.
And that means we're not taking advantage of hTTP2 multiplexing.
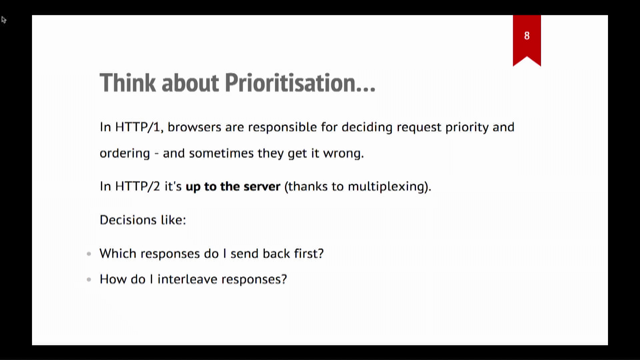
So in HTTP 1.
1, your browser can ask your server for one thing at a time and then it has to wait for the response before asking for the next thing and so on.
So say you're trying to load a page that has a bunch of images, you ask for the HTML, it comes back, now you have to ask one image at a time and wait for it to come back before you can ask for the next image.
So you're adding a whole bunch of latency in between requests and this can be pretty slow.
And the most common workaround is to open multiple connections to the server, but now you have the overhead of running those connections, and your browser is typically limiting you to six connections per server.
Now, modern browsers have supported HTTP2 for years, and our server had supported HTTP2 for years.
And HTTP2 supports multiplexing, where your browser can fire off a bunch of to the server at a single time and the server will pick up all these requests and respond to them, basically, however it feels is most efficient.
So in any order, or in pieces that the browser put back together, again, all over the same connection.
And as a user, you end up getting everything faster overall, because you're not waiting for each individual request to complete, before you can send the next.
And this compounds because if you get back one of the files you asked for and it needs another file, you can send the request for dependency immediately, even while you're still receiving data from the existing requests.
So we can take advantage of this with even more splitting.
The first question is how much splitting should we do?
There's a trade off between the number and size of chunks.
If your chunks are too big, then you're not using that ability to get back a smaller chunk and process it faster.
But if you have too many small files, you might hit concurrency limits and I/o overheads, so accessing cache memory is fast, but we've all seen what happens when you're trying to read a huge number of tiny files on disk.
Small files aren't going to compress as effectively as larger ones, so you might end up serving a much larger GZIP bundle.
And since your bundle has to include boilerplate in every file, and code to keep track of which chunk each module is in, you might start blowing out your bundle size again too.
So I don't think there's an easy, one size fits all answer for this one.
If you ask Google, it mostly seems to boil down to, do what works best for you.
And don't have hundreds of files, and you want to keep in mind that includes other files that you're serving with your page from the same place, like maybe images.
I've seen a lot of discussion recently about unbundling, which is where you skip the build step that smushes all your modules together, and you ship all of your separate modules as separate files, with an import map to resolve all your imports instead, and I think that can be really nice in development, to skip the build and speed up the cycle time, but if you're doing that in production, you still wind up with a whole bunch of these problems from having too many small files.
So you can benchmark the load times with different chunking configurations and tune it for your code base and traffic patterns.
Something in the order of magnitudes of tens of files seems to work pretty well for us with reasonable chunk file sizes.
Caveat there is that we haven't benchmarked and optimized that yet.
Obviously, we'd like these smaller chunks to be cache friendly as well.
We just rely on Webpack to do that.
So if you ask it to split up chunks by size, it does that deterministically.
So if you run it twice for the same settings, the same modules will always go into the same chunks in the same order.
And it names the chunks based on the path of the first module in each chunk, so you can keep track of each chunk over time.
The documentation isn't super clear on this, but if you look at the source code, it tries to group modules into chunks based on how similar their names are.
Which I think makes sense because intuitively, if you're changing a bunch of modules together because they're part of the same feature, they're probably going to be in a similar place in your code base and have similar file paths.
So then, if they're going into the same chunk, you can minimize churn in your other chunks.
I want to briefly mention speculative loading.
I'm not going to go into this in detail, but we're talking about load times, so it's worth being aware of it.
You can provide some extra hints in your HTML about how to download things you're going to need, or that you think you're going to need.
There's a preload hint, so you can use this to tell the browser that some resource on this page is high priority and it should be downloaded first.
For example, the page render doesn't get blocked because the browser was downloading something else that could pop in later.
There's also module preload, which is a special snowflake for JavaScript.
Extra glitter.
You can use the prefetch hint, and this will tell the browser to use idle time to fetch resources you think the user is going to need when they navigate to another page and put them in the cache.
If a user does navigate to that page they can get some of the files they need from the cache instead of over the network, which will make the experience feel faster, even though it didn't actually reduce their overall downloads.
So I guess I lied when I said this isn't about caching.
There's also the pre connect hint and the DNS pre fetch hint and these are for when you know you're going to need resources from a different origin and the browser can start making a connection to that server.
You can use these with any kind of resources.
Your JavaScript, your CSS images.
So it can be about those split chunks.
If you want it to be, but it doesn't have to.
I've mostly discussed ways to save loading time by optimizing the JavaScript bundle.
But there was one other thing I found in the network tab that made a huge difference.
When you open our website, you're directed to our login page, where we have these beautiful, big background images that we want to load progressively.
So it would be a nicer experience on slower connections.
But not all browsers support actual progressive images in backgrounds.
So we were emulating this by loading in four different sizes.
And layering them over each other as they finish downloading.
Unfortunately, the three smallest file sizes added up to be the same as the largest one anyway.
And there wasn't even any guarantee they would download in the right order.
So this was counterproductive.
So we just took out the intermediate sizes and it turns out just having the smallest one maintained that illusion well enough.
Okay, did it work?
So I did this work over the course of about a month.
In that time, we saw a 45 percent reduction in the amount of JavaScript downloaded on a cold load of our front page.
It actually came down below that for a bit, but we had to make some trade offs to fix those caching issues I talked about.
We saw an overall 43 percent page weight reduction on the login page, which loads that initial JavaScript bundle, as well as those background images.
We saw real improvements in caching, at the time we verified that manually by checking what we could load from the cache after the deploy.
And the CEO said it feels faster, and he closed the ticket.
It might have been useful to have some proper metrics in advance.
We're recording some of our real web client performance metrics, but not in a way where we could use them to effectively compare load times before and after we made the changes.
So let's talk about how to track and measure things.
After we did all this work, we didn't want to undo it, so we needed a way to keep the download size down.
Obviously, the best way is to intimidate your colleagues, but sometimes I go on holiday.
So we wanted to keep tabs on it some other way.
The biggest reason we've been loading extra code was developer error.
And we wanted an easy, low maintenance way to tell us when we accidentally done a bad thing.
Something we could set off in an hour, and preferably something that's as close to real world usage as possible.
There are a bunch of tools you can plug into your Git repo that will run in your branch and tell you if you've made big changes to the JavaScript bundle.
We didn't want to do the work of setting that up if we don't actually need it.
So we looked around and found DebugBear, which does actually plug into your Git repo if you want it to, but we use it to run regularly scheduled tests on our live pages.
So DebugBear is one of the many services that monitors web performance metrics.
So if we had it before we started making these changes, it could have given us those before and after stats we didn't have.
But it also has some pretty unique features that made it perfect for us.
It monitors JavaScript bundle size by file.
So a lot of similar services measure the overall JavaScript bundle size, but they aren't breaking it down by chunk.
So it tracks each chunk and it's smart about chunk file names.
And even when the content has changes, it can still track the changes per chunk.
And it can send notifications to Slack when your bundle size changes.
So now if we do leak code into the initial chunk, we'll see an alert in Slack and we can go and look at DebugBear for more details about the files that changed.
And then we can look up the before and after files and compare them to see what code leaks and track down where it came from and obviously fix a leak.
This works well for us.
We don't have chunk leaks that often, so lightweight monitoring is the right level and DebugBear is super low touch and low maintenance.
We haven't seen those leaks happen enough that we need to build something into CI yet.
Of course.
Intimidating your colleagues is still important to keep things that way.
So I ran some internal training to scare everyone into using required and ensure properly.
You can find all the scared colleagues possibly in this room or at stileeducation.com and we are hiring for our business systems and data team.
And we've also opened applications for our women in STEM internship for 2024.
So if you know any young women who'd like to be software engineers, be in touch.
I did all the work I just talked about on our actual JavaScript bundle, which you will find at stileapp.com, possibly in your kid's science classroom.
And I am on various social media, also Pokemon Go, if you come and find me at the break, and if you have a shiny super sized costume pumpkaboo, I want to talk to you.
Thank you for sitting around through that on Friday afternoon and not making me find another career.
Any questions?
“QC,” the CEO said, “I want the web-client to load 10 times faster.”
We often take speedy internet for granted, but everyone’s happier when they have to download less stuff – it’s faster for customers, less load for platform to maintain, easier to sell, and lighter on bandwidth budgets!
In this talk, QC will go over tools and techniques that will help you drastically reduce load time, halve download size, considerably cut cache churn, and more – plus easy ways to monitor changes and prevent ourselves falling back into the same traps.

