Beyond User Needs: Speaking the Language of Business to Drive Decisions
Why Strong User Insights Fail to Influence
Ruth Ellison introduces her design and government research background, then examines why compelling user evidence often fails to move senior decision-makers. A cross-government childcare project reveals the missing connection: stakeholders cared most about fraud and reputational risk, so the team had to translate usability findings into those business concerns.
Business Acumen Through Disciplined Curiosity
Ellison presents business acumen as the first of three skills for gaining strategic influence. She offers practical questions about success measures, KPIs, product strategy, priorities, customers, assumptions, and risk that help researchers uncover the business problem behind a project.
Stories That Connect Users to Business Impact
Ellison explains how storytelling with data makes research memorable to time-poor executives. Her condensed situation–conflict–resolution structure makes the user the hero, explicitly links their difficulty to a business consequence, and concludes with an actionable next step supported by qualitative and quantitative evidence.
Making the Important Number Stick
A researcher transforms an overlooked forms project by showing that 99% of applications fail on the first attempt. Drawing on Chip Heath’s communication advice, Ellison argues that researchers should skip excessive methodological preamble and make decision-makers feel the scale and cost of a critical statistic.
Collaborative Tools for Proactive Alignment
Ellison introduces proactive alignment seeking as a way to become a strategy enabler rather than a reactive provider of findings. She details four collaborative practices: assumption mapping, insight-to-impact mapping, informal strategy syncs, and pre-wiring influential stakeholders before sensitive presentations.
Finding the Strategic Sweet Spot
Ellison addresses common objections, including limited access to strategy, concern about encroaching on product management, and findings that do not connect directly to revenue. She broadens business value to include risk, confidence, time, brand perception, and customer satisfaction, then challenges the audience to reframe and share one insight in the following week.
Hello, everyone. Can I just say it's really hard being straight after lunch where food coma won't be happening, but I'll try my best? And John's right. I was actually here at the very first Web Essentials back in I think it was twenty one years ago, 2004, showing my age. But hello, everyone. It's really good to be here today on the lands of the Wurundjeri people. I'm so sorry.
Have trouble pronouncing words of connation. I myself is I come and live I live on Ngunnawal Land. That's in Canberra. So my name is Ruth. I'm the founder or cofounder of Propel Design, a strategic research and design company. And we're a very small company. But I started my design career about twenty four years ago, designing screens for mainframe. And that's how I learned my craft from there.
From there, I actually joined then the first user centered design team in the federal government. So the lessons I'm learning I'm showing and sharing today is actually based on all kind of things I wish I hadn't I'd known over the course of my career and a lot of mistakes I had made personally that has informed my kind of worldview right now.
So we are all here because we share and excel at understanding our user needs. We find the insights, we champion the the needs, and we really advocate passionately for them. But have you ever been in that situation where you've just finished a brilliant piece of research, and you think the part you know, insights are powerful, and your needs the user needs are crystal clear, and you know exactly what business needs to do?
So you walk into the stakeholder meeting, you get all these great insights full of passion for the users, and you present your findings. Only met with blank stares or, oh, bangs, we'll consider it, or sometimes I'm still on the phones, not even looking up. Now, that's extremely frustrating. You know, once we have these valuable hard earned insights that's you know, why is it that these hard earned insights are so often failed to influence the most important decisions?
And this frustration, you know, it just feels like people are unvaluing our work. But what I learned is that the problem isn't usually our research. It's that we're speaking a different language to our executives and decision makers. So this talk, and I'm glad that my fellow speakers yesterday also mentioned this, but this talk about learning to be bilingual. It's about just translating user needs into the language of business impact. And so bridging that gap of and and having that kind of crucial mindset shift.
I want to tell you a story from earlier in my career that really taught me how critical this is. So a number of years ago, when everyone wanted a new mobile app, I was working on this large cross government multi agency project, and it was pretty complex. Our goal was to simplify the kind of recording the child care attendance process. Oh, and also, the minister wanted a new app.
Now, Appanaut, we went out and we did this fascinating discovery. We uncovered all sorts of user pain points from the child the parents and the carers' perspectives to the child care providers and to the government staff that serviced that. So we had we had all these really great opportunities that we uncovered, and they were really backed by solid research.
But despite presenting these clear, what I thought was very actionable user insights back to the senior stakeholders, we were stuck. We just weren't getting anywhere with with, with our research. So I had to stop and go back and reexamine what was going on, really trying to read between the lines. And I discovered that there were these powerful unspoken agendas at play.
Now the project brief did not mention any of this, but what senior leaders really cared about were two things, reputational risk and fraud reduction. That was an moment for me and my team. Once we knew those real drivers, we were able to connect our user insights to things that would actually have impact for our for our stakeholders. Suddenly, fixing a provider's frustrating workflow wasn't just improving usability, it was leading was reducing data errors that could lead to fraud.
And that got their attention. So that lesson was a huge experience lesson for me. It taught me that passion for our users is essential. But by itself, it isn't enough. We need a reliable way to uncover these unspoken agendas and connect our work to what the business really value. So these are the gear that will help us, the three skills I want to talk about, help us climb from the value of that kind of tactical research to the summit of strategic influence.
And these three skills are business acumen, storytelling with data, and proactive alignment seeking. So let's start with the one that unlocked the child care project. This is the business acumen, and this is a foundational skill. It might sound a little bit intimidating, but it's not. It's simply understanding how does your organization function, and what are the plans to succeed. It's understanding that really big picture, and how all the different components fit into that bigger picture.
So at the heart, this skill is simply of understanding the why behind the projects we work on. It's a kind of disciplined curiosity, that we need to look past the initial project brief and really ask the bigger question. What is the bigger biggest problem and the business problem we're trying to solve here? Now this matters because it allows us to frame a user problem as a business problem.
For example, a confusing checkout flow isn't just a user frustration. It's a direct contributor to card abandonment and therefore revenue, and that's a language that business understand. Now without this context, our research is just a collection of really interesting facts. As researchers, we know it's I think it's all fascinating. But with that context, it really becomes a powerful tool for influence.
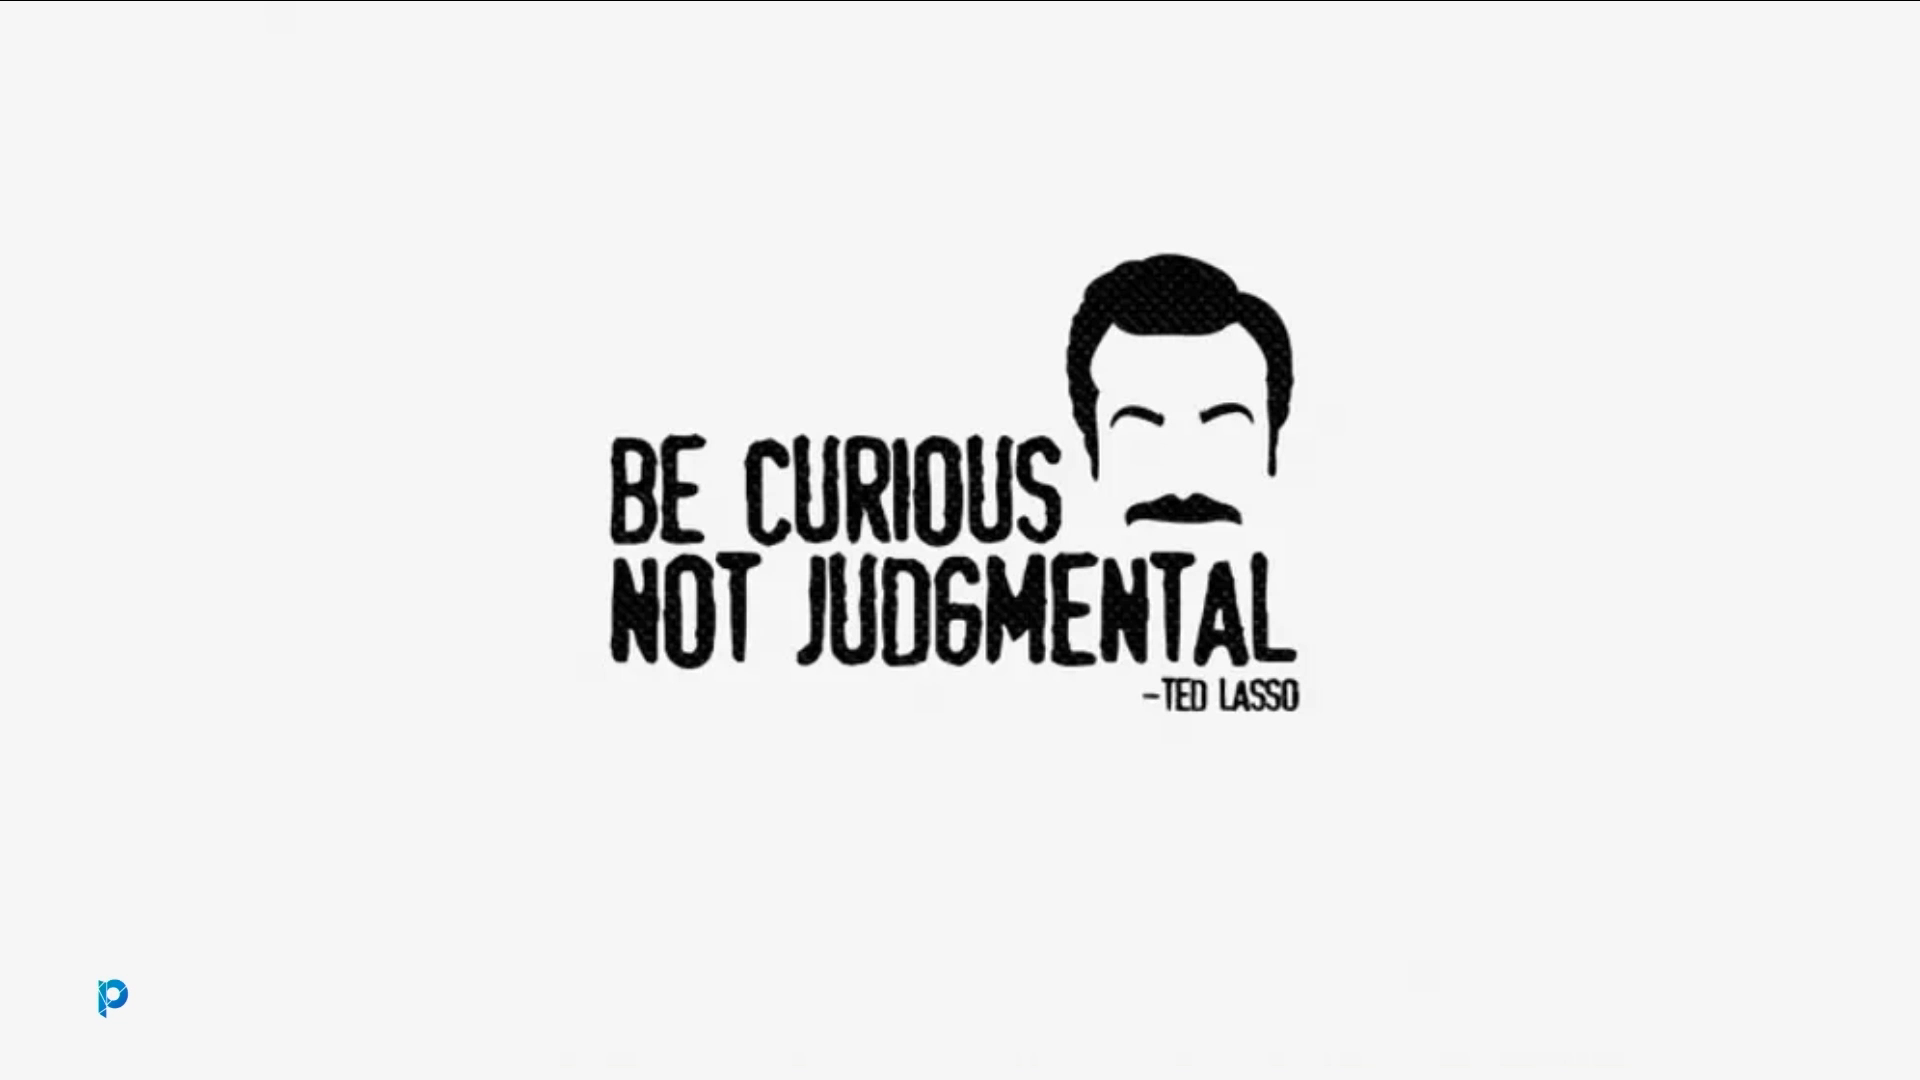
And the mindset that we need to cultivate is captured perfectly by this piece of advice from one of my favorite TV shows. Be curious, not judgmental. And if you haven't seen Teddlost, it's a really great TV show. Now, when we encounter a business project that seems to conflict with the user research that we're presenting, our first instinct can be to judge, to think that, oh, they didn't get it, or they don't care about our users.
But a more strategic and ultimately more effective approach is to get curious. For example, why is fraud reduction really important right now? What pressures are our stakeholders facing that we just might not be aware of? That curiosity is the heart of business acumen. It's what turns a potentially adversary conversation into that kind of true partnership. So being curious starts by asking a few questions.
So here's a few you can maybe try and adapt at your next meeting, and it's built upon some key business concepts. The first is for understanding success and measurement. So these questions help you understand what does value and winning look like for our business beyond just kind of shipping features. So the first question is, how will we measure if this was successful six months after launch?
This is a great question because it really pushes the conversation between sorry, beyond that immediate short term needs. Next question is what are the top one to two KPIs that this project's meant to influence? And this is a very direct way to get to the metrics. Beside revenue conversion, what other business outcomes are we hoping for? Are we trying to reduce support calls to our contact center, or are we trying to increase engagement?
This really helps to broaden the definition of value. The second key concept is around priority and strategy. So these are questions that help you understand why this project's important right now, and how does it fit into the bigger picture. So the question, the first one here is, how does this work fit into the long term vision for our product?
This helps to connect your tactical work to that bigger strategy piece. My favorite one is why is this project prodigy for us right now over any other things we could be doing? Particularly in situations now where economic situation can be very tough, this is a really important question. It helps really kind of reveal that strategic urgency. The third question is, with this feature, are we primarily trying to attract brand new customers or better serve our existing ones?
This helps reveal, is this about growth or retention? The final one is around risk, and this is my favorite one. We've actually heard, I think, Seb talk about that, and a bunch of speakers also mentioned this. So this is about framing your work as a way to reduce risk because it's a really powerful language of the business.
So one question is, what's the biggest risk to the business if we get this project wrong? If we don't understand that, it's really hard to address our findings in that particular manner. The second one is, what are our main assumptions for our users or the market that needs to be true for this to succeed? I like this because it helps us, you know, inform some of our research that we can be doing.
So back to that child care project. Now uncovering that kind of applying business acumen really helped us to to to uncover the real business drivers. Without that context of fraud and kind of and risk, our work would have just been perceived as a bunch of complaints from the users. But with that context, it then became a strategic discussion about fraud reduction.
So once you use that curiosity to truly understand our business context, you need a powerful way to share what you've learned. You need to package your insights in a way that resonates both emotionally and logically. That brings us to our second skill, storytelling with data. This is all about packaging your stories and your facts and findings into a narrative with a hero, our user, a conflict and a resolution. So why does this work?
It's because our brains are wired for stories, not spreadsheets. As a researcher, I actually do love spreadsheets. I love them a lot. But stories are memorable. Like, people can maybe hear it, they can connect with it. So when you tell a story, you're moving from presenting abstract facts into a tangible kind of tangible feeling in the room.
So I was off at a recent parent teacher interview with my with my child, and I saw this up on their wall. The class was learning how to structure stories, and they were using this particular story structure of opening, build up, dilemma, close, and resolution. Now you probably recognize this because it's used a lot in dramatic structures, right, of movies and novels, and it's great for building up tension and releasing it over time.
But in a business context, we'd rarely have the time or maybe the need sometimes to get to that level of detail. So we need to our audience, particularly the executives and decision makers, don't have the time or the need to to hear extended stories, So we need to get to the core messages quickly and clearly. So a condensed version is this, situation, conflict, and resolution.
Think of this kind of executive summary of a story. And it's a really efficient way to create that emotional connection and could deliver a key message without losing audience attention. So we start with the situation. Make the user the hero. Who's our user? Give them a name or a persona. What are they trying to do? Now this helps to ground the story in a human experience, not just in features or metrics.
Now the second one is conflict. This is a conflict the user is facing and in how it affects the business. Now the conflict at this point, we should always connect back to the business. This is the most critical part. The user's problem isn't just a usability issue. It's a business problem. Is it about causing churn? Is it by increasing support calls?
Is it risking a strategic goal, or is it damaging our brand? You must state this link explicitly because our our executives and business stakeholders, they don't have the time to make that link, so you need to do it for them. This is also the point where we use evidence to show, not just tell. So this conflict section is where you bring in the data. And can I just say how much I love it when we have qualitative and quantitative data coming together to really do this particular point? So don't just say it was frustrating.
You wanna show it. Right? So is there a fifteen second clip you can show? Is there a fantastic quote you can put up on the wall? Is there stats you can use? For example, seven out of ten users fail at this point, and that's really impactful. So nothing tells a story better than the user's own words, supported with kind of scale of the problem through our quantitative data. Now the final one is resolution.
The resolution must be actionable. A story could just come end with, oh, users are frustrated. This is gonna go, well, okay. So what? The resolution should be the key insight that points to a clear next step, and that is that kind of moment that provides a solution. So for example, I'm looking going going back to the childcare one. This is David.
It wasn't my actual username. I've met a whole bunch of different users. But David, he's a dedicated childcare provider. He spends most of his evenings every night having to rekey the the data manually. And it takes for him a few hours. And he does this after a long day of running a child care center. He's really frustrated with that kind of double handling.
You can see the forms, some of the forms there. This was back quite some time ago, lots of forms. This has resulted in a number of accidental data errors, and these errors can expose our department to significant fraud and reputational risk. So if we can find a way to streamline his data entry process, we give David his evenings back, and we protect our department.
Now we now turn a user complaint into a business case of risk reduction. Now storytelling isn't just sorry. It's just as powerful when you have a sticky number. I was working with a researcher who was working on a range of application forms project, and the business had a very limited bucket of funds. The project to improve the forms was down the kind of bottom of this priority list, so it's seen as, you know, housekeeping. Now the business had to decide where they were going to invest the next sort of bucket of funds.
The forms project was seen as, look, because it's just housekeeping, we'll kind of get to it when we get to it. But the user researcher uncovered a staggering piece of data. Less than 1% of application forms were submitted right on the first go. That is a 99% failure rate. Now this wasn't just a user a user problem.
It was a massive quantifiable business problem now. To think of the wasted time wasted time and effort required from our staff to go and chase us up, you know, reprocess the form and the costs. So this story wasn't just, let's fix the forms. It was, we have a ninety nine percent failure rate in a key process that is costing us hundreds of hours.
Here's a huge opportunity to improve efficiency in your branch. And that project immediately shot up the priority list. So by telling a story that's backed by one shocking metric, the researcher turned this low priority project into a risk irresistible, I I like to think, high impact investment. And the way she presented that number is a perfect example of a key communication principle.
So Chip Heath, you might have read the book, the the book Made to Stick, he and Karlsruhe puts it this way. If you think you have a statistic that says something important, skip the middleware. Say the important thing directly. You want people to see and feel the numbers, not just read them. And this is exactly what the user researcher did.
She didn't bury the lead. The middleware would have been his 10 slides of methodology and context, which by the way, as a researcher, I love that stuff. But for our business, you know, maybe less so, she got straight to the point. She skipped the middleware and said the most important thing, was 99% of applications fell on the first try.
She made executives feel the scale of that impact, and that's the difference between just reading a number and truly understanding the impact. So once we have those powerful stories, whether they're quantitative or backed by a killer statistic that people can really, you know, feel, this brings us to our final skill. That's proactive alignment seeking.
This is a skill that truly changes the game. It's like playing detective in your organization. You're trying to hunt for the connections between your work and the bigger strategic picture. So this elevates your role from that kind of reactive insight provider where somebody asks you a question and you respond, I feel a bit like chat, GPT, to someone who's a proactive strategy enabler, someone who really helps the business achieve its goals.
It helps to really build credibility, and it really helps to deliver value for both our business and our user. Now this isn't a solo sport or or a solo mindset. It's really all about initiating conversations and making the alignment a team sport. I'm gonna walk you through four specific collaborative activities you can use. The first one is about getting ahead of the risk.
Before a big project kicks off, get the PMs, stakeholders, your team. Get them into a room and run an assumption mapping workshop. And the goal is simple. We want to identify all the assumptions a project's success relies on. You can ask a big question, which I mentioned earlier. For this project to be a huge success, what must be true about our users in the market?
So this might reveal things like, oh, we assume that users will trust us with this new data, or oh, we assume that this is a high priority problem for them. Once you've these assumptions mapped out, you can then map it some kind of metrics. So here's one particular example where assumptions are plotted against the risk, high and low risk, versus the known evidence we have. So for example, if something falls into this place, where it's high risk and known, you might go, okay, let's create a plan to overcome that risk.
If it's known evidence, we've got good data, but we just it's a low risk, maybe we'll just defer it. If it's high risk and it's unknown data, this is my favorite bit because it's about research. You know, we go, this is the bit we're going to go do some research. If it's low risk and unknown, then you want to evaluate your knowledge cause it might change your risk factors as well. So this activity merely positions you as a strategic partner.
Your role becomes clear. Design research to really validate or invalidate those kinds of assumptions. You're no longer just doing research. You're de risking a business investment. Now second activity you can do is running it's something you do after you do your research. You can run something like an impact insight to impact mapping session. So instead of just presenting your findings, invite your PM and your team into a room and and run this.
So on a whiteboard or mural or mirror, you list all your insights on one side from your research. On the other side, you list your business goals or your team's KPIs. Then you then ask, look, we observe this particular user pain point. Which of our team's KPIs does this directly impact? Then as a group, you draw a line between the insights to the particular goals that you're meeting, and you just keep doing that.
And you can also if you want to look at things that are indirectly related, you can try that and just use a dotted line. So this makes alignment a shared responsibility. It's a powerful way to kind of bridge the gap between our user research and kind of the business strategy. So this kind of shared understanding really helps to explain why your findings matter. It transforms an interesting moment to that concrete plan.
And this is where the whole team come behind because they were part of this process of doing this. The third one is about building that trust and continuous feedback. If you schedule regular informal strategy syncs with your product manager or your business lead, this is a really great way to help build that kind of connection and relationship.
So doesn't have to be a it's not a formal presentation at all. It's just a casual coffee chat, and it's like, you know, it could be fifteen minutes, thirty minutes. You can do it on a regular cycle. The agenda is simple. You just ask, what's the biggest question you have about our users right now? And what's keeping you up at night about our quarterly goals? In return, you start to share some early signals from your research as well. And this channel of influence is actually a really interesting way because you get to hear about strategic shifts that could impact your findings, while also you're giving back and sharing your insights early before they're fully baked.
Now the fourth one is one of the most powerful political navigation skills you can build, and that's recruiting your champions early. Now this is called a pre wire. The idea is simple. Before you present any findings that might be controversial or sensitive to a large group, you schedule a brief chat with the key influencers. You give them a sneak peek of your most important insights and your recommendation. So why is this a game changer?
A former boss once told me, Ruth, no one wants to be surprised or look silly in front of a room with their peers. So this pre wiring does two things. First, it shows you it respects their opinion. It gives them a safe space to ask questions and raise concerns without feeling that they're being put on the spot.
You can hear them out and refine the way you present your findings back. The second, and most importantly, is that it helps tenders potential critics into co owners of your insight. So, you know, you really go present your big foot your findings to the room, and you're gonna get somewhere and go, hang on, you know, what about blah blah blah?
That person might actually hop in and go, oh, that's a great question. Ruth and I were just chatting about that, and we think that the way to approach this so this really helps, you know, you you create a powerful ally. You can now promote your work on behalf of you. So think for your next big presentation. Who's that one person in the room beside that key decision maker who is who might you know, whose opinions, sorry, that will carry the most weight? It may not be an executive person.
It could be an engineering lead. It could be the finance person. Maybe someone in the marketing division. Think about that and schedule that free wire in. So your we we try to you bring all these activities together. You're making assumptions sorry. You're mapping assumptions, connecting insights to impact. You're syncing a strategy of recruiting your champions.
The result is that your work gets framed in a completely different way. For that childcare one, went just talking about, here's my discovery funding from childcare attendance project. It was my getting mitigating risk and reputational risk, key opportunities in the attendance process. So after all this, what are we aiming for? It's this, the sweet spot about what where our users' needs intersect with the business needs.
And these three skills we just discussed of business acumen, storytelling data, and proactive alignment are the keys to help unlock this space. And this is where we move from just being UX folks to being indispensable strategic partners. But I know getting there isn't a straight line. So as you're thinking about this and thinking about how could you apply this, you might go, well, I might have some challenges.
Here's some common ones. What if I don't know the business strategy? That's okay. I don't either I do this one. I just go I go and ask. I asked the product manager. I said, oh, what's what's the primary business goal for this particular project? This doesn't make you look uninformed. It makes you look engaged and curious and strategic.
It's a question they love to answer. Also, you can go to your organization's website. I love looking at the about us section. It always has, like, the company annual report. I know it sounds boring, but it really does give you a sense of what your company is up to. But what if it's not my job? I'm a researcher, designer.
I'm not a strategist, and also, I feel like I'm stepping on my PM's toes. Now remember, this is about partnership. We're not overstepping. You aren't trying to be the PM. You're trying to be the most valuable partner in this process. You can go to PM and say, look, I think this user insight directly supports that business goal you mentioned.
How can we use this to strengthen our case? So you're not taking that job. You're giving them strategic ammunition, and no good PM will say no to that. But what if I can't connect my findings to a hard metric like revenue conversion? It's more about user frustration. And that's a great question because not everything ties back to a hard dollar, and it's particularly relevant to people like myself and my and people who work in government and not for profits, where not everything comes back to a to a dollar or revenue.
Sorry. But there's other factors we can look at. My favorite one, mentioned a few times today, is risk. Can your insight reduce the the risk of building the wrong thing? Second thing is around confidence. Can your insight increase the team's confidence in the decisions that we're taking? How about other business currencies? Is it something around saving internal time, improving the brand perception, or increasing customer satisfaction? These are all valid and powerful forms of business value. So when you navigate those real world challenges, you create a transformation that might look like this, where you go from a simple easy to dismiss finding to the left to a bit more of a strategic recommendation on the right, acknowledges the user's pain, but frames it in the context of a shared business goal, and that is the language of influence.
So the ultimate impact of making this shift is that you help your organization make better decisions. Just decisions, not just about what to build, but what not to build. Because great strategy is just as much for what you decide not to do, it is what you decide to do. And your insights, when framed in language of the business, are the key to making those tough decisions.
So as we wrap up, I want leave you with one challenge for next week. We don't want to boil the ocean. There's a lot to do, and we don't we can't change everything all at once. But next week, I want to find just one insight from your work. I want to reframe it using one of the techniques you learned today, and I want to share it.
I want to see what happens. And that's how this shift begins. Thank you.
People
- Chip Heath
Technologies & Tools
- Mural
- Miro
Concepts & Methods
- user-centered design
- business acumen
- storytelling with data
- proactive alignment seeking
- KPIs
- situation–conflict–resolution
- qualitative data
- quantitative data
- assumption mapping
- insight-to-impact mapping
- strategy syncs
- pre-wiring
Organisations & Products
- Propel Design
Works
- Ted Lasso
- Made to Stick