12TB of AI coding agent logs – what works, what fails
From Token Maxing to Token Efficiency
The speaker opens by describing how the talk's focus shifted dramatically in recent months as the industry moved from 'token maxing' (parallelism, sub-agents, Ralph loops) to 'token efficiency' due to organizations suddenly facing real bills. He explains how companies like Cursor and Anthropic are pushing users off unlimited subscriptions onto per-token billing, causing costs to spike unexpectedly—sometimes seven times overnight.
The Budget Shock for CTOs and Organizations
The speaker discusses the emerging financial reality of AI coding tools, noting budgets approaching $100k per developer annually. He explains why this is difficult for CTOs to manage, comparing it to early cloud computing challenges where developers control spend unpredictably, making budgeting and capping usage equally problematic.
Data on Token Burn Across Organizations
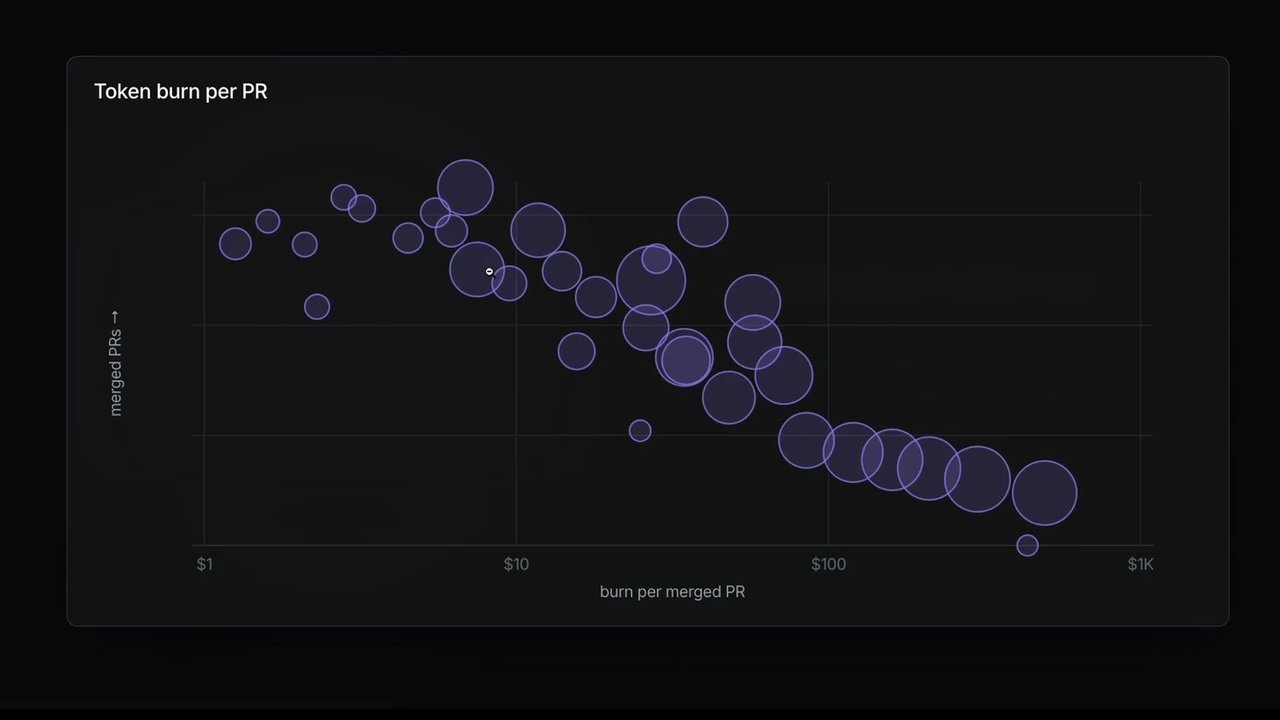
Drawing from anonymized coding log data spanning terabytes of information, the speaker presents metrics on token spending per developer and per pull request across organizations. He highlights that smaller, more frequent PRs tend to be more cost-efficient, and that higher PR volume correlates with better AI engineering efficiency.
Cost Per Line of Code and Finding the Sweet Spot
The speaker examines how cost per line of code changes dramatically with PR size, dropping from about 80 cents per line for small PRs to a fraction of a cent for large ones. He argues there's a 'sweet spot' between overly small agent sessions and excessively large ones, and emphasizes the importance of developers building intuition for their tools.
Context Rot, Frustration, and Tool Differences (Claude vs Codex)
The speaker explains how Cadence measures context rot through developer frustration signals (like swear words) and tool call failures as sessions grow longer. He notes a statistically robust finding that Claude tends to frustrate users and degrade context more than Codex, which handles compaction more gracefully despite Anthropic's larger context window claims.
Planning Beats One-Shotting: Success Rate Data
The speaker presents data showing that sessions involving upfront planning and back-and-forth with agents have significantly higher success rates than 'one-shot' attempts. He reinforces the now-common best practice of planning before implementation, based on Cadence's session outcome analysis.
Hidden Costs: System Prompts, Skills, and Wasted Tokens
The speaker reveals that initial context—before a user even types—can consume up to 50,000 tokens due to large system prompts and accumulated 'skills,' many of which go unused. He estimates that customers collectively waste billions of tokens weekly on unused skills and MCPs, urging developers to audit and delete unnecessary skills to cut costs and environmental impact.
Best Practice Workflow: Plan, Implement, Review Tests, Push to CI
The speaker outlines an emerging best-practice workflow: extensive planning with the agent (often an hour or more), delegating implementation (potentially to smaller or local models in the future), reviewing tests rather than every line of code, and pushing to CI for parallelized, larger-scale testing. He stresses that guided human review should focus on key decisions and important code changes rather than exhaustive line-by-line review.
Closing Remarks and Cadence Product Pitch
The speaker wraps up by humorously mentioning an AI-generated coupon and QR code for his product Cadence, which offers token and cost tracking, personalized developer recommendations, and PR review tools that analyze both code and the sessions that produced it. He invites attendees to follow up via LinkedIn or in person.
I started looking at this talk a few months ago in the distant past of, like, February this year. And things were completely different then. So, it's almost entirely different to what was just introduced. Remember token maxing? Remember when we all used to be token maxing? And that's what I was going to talk about. I was going to talk about what we see in our data around parallelism and sub agents and using Ralph loops.
I know Jeff's here somewhere. And slash goal, magic dynamic workflows, you know, getting a gas town going, whatever. Like, some of the stuff we see in our data, token burn has only been going up. And yet, the meta seems to have changed, so the whole thing had to change in, like, the last week. Turns out we're not doing token maxing anymore.
Now we're doing token efficiency because suddenly people are getting bills. It was fine when we were on subscription, and it was unlimited. And we're kind of not anymore. Everyone's being moved off it. I mean, yeah, Copilot. No one was using Copilot anyway, but Cursor is starting to call people and say, actually, you're not on subscription anymore. You're now on PerToken.
We know Anthropic are pushing people. OpenAI may be a bit less. But it goes up super fast. All of a sudden, people are spending six times, eight times, 10 times as much as, hearing about an organization yesterday which accidentally got bumped across to, from Claude Teams to Claude Enterprise onto per token billing, and suddenly the bill went up seven times overnight.
That's not ideal for a lot of people. The budgets that we're seeing out there when we're talking to people, maybe we're gonna be spending pretty soon 100 k a year per developer on tokens. Significant fraction of a salary. Right? This is scary for people seems to be scary when I talk to CTOs who have budgets that they have to hit.
Because similar to, you know, ten, twelve, fifteen years ago in the early days of cloud, devs control this. You kind of can't get really good control from the CTO's perspective. It's really hard to know how much you're going to spend this month. Because it depends on the developer and if they leave something running and if they get excited about their new orchestration framework and start spinning things up.
But also, you kinda don't wanna give them a limit. Because if they hit the limit a week into the month, what do you do? Do you tell them not to work for three more weeks? So it's actually gonna be a really tricky time, I think, for a lot of organizations. What we're seeing at the moment and this is, again, from our data. This is anonymized, obviously.
This is the kind of burn per dev, that we're seeing across organizations. The size of the thingies is how big the org is. Spending between $1.02 3 k in tokens at the moment per dev. And this is not this is also including people who are on subscriptions who aren't paying for it. So this is how much they would be paying at API prices.
Obviously, bunch up towards the high end of that, up towards $6.08, 10,000. I'm really interested to see then, what happens once everyone switches across. Now, where we get this data from is in a bunch of coding logs. So I'll talk later about what Cadence does, but these are real coding logs that we're seeing coming out of tools that we assess across a whole bunch of different tools.
Terabytes a lot. Well, is it terabytes? Of course, when I put the presentation in, I didn't know how many terabytes it'd be. It looks like it's about three and a half right now. So we'll do a little bit of a vibe check, and I'll give you some insight that we get out of these to help us understand how to maybe token min a bit or be token efficient, whatever we decide to call that.
One metric that people are using I mean, every metric's imperfect, right? But some are useful. People seem to be looking a little bit at, at burn per PR. How much are you burning per pull request you're actually putting in? Interesting to see, I think, that it's clustering, you know, sort of between the $10 and $100 per PR, maybe.
We see this is the size of the PRs. The size of the bubbles is the average size of the PR that an organization might be doing. So what you kind of see is that smaller PRs are cheaper, not super surprising. Bigger PRs are probably more expensive. But also, this is the volume of PRs. You see that orgs that are doing not as many AI PRs these are just the AI PRs that we measure with the tool, not all of their PRs if they weren't AI assisted.
When the people are doing less PRs or fewer PRs, they seem to be less efficient with them, less effective with what they're actually doing. So probably, high volume of PRs helps you get good at it, helps you get good at AI engineering generally. It's probably not super surprising. What you're aiming for, of course, is this little middle band where you're doing relatively big PRs but at a relatively cheap cost.
One of the questions that arose from me then when I was looking at this data is about how much it was actually costing to make a single line code change. The relationship turned out to be actually a lot cleaner than I thought it was going to be, because we know that, you know, every session has fixed cost.
Actually, I'll talk in a little bit about how much initial context gets burned before you even start typing. But we know that there's going to be some context loading, and you're going to have to plan a change a little bit. It's got to explore a little bit to find where it needs to work, readagents. Md, etcetera. So how much does the cost per line change?
Well, what we find generally, obviously, it gets cheaper because you can amortize that cost across more lines as things get bigger. But it gets cheaper by kind of a really large amount. It sort of surprised me that when you're doing small small, pull requests with small lines of code changed, it might cost you 80¢ per line of code that you're changing.
And big ones might cost you more like, in this case, point 3% point 3¢. I mean, yeah, it's not quite that simple. Right? As I said before, all metrics are imperfect, but some are useful. I don't know if this one's even useful. I just found it interesting. But, obviously, as we know as developers, you spend a lot of time on a three line bug fix, finding where those three lines are. Obviously, that might be encoded into this data as well.
But generally, there's probably a sweet spot here. There'll be a sweet spot between spinning up a whole new agent session to tweak the color of a button. And potentially, the other end is working for a very long time and making a huge ten, fifty, 100,000 line change set in a single agent session. Neither of those are probably ideal.
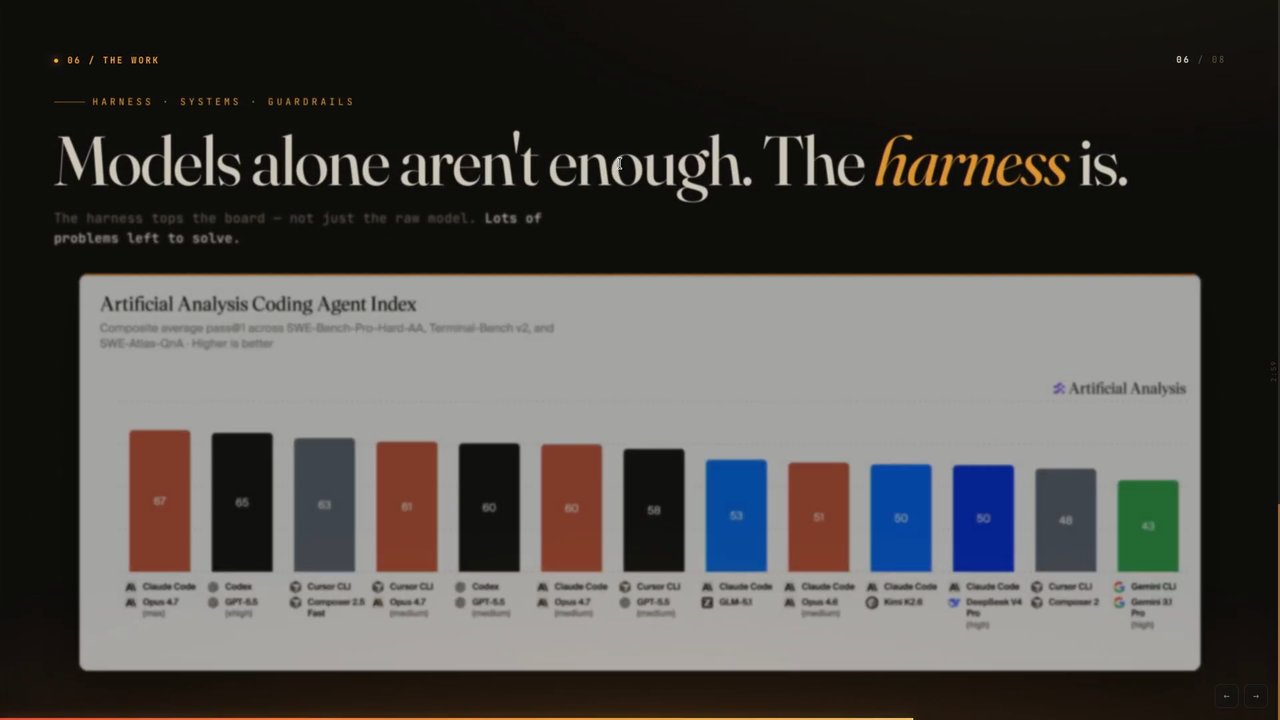
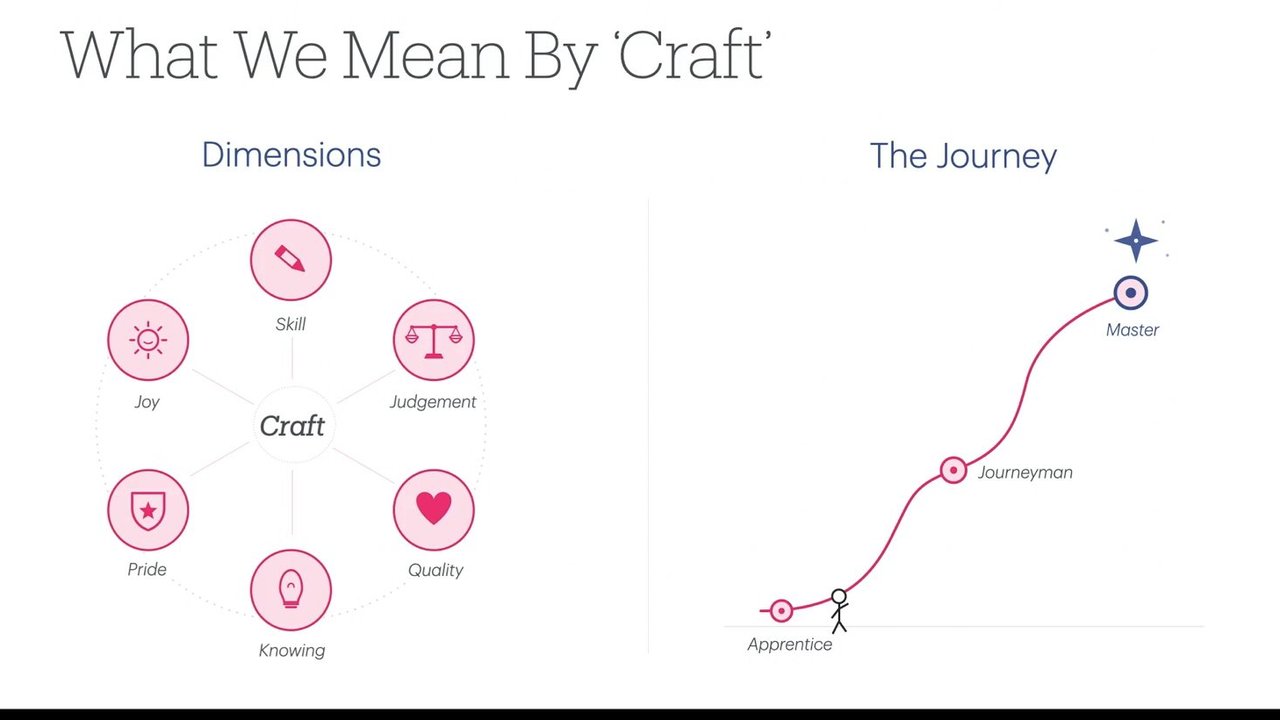
They're somewhere in the middle. And I think one of the themes that comes through to me when we work with teams and when we work with these tools ourselves, a lot of what we need to do at the moment as developers is find the grain of the tool, find how it works for us, find the feel of it, start building our judgment around what works and what doesn't in particular situations with our tools of choice. I mean, look, honestly, they're all pretty similar.
I we all have personal preferences. I plan with Claude because I hate the way Codex plans, but I kind of hate Claude's code, so I use Codex to write the code. And they both, of course, adversarially review everything the other one does because then they can argue, which is fantastic. But generally, you know, finding the sweet spot, I think, is probably important. I think we see this here as well.
One thing we can measure is context brought as sessions get bigger and bigger. You can sort of see how much context is running. There's two ways we measure that. We look at each individual session. We're looking at frustration rates, how annoyed the developer gets. This is something which was also in the leaked, Claude CodeSource a couple months ago. Swear words.
But also, there's some language patterns that we can see when we look across enough sessions, there's some language patterns that we can see where the developer getting frustrated about, how this session is going. That is often a sign, we've noticed, of context fraud or of, you know, the session getting too big and getting off track. The other thing that we can see there is, tool call failures.
Because one thing another thing you see with agents is that as a session goes longer and they've compacted a few times and they've started forgetting things, they'll start forgetting how to use tools, especially when they're repo specific. They're probably not gonna forget how to use GH, CLI, but they're gonna forget how to use repo specific tools, especially if you have wrappers around tests, whatever.
So you start noticing that as sessions get bigger. Now, this this end of the graph is really big. Right? Like, this is a 100,000,000 token session. We're not doing too many 100 clearly, there's some in the in our data, actually, so people are doing it. But generally, you're not gonna want to do too many 100,000,000 token sessions. But even as this gets goes along, you see that it increases over time. We know that that's again, this is about finding the sweet spot. We know that it's gonna get, everything's gonna get harder as you put more into the context window.
One thing that we find interesting here, and this this is statistically fairly robust. It's been the case for a while for us, is that Claude tends to frustrate people and tends to rot its context more than Codex does. Something I've noticed personally, I'm very unworried when Codex compacts because it does a really good job of compaction.
Whereas with Claude, even with the Million Token context window, which I don't believe, Well, I do believe, but it's using we know it's using selective attention, so there's reasons that it's not a full million tokens. Claude Compaction is still pretty messy, I reckon. It seems very strange to me, actually, that two massive companies that OpenAI getting it pretty right, as far as I can tell, and Anthropic probably still aren't.
But it's pretty also pretty clear in our data. So again, we're trying to find the sweet spot on that when we're trying to when we're using the tools and finding the grain of the tools. This is a big, important point, how big things are. Another important point that comes up, of course and we're all doing this. I'm sure everyone in this room, no one's one shotting things anymore, except sometimes when you get a bit lazy.
But generally, you're going to plan up front. We can see that again in the data. We measure a thing called success rate of sessions, what we're looking at when we look at sessions. We get an LLM to do a tiny bit of analysis of them afterwards to understand if that session actually achieved its outcome, if it created the PR or fixed the bug or whatever that might be. Those success rates are fairly robust.
And what we can see is that, you know, in this case, the baseline here is non one shot. It's when people do some planning and they go back and forth with the agent and then they let it start implementing. For one shot, there are fundamentally lower success rates. It's really clear in the data. We probably all know that ourselves.
That doesn't mean we don't sometimes we're a bit short of time, and we just say, hey, do the thing, And then it doesn't get such a good result, and we get frustrated with it. But the obviously, the take home message from this one is that you should be planning. Again, I think everyone probably knows that at this point.
I'll talk a little bit later about what this implies about the the right work flow that we see out there. I said before about, initial context, the context that a that an l that an agent or a harness imposes on you before you even type a key. Some of it's your fault, and some of it's the agent's fault.
Again, this is an interesting difference, I think, between Claude and Codex. We know that Claude's system prompt is bigger. And that's really something we see pretty clearly in the data that at the moment it's only been getting bigger over time, especially with 4.7, 4.8. This is open sessions only.
It doesn't include Sonnet and Haiku. But we're getting up to sort of 50,000 tokens in your context window before you type anything. Now partly, that's a system prompt. So you just got to be aware of that. And yes, they've given us a million token context window, so maybe it doesn't matter so much anymore. But also, skills in MCPs no one we see very few MCPs in our data, actually, these days.
But skills, feel very lightweight to install. And so we see people with 100 skills getting pulled in. And each one has to have the description. It has to have a small amount of metadata. And that's burning some context burning some initial context. We're up to 15% -ish of, of initial context being skills. Generally, most of them aren't used, especially at the moment.
We see in most recent data, it's like 60% of of skill, the tokens that are burned on skills and MCPs are just not used. That's dollars well, if you're paying per token, that's dollars that you have literally just wasted. They're gone. They're never coming back. It's also environmental impact. It's also, you know, power. It's it's all those other things.
We suspect that there's probably some tidying up to do in a lot of people's, a lot of people's infra, a lot of people's local setup. It's probably time to do an audit of your skills. If we look across all our customers, there's probably as of last week this week's a partial week, so hopefully, it'll be even higher.
But, probably wasting 5,000,000,000 tokens last week across all our customers, that feels like I mean, I I know there's I saw Mal earlier who's a a dev from NVIDIA. I'm sure they're very happy about it. But the rest of us may be may be less so. So have a look through your skills. I guarantee there's some you're not using.
Just delete them. I'll go through this quickly. So this is what this implies about what we need to do. And we see this across customers. This isn't so much from the data, but this is from conversations that we have with people, and this seems to be the evolving best practice. You plan with the agent.
As I said, we're all planning except when we're not, but we are all planning most of the time. You review the plan in detail. That's probably 80% of a developer's job these days, is understanding the plan, understanding that the right decisions have been made, going back and forth with the agent on that. Our general recommendation is that and what we see in with the, savvy developers for a bigger feature, you're probably planning with the agent for an hour or an hour and a half or maybe two hours. It's a long time.
And it feels like a long time when you first transition to it. We've definitely an org that I was in a couple of weeks ago who are just moving across to AI coding, they were feeling really weird about just sitting there talking to the agent for that period. But that's the job. That's a huge part of the job being a developer these days.
And then you send the agent off and it implements. What I where I suspect we get on that and thanks to Simon, we now know how to run local models I think probably in a year or so, those tokens because implementation generally needs a smaller model. Not that most of us switch. We can switch to Sonnet. We can turn codecs down.
We usually don't. When we're paying for tokens, we will have to start doing that. Or we'll be running local models, I suspect, whether they're local on our machine or whether they're somewhere else. What I don't know yet is if we're running local models on our M6 processor in twelve months, whether our companies are gonna be paying for the electricity when our power bill goes up $100 or $200 or $300 a month.
It's not clear to me how that's gonna play out, actually, but I suspect implementation will be done by local models more than by the big models in the future. One thing that we think is important that we haven't necessarily seen talked about that much is reviewing the tests. I don't think you, the developer, have to review every line of code. I do think you should review the tests.
You end up with very big test suites, if you let LLMs write every test they want, Very big and ineffective test suites. They love writing unit they love writing every test, but especially unit tests. And unit tests fail very infrequently with AI generated code. So I reckon you want to understand the test. You want understand, is testing the right thing?
Test architecture is probably as important as it's ever been. Push to CI should have a bunch of automated review happening in CI. In fact, ideally, you only run targeted tests locally, which is quite quick to run and for the agentic loop, and then you push to CI, massively parallelize it, and run your bigger tests in CI, I think that's generally seen to be a better way of doing it. Because then you can have a lot of end to end and and, other big heavy tests, integration tests, But you can run them quite fast because you're allowing that to happen in CI rather than relying on a local machine.
And then guided human review. When I talk about that, that means what you're aiming to review here is the code the important bits of code, not line by line, but the important bits and the decisions that were made during that that change set. That's you need a tool to highlight that. That's one thing that we do with Cadence.
I'm out of time. Feel free to grab me afterwards to talk about any of this. My marketing agent, Claude, told me to create a coupon code. So if anyone wants to sign up, and a QR code, actually. I think the QR I actually didn't test the QR code. Someone tell me if it works. But first month free, I'm sure that'll be amazing.
I mean, if you get an agent to create a QR, that sounds programmatic. That should work, right? Surely, what could possibly go wrong? We do token and cost tracking across tools, so we're helping with understanding where the tokens are going. We're giving developers individual tailored recommendations. Your boss won't see your sessions, but your sessions, drive recommendations for you. And as I said, the PR review thing is understanding what decisions were made there, understanding which bits of code are most important, because we review not only the code, but the sessions that created that code in conjunction.
Or just hit me on LinkedIn. Always happy to chat about this stuff. Thank you.
People
- Mal
- Simon
Technologies & Tools
- GH CLI
- Million Token context window
Standards & Specs
- MCPs
Concepts & Methods
- CI
- Compaction
- Context rot
- One-shotting
- PerToken billing
- Ralph loops
- Selective attention
- Skills
- Success rate metric
- Token efficiency
Organisations & Products
- Anthropic
- Cadence
- Claude
- Claude Code
- Claude Enterprise
- Claude Teams
- Codex
- Copilot
- Cursor
- Haiku
- NVIDIA
- OpenAI
- Sonnet