How to build 5x faster electron apps
Hey, my name is Amila, and I'll be talking about how to make Electron apps five times faster.
Let's get started.
So when people often think of Electron, they often think of slow performance and apps that just don't match native performance.
And this comment really sums that sentiment pretty.
To talk a little, before kind getting into what I wanna talk about though.
Let me share a little bit about my background.
I've been an open source maintainer of Electron-react-boilerplate for the last seven years.
I previously worked as a performance engineer at Amazon.
And prior to that, I worked as a software consultant, optimizing Electron applications.
So my focus has really been Electron and, optimizing Electron.
Now what does five times faster mean?
What are we comparing this five times against and how does it all work?
So what I five times faster, we're comparing against an application that performs none of the application-none of the optimizations that I'm mentioning in this talk.
So it's an application that has none of these optimizations versus an application that has all of the optimizations made.
so when and the context like what kinds of applications this metric really works for is like large applications, that have some level of scale.
And that's the, these are really the kinds of applications that we're talking about.
And Electron is really all over the place.
It's not exactly like what, a niche it's not very a niche technology.
It's used.
By many teams by many products that you've definitely heard of before.
Everything from VSCode to Skype, to Figma know, Notion many, products use Electron.
But when it comes to Electron and performance things aren't always very easy.
It's very easy to load a lot of JavaScript to block the main thread and to yield a not so great experience especially compared to native.
And Brad Frost summarizes this really well.
Notion 'if Notion and 1Password stop working on all new features and focused exclusively on making software easier, I'd be pretty happy'.
And I resonate with this very well.
Performance is really a feature and we need to start focusing more on, on building apps that are performant out of the box and rather than optimizing them later how do we build a strong foundation for applications on a for, Electron applications?
He, isn't the only one who has that sentiment.
In fact, many other users have complained on multiple occasions.
It's pretty easy to find these kinds of user stories.
They're really all over the place.
Every, they from like Slack, which Electron application to Notion Discord, et cetera.
There's, many applications that suffer from performance issues.
Now.
All of these applications are, all Electron based.
They're all single page applications built with Electron but Electron isn't exactly the issue here.
It's actually very similar to Chrome when it comes to performance.
And and, this general architecture.
And so it wouldn't make sense if Electron was a lot slower than the Web apps that people are already using in the browser.
It should be pretty similar when it comes to performance.
When compared to the, regular Web that we all know.
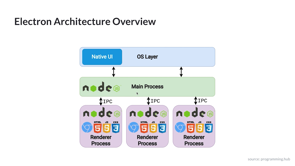
Architecturally it's exactly, it's it's architecture is exactly, pretty much exactly the same as that of, Chromium.
And in fact, Electron is really just a slimmed down version of Chromium plus Node embedded Nodes.
It's architecturally very, similar with the addition of Node in the render process and the main process.
So here each render process has its own process separate from other renders.
They all kind of proxy events to the main process.
And the main process makes direct calls to the underlying operating system.
And really like blocking any of the, any of these processes will trigger jank in the application.
If you, for example, like, all click events are actually sent through the main process to the operating system.
So for example, if you block the main process, then render a processes that, that proxy click events through the main process will actually block the entire, the entire rendering of the entire Electron instance.
So that's obviously not good.
But at a high level, it's very similar to Chromium or the open source varient of Chrome, and so it should perform similarly.
Let's look at two principles that are really the only two principles that you can use when it comes to optimizing anything really.
The first principle is minimize work not done.
And the second is minimize blocking work.
So what exactly do I mean here?
This is a visual that really summarizes this pretty elegantly and puts it, makes it pretty intuitive.
So when you have blocking work, you have serial tasks that execute one after another and they aren't parallelized.
This is the worst case scenario.
The-what you're really trying to minimize is the duration of blocking work here.
If you can find a way to somehow run the, these tasks in parallel and potentially interleaving them then that would minimize the blocking work, If you if, you maximize the number of interleaving work that's occurring.
The second principle here is, pretty straightforward as well.
Maximizing the work not done means eliminating all the potential work that could happen.
So whether that's through caching, through memoizing or just algorithms that leverage clever heuristics that eliminate work that, that doesn't need to be done.
So these are really the two main ways, but when it comes to startup time, when it comes to an Electron performance and specifically startup time, which is what we're focusing on here, minimizing blocking work is, really what we should be focusing on for the majority of things.
Because startup costs, Electron startup cost isn't exactly memorizable, it's hard to minimize work that's not done.
It is possible to memoize certain things.
But for the vast majority of optimizations, minimizing blocking work seems to be really effective here.
Now, oftentimes, like, single page applications can see a 3X speed up just by using a bundler really.
And, 3X is actually pretty conservative.
Compared to raw just vanilla JavaScript, no bundler, using requires, things can be really slow.
So especially like when you, and also like when you look at native apps that get that, that often get performance, right, everything is localized.
All icons are, are load locally.
All the code that's being executed is, is compiled and, shipped with the application.
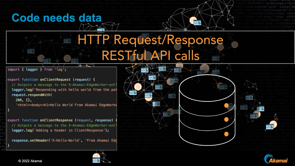
This is not true for all Electron applications.
There are actually many applications that fetch JavaScript code remotely and icons remotely.
And they're architectured as are really, as web apps or apps that are really running in a browser.
And they're just fetching content remotely, rather than being local first and leveraging local assets.
So this is really not great for performance.
Another pitfall of requires is that it's recursive and your dependency tree could be arbitrarily large.
And this is really terrible for performance, especially for, startup performance, which is where requires often take place.
Here's actually a case study of Atom, the text editor which you may have heard of if you've been around for some time.
It's, it historically has, used require as its dependency loading mechanism, rather than maybe something like AMD or Webpack.
And everything was required recursively and that was pretty detrimental for startup performance here.
They are using on load to defer some of the requires, but the majority of it is happening in the initialization phase here and also here as well.
And this is 300 milliseconds of just require.
So this is really not great.
So what you can do is you can use a few solutions that make Webpack integration with Electron pretty easy.
electron-react-boilerplate is the first one, which spoiler alert I maintain and [pretty nice?], but electron-next is another one, it uses nextJS and Electron makes that integration pretty easy.
And electron-forge.
So those are a few great three options.
The second method for improving Electron performance by 2X is to snapshot everything ahead of time.
This is essentially JavaScript ahead of time optimization.
And this is, we can see pretty impressive results with this.
And in fact, actually the Atom team made Atom's startup time 50% faster.
So this can be pretty impactful.
Let's dive a little bit.
Now V8 snapshots, essentially what they do is they-so so V8 exposes some functionality which can take JavaScript code and it can snap, it can generate bytecode ahead of time.
And you can do whatever you want with that bytecode.
And you can actually rehydrate in the, you can rehydrate global variables from that snapshot.
So what we can do with this is we can define JavaScript code that we're going to load at run time as a global, and we can redefine that global from our snapshot accordingly.
There are a few tools that can help out here.
So v8-compile-cache, this is actually a little bit different.
This is, this makes the integration really easy, but it's not ahead of time.
This is dynamic caching of V8 code.
So on require whenever a require cal is made, in other words we with v8-compile-cache, we register a require hook that will hook into the require call-it will cache the code that was required and it will reuse it later on, on subsequent requires.
So this is one option-works with Node, works with Electron.
It's pretty great.
What we can do though, is we can use other tools like electron-link, and make a snapshot to generate snapshots ahead of time.
So we don't even need to even, memoize them, like we could with v8-compile-cache.
So here's here's a little bit about what electron-link does.
As you can see here, this is like code before the snapshot and this is code after the snapshot.
And what a link, what electron-link does, is it generates valid snapshottable JavaScript code.
So there are certain limitations that V8 snapshots come with when there's only certain kinds of JavaScript code that can be V8 snapshotted, and electron-link essentially generates compatible, JavaScript-that's pretty, pretty helpful.
Here's a code snippet of code that is, is load.
loaded via snapshot.
I have a render.js file, which exports a render function.
This is a like React's render function, and we actually don't even need to and...so here, like we, we actually don't even need to dynamically compile React or any of the code that, that you would expect usually with with React code, maybe like react-router and things like that.
All of that code is actually cached, compiled and ahead of time.
And we just rehydrate that global, that as a global.
It's pretty awesome, what we can do with snapshots and you can see a 2X performance boost from there.
The third thing is a 20% increase from, roughly a 20% increase from, in performance, from tracing and profiling in production.
So teams that have experimented with tracing and profiling in production often see a 20% increase just by the amount of data that they collect.
And with the insights that they get from tracing it and profiling real user devices they, they get a lot more insight into how they can improve their, the performance of their applications.
There are a few products and teams doing this already.
So Slack is doing this internally and VSCode also does this as well.
And keeping a acceptable overhead of less than 5% is usually a, a...5% is usually considered like an industry standard for profiling in production.
But 1% roughly is it can actually be achieved.
Now Slack's internal performance APIs actually show how they do this.
So this, is a little code snippet from, Slack's internal code base.
... or, it and it's can be found just by inspecting Slack's, code.
And what they do is they have these metrics that they collect.
So CPU usage here, memory usage, even starting tracing.
Getting the number of DOM nodes, so all pretty important metrics when it comes to performance and they collect all this in production from real users.
So another thing that you can do with Electron is you can actually hook into Chrome's internal tracing mechanism.
V8 exposes tracing, each render process exposes trace events, main process-like you can get all of this information from content tracing which is an API supported by Electron.
So that's pretty sweet.
You can asynchronously start the recording and you can stop it.
And.
And all you have to do is you just upload the the trace from the path that it was written to.
You can just take that path and you can just beacon it to your Server.
So that's, pretty awesome.
It's pretty straightforward.
So let's look a little bit deeper at what VSCode does.
vs VSCode does a few pretty interesting things.
They hook into a lot of the Electron internals-app app.IsReady.
They, hook into that event.
They they, collect that data as well, but they also collect pretty interesting things as well, re requiring a critical dependency that could be potentially large.
The main entry point file, if you will of, VSCode, they capture, they measure the delta of that operation.
And and so yeah they, collect other pretty useful information.
Let's take a little bit deeper of a look.
Overall workload, workbench load so, all of these really critical experiences are all measured and are all sent to the team.
So here's what they do.
They actually have a slack bot that, that will alert the team in a performance channel of if there's any regression in any of those metrics.
So there's a real, there's like a real time connection between the customer, the end customer experience and what the team is seeing.
I think this is a really great performance culture that they have on the VSCode team.
And I think that this should be adopted generally.
So this is really great.
In summary use a bundler, localize assets, match what native has already learned.
There's a lot to learn there.
Snapshot JavaScript ahead of time with V8 snapshots, batch frequent work and defer expensive work and trace and profile in production.
These are really the four key ways that you can optimize Electron applications and they will, they can, they will definitely make your apps five times faster if you weren't using these optimizations ahead of time.
Or, if you weren't using them already.
So yeah.
Thank you so much for listening and hope you learned, hope you learned something.
Thanks.
Electron apps are on the rise — Figma, Notion, VSCode, you name it. These kinds of apps are often SPAs and are often slow and hard to scale. Here are 4 strategies I’ve used to make electron apps up to 5x faster.