Connected UX
Though design research has become common practice at product companies, it often produces insights that slip into the hazy distance as documents get lost on a hard drive, or ignored by someone in a different department. Worse still, efforts get duplicated when communication breaks down.
UX teams have design research down to a science, but few have discovered a way to connect qualitative and quantitative data, and long histories of research into a central clearinghouse that can be shared, searched, and maintained by different teams. Open access to information strengthens the connections between teams, and supports a general culture of inquiry. In this talk, Aarron will share with you practical methods to get off the research treadmill and get started building connections between data and teams.
The tools get us there, but it’s connecting people that’s important.
During the rebuild of Mailchimp they were doing a lot of “shooting from the hip” – guessing, really. So they started doing more UX stuff – interviews, testing (low fi, no fancy lab), collecting customer feedback (not always actionable, but it helped understand where the customers were coming from), using analytics to see what people were doing.
Suddenly they went from no data to data overload. They’d learn something then lose it – “we’d get smarter, then get dumber”. They’d learn something about a specific interaction or feature, then forget they’d done it because there was so much information to keep track of.
Aarron started seeing repetition of effort as they simply lost track of the information.
He noticed a pattern, shown as a pyramid: from all the raw data → some information → distilled to knowledge → but only rarely resulting in wisdom. Seeing the connections, understanding why something is happening and what will happen in future as a result. This is where strategy comes from, rather than living purely in tactics.
We need connections. We have research down to a science – we’re good at studying people, fixing specific problems. But we don’t connect the information very well.
Crisis point: Aarron’s inbox was buried in user feedback emails. It just didn’t stop. He talked to Merlin Mann about how to manage the information. He said “burn it! If you can’t process it, it’s not useful, not valuable.”
But rather than truly stop, he decided to get the information stored somewhere – at least get it out of the inbox. So he funnelled the starred emails into Evernote – starred being the ones worthy of later action. He got it down to a few hundred pieces of information, all with an attached email address.
Later on, he needed feedback about RSS. This returned a set small enough to make sense of it. He found some patterns. He was able to get further feedback from a small group; and they shipped a solution the following week to great reception.
The data can also determine what you are not going to do. They had a thought there might be a trend about a certain feature; but when they dug into the info, in several months they’d had just 11 mentions of it. It wasn’t a big problem and not really worth the investment, compared with other potential work.
With all the information coming in, they created streams. There’d be a stream of social content, a stream of user feedback, account closing surveys, competitor news, delivery statistics, release notes (documentation of changes – they knew what they changed and when) and so on. Then they could start doing automated reports with the data.
They kept adding more streams – Tweets (positive and negative), surveys, screenshots of reports (making use of Everynote’s OCR).
It all streamed into a huge bucket of searchable stuff. Searching would reveal connections across silos of information. Gigs of data. This also created a sense of shared ownership – it stopped being just the UX team’s job to look at the data, everyone was involved.
You’ve got to have data for everyone and everyone’s data.
This is a big win. It also has big political and collaborative implications. People can see what other people are doing and how it’s relevant for them – and they started sharing ideas and asking if the other team had thought about this other thing?
They started having data nerd lunches – cross-discipline groups exchanging ideas and information. Once this became a habit, everyone wanted to join in. They started connecting the data and eventually managed to connect people.
There are many tools that can do this. For Mailchimp, email was the API. Low barrier to entry, very easy to start sharing information. No additional workflow. This meant even non-developers could very easily contribute – designers, accountants… everyone.
Principle: the information has to be Easy In, Easy Out. If it’s not easy people won’t take part.
Since the data is largely unstructured, it helps to add tagging. Their email API includes a way to add hashtags in the subject line, to help reveal the less obvious connections. That allows people to browse quite specific topics.
Process is simple:
- search for something… take all the information you find (example showing the mix of content, looking for Android information – feedback emails, long customer emails, related tweets and articles, statistics from surveys, browser analytics. Lots of disconnected information come together to give a picture of how people are using Android.)
- stage: put the information together in a more structured format to work on it
- collaborate on the work
- produce a strategy
This is great for known searches – where you know what you need to ask. How about unknown searches? Where you aren’t quite sure what it is you need to be asking?
Having the data available across lots of devices helped get a good feel for the information coming in. It’s passive learning, eg. Seeing a coworker contribute a set of notes on a specific topic and you go read it too.
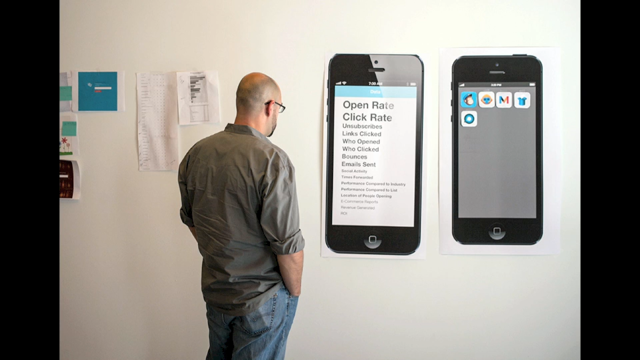
They ended up creating personas; and putting posters up in common spaces so people knew the personas. That led to people around the company getting used to applying the personas; and then eventually people started tagging information in the database according to which persona it applied to.
Data does not transform itself into wisdom. Wisdom comes from turning the information into stories, which can be shared with the team. To get information out of dry reports, they created short videos that could be IMed to other people at Mailchimp. Showing the experience helped avoid doing a large number of mockups, as people understood the overall direction.
The real power of connecting to all these people? One of Mailchimp’s designers was able to get information about the question he was trying to answer (“how do customers measure success”). He didn’t have to do new research, the information was already there. He was able to get a ranked list of success factors, which informed the work he was doing.
This takes designers from decorators to problem solvers, which is better for everyone. By using data, you can make good decisions about what to work on and how to solve that problem. This leads to wisdom.
We have heaps of information being left on the table. How could you make this data accessible? How can you connect the data with other information you have? How do you connect people so they can collaborate and make things in a better way.
Connected UX leads to a culture of inquiry. When people know they can ask crazy questions and get answers, they ask more questions and they use more real information in their work. This is valuable for all teams across your company.
…
Q&A
Q: did you hit any barriers while setting up this system? “who will work on this, who will be the gatekeeper?”
A: they did while they were trying different apps, just so someone would be responsible for each of the options. That fell apart quite quickly because other people stopped contributing to “their project”. Evernote was the MacGuyver way to do things – it was quick and easy to add things, it was easy to start participating.
Q: at what point are you drawing the line about what information you will and won’t store?
A: we have an understanding of junk in, junk out – when they found things that weren’t valuable, they would push it out and try to keep it out of the database. The teams know what’s valuable to contribute.
