Conffab by Web Directions
  • Speakers
  • Presentations
  • Conferences
  • Live streams
  • Topics
  • Pricing & Plans
  • Browse
  • Signup
  • Sign In
  • Speakers
  • Presentations
  • Conferences
  • Live streams
  • Topics
  • Pricing & Plans
  • Browse
  • Signup
  • Sign In

Search Conffab

Search presentations, speakers, transcripts, slides and topics.

Searching Conffab

Building Empathy Through Data
Alisa Lemberg at Web Directions 2015
Sign up for Conffab Free to watch this and hundreds of other videos for free
  • Details
  • Keypoints

Often we think of data as the sum total of user behavior – an abstraction of actual experiences. How might we dive deeper into customer data and take a peek at the real people behind the numbers? In this talk, Alisa Lemberg will share moments from the intersection of qualitative and quantitative research, and reframe data as a tool to bring design and engineering teams closer to user needs.

It’s not just building empathy with data it’s building some empathy for data…

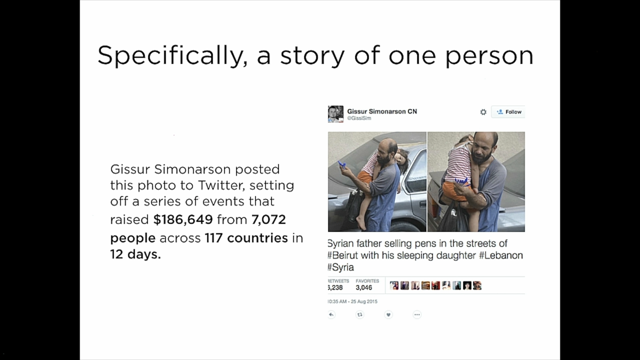
A story…

Follow

Gissur Simonarson

✔@GissiSim

Syrian father selling pens in the streets of #Beirut with his sleeping daughter #Lebanon #Syria

3:35 AM – 26 Aug 2015

  • 5,9735,973 Retweets
  • 2,6272,627 likes

Twitter Ads info and privacy

Story of Abdul, a father seen on twitter selling pens in the streets of Beirut while holding his daughter – twitter latched on to this story and ~7000 people raised ~$180k to help him.

Alisa wondered – why this person, why this story? Do those 7000 people donate to other causes and charities?

The death of one man is a tragedy… the death of millions is a statistic. – (variably attributed)

This is know as extension neglect. People will suggest longer jail sentences for someone who killed three people, than someone who killed thirty. We just don’t process things very well. We don’t connect to a large number of people the same way we connect to one person.

Empathy allows people to connect, understand and feel empowered to act on data. Most of us already know how to do it.

Case studies…

eBay

Ebay came to Ideo asking why customers were churning. They didn’t know why they were leaving or where they were going.

They had great purchasing data – they knew about current customers. What did they look at, what did they spend money on? But once the customer churned – stopped purchasing – the data was truncated. They also didn’t have as much information about new customers – where did they come from?

So they did interviews with actual eBay customers.

(slide: map of relationships… just friends, true loves, etc)

They had people map their relationship with eBay – place them on the map. eg. someone might say “just friends”… in fact the friend you knew as a kid and have on facebook, but doesn’t really know you very well. Not a close relationship.

They added qualitative data to the existing data set.

Next challenge for Ideo was to inspire 30,000 eBay employees with the insights. How do you get people who aren’t data scientists excited? How can you help them work with data?

They created an ebook explaining the segments and individuals within them. Separated the behaviour that described everyone who uses eBay, to everyone in a segment, to the individual.

They eventually found that many “churned” users were actually still there, just not finding things they wanted to buy.

Internally… Ideo found eBay was watching customer videos a lot. They were very keen to connect with real people.

Twitter

Looking at video in twitter feeds. How will people react to autoplay video? There wasn’t time to do an extremely deep behavioral investigation. They had stats on how many minutes people watched; but they used mini surveys to find out how interested they were in the content.

There was anxiety about autoplay videos – would users like it? Hate it? Leave?

They found people who had seen autoplay video before tended to be ok with it; but those who hadn’t didn’t like it as much.

  • Experimental data from live users → What users are doing
  • Survey data from those same users → how they feel about what they are doing
  • Relevant qualitative research about video watching behavior → what is the larger context of their actions

Take away notes & Try This At Home…

So how can make data easier to work with for our organisations?
  • Start by making data relatable
    • present things with a story; have your engineering team take the same survey as users, then talk about the delta
  • Know what you want to do with your data before you start
    • What questions will be asking?
    • What answers do you need?
    • double check you can answer the right questions; scope can change and if you don’t update the questions you ask you can be stuck without data
  • Empower the organisation to make decisions using your data
    • Ensure they will be comfortable interpreting the data and making decisions
    • A lot of data just goes in the drawer…
  • Break the silo to cross-validate insights
    • Get people from different teams to come to your sessions about data, get their insights
    • Alisa found if she looked official and organised things with a clipboard people would just sign up… 🙂

You may also be interested in

Thumbnail for Style with Substance

Style with Substance

Craig Sharkie

Web Directions 2015

Thumbnail for The Two Pillars of JavaScript

The Two Pillars of JavaScript

Eric Elliott

Web Directions 2015

Thumbnail for Real-Life Responsive Web Design Development

Real-Life Responsive Web Design Development

Vitaly Friedman

Web Directions 2015

Thumbnail for Advanced Responsive Typography

Advanced Responsive Typography

Mike Riethmuller

Web Directions 2015

Thumbnail for Embracing the Network

Embracing the Network

Patrick Hamann

Web Directions 2015

Thumbnail for Radical Keyboard Surfing

Radical Keyboard Surfing

Isabel Brison

Web Directions 2015

Thumbnail for Design Everything

Design Everything

Cap Watkins

Web Directions 2015

Thumbnail for VR: Discovering a New Medium

VR: Discovering a New Medium

Robert Tilt

Web Directions 2015

More presentations from Web Directions 2015

Thumbnail for The Website Obesity Crisis

The Website Obesity Crisis

Maciej Ceglowski

Web Directions 2015

Thumbnail for Financial Inclusion in the Solomon Islands

Financial Inclusion in the Solomon Islands

Rose Matthews

Web Directions 2015

Thumbnail for Enough Lipstick on Pigs

Enough Lipstick on Pigs

Tom Loosemore

Web Directions 2015

Thumbnail for The New Age of Indie

The New Age of Indie

Kai Brach

Web Directions 2015

Thumbnail for Designing Connected Products

Designing Connected Products

Martin Charlier

Web Directions 2015

Thumbnail for Customer Service as a Core Feature

Customer Service as a Core Feature

Mathew Patterson

Web Directions 2015

Thumbnail for Souls and Machines: Designing the Future of Content

Souls and Machines: Designing the Future of Content

Hannah Donovan

Web Directions 2015

Thumbnail for Hacking the Creative Brain

Hacking the Creative Brain

Denise Jacobs

Web Directions 2015

© 2026

  • About
  • Speakers
  • Presentations
  • Conferences
  • Contact
  • Sign in
Sign Up