Why AI coding tools might not make the slightest difference
The AI Coding Tool Timeline: 2024-2026

The speaker opens with a history lesson tracing enterprise AI coding tool adoption at their company (Seek), from GitHub Copilot in 2024 through Cursor in 2025 to Claude Code in 2026. Despite rising adoption and costs, a DX longitudinal study found only 5-15% productivity uplift in PR throughput, setting up the talk's central question: why AI coding tools might not make much difference.

Introducing the Theory of Constraints

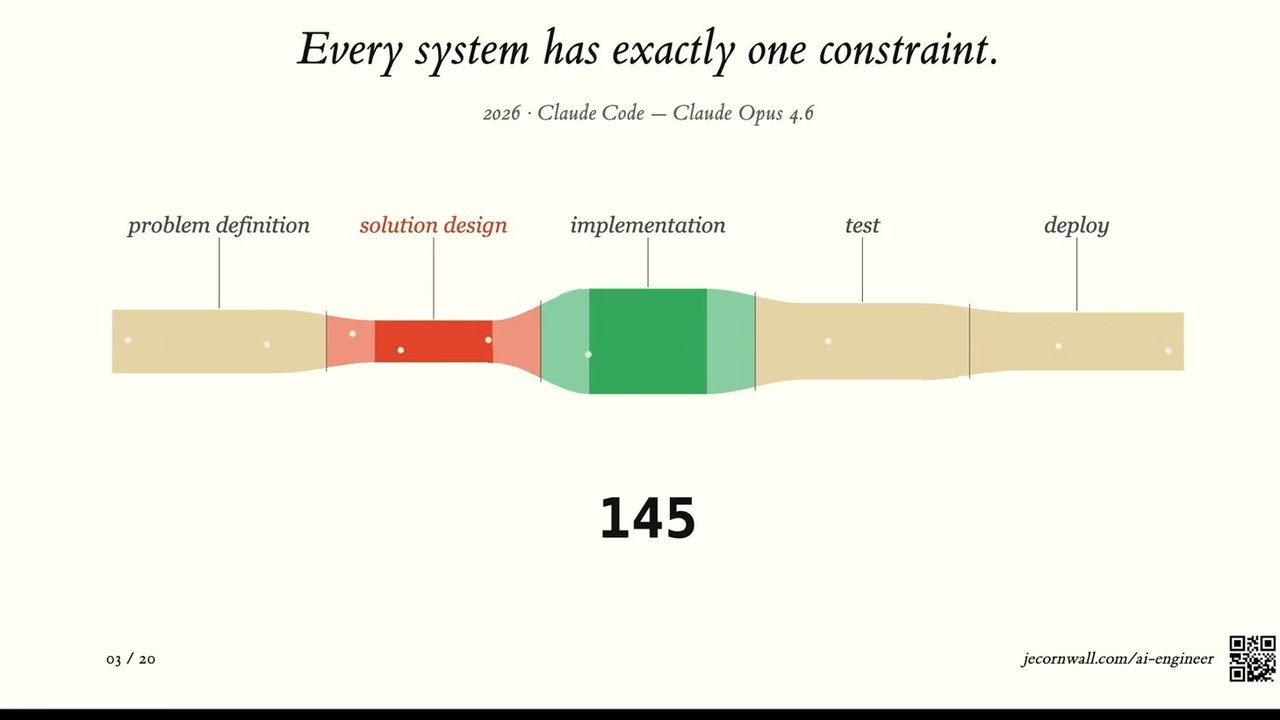
The speaker introduces the Theory of Constraints, explaining that any goal-oriented system has exactly one bottleneck at a time, and improving throughput elsewhere doesn't increase overall system output. Using a toy simulation, they show that optimizing a non-bottleneck stage (like implementation) leaves total throughput unchanged, mapping this concept onto the AI tool adoption timeline and personal weekend coding projects where coding used to be the bottleneck but no longer is.

Is Coding Really Your Bottleneck?

The speaker polls the audience on whether coding is their workplace bottleneck (almost no one raises a hand) and presents a model showing engineers' time split across coding, debugging, PR review, planning, security/compliance, maintenance, and learning—based on Microsoft's 'Time Warp' study. They argue that since coding is only about 15% of an engineer's time, even a 10x coding speedup yields modest overall productivity gains because it optimizes a non-bottleneck activity.

Failure Avoidance and Organizational Friction

The speaker explains that much of an engineer's non-coding time goes toward failure avoidance—reviews, coordination, and processes designed to prevent costly mistakes, citing Knight Capital's $440 million bankruptcy from a bad deploy in 2012 as a cautionary example. These failure-avoidance processes tend to accumulate over time without cleanup, creating friction that limits the impact of AI coding tools even as they remain necessary.

Finding Your Real Constraint Without Perfect Data

The speaker acknowledges that most organizations lack a perfect system map to identify their constraint, but suggests a practical approach: interview around 20 leaders about top blockers to shipping, triangulate on likely constraints, run experiments, and measure results. They describe using PR throughput as a non-target proxy metric for team health and emphasize an iterative, evidence-based process over theoretical modeling.

Productivity Drivers Beyond Coding Speed

The speaker lists productivity drivers to examine as potential constraints—build/test experience, deep work capacity, confidence in changes, cross-team collaboration, decision making, documentation, release and incident handling—drawing on DX's engineering intelligence platform framework. They highlight build and test experience as their biggest industry gap (24% below benchmark) and note that simply surveying and voting on top issues can surface obvious low-hanging fruit.

Building the Business Case with DXI Scores

The speaker explains how DX's Developer Experience Index (DXI) score correlates engineering time saved with productivity driver improvements, enabling ROI calculations like estimating $3 million in regained productivity for 600 engineers from a 5-point DXI uplift. This financial framing helps build investment cases for engineering experience improvements, distinct from direct profit/loss claims.

Case Study: Reducing Build Wait Time

The speaker details their first intervention targeting build wait time, driven by both a large industry benchmark gap and it being the most-voted engineer issue. Through traditional engineering work—warm build agent pools, predictive agent scaling, and caching—they reduced median build wait time by 15% over a year, dropping it from the top voted complaint to fourth, notably without relying heavily on AI.

Case Study: AI-Assisted Project Inception

The speaker describes tackling decision-making bottlenecks (a 12-point industry gap) through AI-assisted initiative kickoffs, developed with AWS using a practice called 'unicorn gyms.' By using AI to quickly draft integration plans and system contracts for multi-team initiatives, they reached consensus much faster than traditional coordination-heavy approaches.

Case Study: AI-Enabled Scale Localization

The speaker shares an example where AI enabled a single team to introduce a new language across 40 repositories and thousands of translation files—work that would traditionally require many teams and months of coordination. Completed in weeks at a cost of a few thousand dollars in AI tokens, this is presented as a task that simply would not have happened without AI.

Results and Closing Takeaways

The speaker summarizes results: a 3-point DXI gain (worth roughly $1.5 million), a 20% PR throughput increase, and improvements across key productivity drivers. They close with three reasons AI coding tools might underdeliver—coding usually isn't the constraint, the real constraint may be unknown, and AI might not fix the actual constraint—advising audiences to set realistic expectations, iteratively identify constraints, and treat AI as one ingredient rather than a complete solution.

Quick microphone check. Yes. I can hear myself. Alright. Good afternoon, everyone. I'm gonna start us off with a little bit of a history lesson, and I'm using the same timeline. Oh, we've got a bit of feedback. Sure we're controlling that. Same timeline as Jeff this morning going all the bay way back to 2024, which I'm declaring here as the year of GitHub Copilot.

I don't know if you can cast your mind back to 2024, but at least for us, that was kind of the predominant tool to a certain extent. It was the only game in town if you're an enterprise. So we were rolling this out. Adoption of that was going up. It started off obviously with the the enthusiasts trying it out, started rolling through the organization.

It was really easy to roll out. We're already on GitHub. It cost $19 a user a month. Easy decision to make. Easy. Good. 2025, declaring the year of Cursor. So people got excited about Cursor as the front runner, and we roll out Cursor at Seq. Adoption for AI coding tools in general kept going up for us, so got around to the 60%.

Price went up a bit, still fairly controllable, $65 user per month. Don't have to think too hard about that. 2026, so far, year of Claude code. Certainly, over the the holidays, sentiment seemed to turn really sharply towards it with Claude Opus 4.6, And we've seen our adoption keep going up. We've seen our costs keep going up.

You might consider that kind of a a low baseline. We're at the start of the year. It seems to be trending in the uppers direction still. So these are all good numbers. It's good to see graphs go up into the right, and you'd expect a lot of productivity out of that. That 10% number comes from DX. We did a longitudinal study of PR throughput increase over the last year and they saw between 515% productivity uplift.

Now if you're at a large company, a lot of engineers, maybe that's okay. Maybe you're okay with a 10% uplift. That's quite a bit compared to how much you're paying for these tools at the moment, but it starts to get a bit uncomfortable. I'm here to talk about why aiding AI coding tools might not make the slightest difference.

And if you saw Jeff's talk this morning, the keynote, you might think we're worlds apart. We're probably not, but I'll be explaining that through the lens of the theory of constraints. So I'm not gonna give a full overview of theory of constraints. That's a talk in and of itself, but I can tell you the key claim of the theory of constraints is that for any goal orientated system at any point in time, there is a constraint in the system. So I've got a little toy simulation here.

We can imagine those particles of little bits of work going through the system. So if you're in a situation where we're calling it implementation here is your bottleneck, then the thing you should do to get more throughput out of the system is to work on the bottleneck to make increase the throughput of implementation. And then once you do that, the constraint moves somewhere else.

So I'm declaring here the throughput's going from a 100 to a 145. They're arbitrary numbers. And in this case, the constraint has moved to solution design. Again, don't think too hard about whether this model is your system. This is a toy example. If you were to increase the throughput of implementation in this system, throughput remains at a 145 because you have not increased the throughput of the bottleneck. And I think we can maybe map that onto that history. So maybe you're in the situation in 2024, GitHub Copilot.

It was good. It kinda lifted the floor of productivity. That's how our model for it. We brought on cursor. It's had a different model. You can do more with a single prompt. As we're bringing on Claude, we're certainly spending more. It's not clear that we're getting more throughput out of the entire system. So when you're constraint is coding, so this May was maybe me with ideas I'd have on the weekend circa 2018.

Coding was the hard bit. Finding time for it, you'd end up doing a lot of research. Now it's more like this where coding for me is not the bottleneck on the weekend for my weekend ideas. So where constraint where the constraint is coding, AOS effect is absolutely large and obvious. That doesn't mean the constraint has gone away or your system is constraintless.

So maybe on the weekend, you're running out of weekend ideas or you can't be bothered marketing it or something else is stopping you from progressing that. Is coding your bottleneck? Show of hands, who thinks coding is their bottleneck at their workplace? Oh, one person. Excellent. Okay. So let's look at where coding fits in at a large organization. So here's a extremely simplistic model of what an engineer is doing. So there's feature work coming in and it gets coded.

And maybe from a long distance away, that's what it looks like. At least for myself, when I code, tend to introduce bugs, so I have to debug those. So our task expands. We have PR review. You've gotta read other other people's PRs. You gotta make sure that we're shipping the right things. Feature work doesn't come in fully formed.

You've gotta plan it. You've gotta schedule it. You've gotta think about how it fits into the system architecture and design. Feature work is not the only work that comes in. There's security and compliance work. There's maintenance work, which I dare say is gonna keep going up as we keep shipping more code. An engineer's week will also be filled with a certain amount of learning new technology. Here's the here's the bigger picture.

So coding is not implementation, and it's not engineering. People are taking photos, so I'll pause for a moment. This is maybe more what an engineer's work week looks like, and these numbers are from a Microsoft study called time warp, and the numbers are, you know, a bit aggregated. So if you look at that paper, you won't see exactly those numbers. I've had to squish them up to together a bit, but it's representative. So if you're kind of rolling out AI coding tools and that's all you're doing for enablement, the the thing that they are going to affect most is coding and if coding is 15% of your time, even if it's making you 10 times faster at coding, you might still just be 10% more productive overall because that's the part of the system you're optimizing.

So these other activities I claim have something in common which is failure avoidance. Your org has to avoid failure. So do a little thought experiment. Think of if you had someone in your organization who had complete autonomy, had all of the keys to the castle in the organization, how much damage could they do in forty five minutes versus how much benefit could they have to the coming in forty five minutes.

So there is very good reasons that your company probably has a lot of review processes, different ways to avoid failure. I think to Knight Capital which was a financial services company in 2012 bankrupted itself in forty five minutes due to a bad deploy, $440,000,000 out the door. So there's these kind of fat tail events that you've got to avoid. And often those sorts of failure avoidance activities involve a lot of coordination which is where things can really slow down.

So the the need for this failure avoidance is very real at large organizations. There is maybe a tendency to not clean up after these activities and they tend to accumulate. And so often you're in this process and you're not quite sure why this thing exists. It probably emerged out of some near miss or something like that. But it's it's going to get in the way of getting that 10x improvement and it probably should.

So where we are so far, every system has exactly one constraint. If your constraint is coding, aiO's effect is large and obvious and your constraint probably isn't coding. What is your constraint? Can you look at a cute little model like this and work out what your constraint is? No, you cannot. Reasons are you don't have one of these.

I'm assuming. I'm assuming you don't have one of these. If you do, please let me know and if you do have a accurate map like this, I want to know how long it took you to get that accurate map and I want to see it, but you don't need them. I would I suggest that you can make some educated guesses on where your constraint actually is.

I would suggest that if you talk to 20 leaders at your organization, get them to say the top three things that are getting in our way from shipping, you'll probably triangulate on what your actual constraints are pretty quickly. You can then experiment on some interventions in those areas. I think in talking to those same people, they'll have some good suggestions. You can measure the results of that, and you should.

So we use PR throughput as a proxy measure for activity in the organization. We don't put targets around it. We just measure it. And that's an indicator of do you have healthy teams If your PR throughput is in a reasonable range, happy to talk to people. I know that can be a little controversial.

We're happy to talk to people about that and keep repeating that process. Where could your constraint be? So I'll I'll flash up some suggestions of areas you might like to look. Your build and test experience, how much capacity do your engineers or builders have for deep work, How confident are you in changes? Cross team collaboration, decision making, documentation, ease, release, incident handling, incremental delivery, etcetera. These are some areas you might like to look, none of which are coding or like typing speed.

These are all productivity drivers. This is what the company DX calls productivity drivers. We use DX as our engineering intelligence platform And I'm gonna focus on just a few of these being the build and test experience, decision making, and cross team collaboration, which are ones I'll explore in a moment and and ones we've been focusing on.

So build and test experience, just as an example, that minus 24 is because we use DX, we get industry comparisons, and that is how far we're off on our build and test experience for the industry comparison. So that was our biggest gap. And again, not how fast we can type.

I'll get into how we improve that situation in a moment. I will say, so I've gone from make some educated guesses, talk to people, to a full engineering intelligence platform. The engineering intelligence platform gives us these industry comparisons which are very helpful, but it was also just the highest voted issue.

So if you've just taken the votes, which is a much easier thing to start with, doing a survey and saying what's your top three best voted issues, this is where I think you'll find there is kind of obvious and low hanging fruit that engineers have been whinging about for a few years. As a bit of a side note, if you're looking to make investment cases around these things, so DX and I'm sure other engineering intelligence platforms make claims around the there's a developer experience index score that you get from summing up or aggregating those productivity drivers.

And DX makes claims around they found correlation between how much engine engineering time is saved and that score, which means you can do some fun maths like this. Like, if you have 600 engineers and you think you can maybe uplift five DXI points and you apply some numbers to how much an engineer costs as a fully loaded thing, you could potentially save $3,000,000. That's not the profit and loss.

I'm sorry. That is regained productivity. So for the engineers you're already paying for, but it does help in making the case for these things. Let me talk through a few of the interventions we've made. So the first one I'll be talking about is build wait time. So evidence for this being constraint was that we had a very large gap between us and the benchmark, which I showed, and that was the most voted issue.

I didn't see the ten minute marker. Saw the five minute marker, so we're good. The intervention was a lot of things that the the team probably had on the backlog, but this put a real impetus behind that investment. And some of it is quite involved, but it was things like developing the the warm pool of build agents, a bit of predictive agent scaling so that we're scaling up in anticipation of build jobs coming in, a lot of caching.

We found that the median build wait time has gone down 15% over the last year and it's also gone from our most voted issue to our number four most voted issue. So engineers are noticing the difference. Was this an AI thing? Can I help? It's not the main game. We we've got some nice skills around helping people optimize their builds, but it wasn't the main game.

It was a lot of traditional engineering. We're going up in our use of AI now. So AI assisted project inception. This relates to decision making. So evidence for projects inception or decision making in general being a constraint was that we had a 12 gap with our industry comparison here. Important projects would take weeks to coordinate on details.

We ran some as experiments, we ran AI assisted initiative kickoffs with the help from our friends from AWS. They have a strange name for these things. They call them unicorn gyms, but we've quite liked that practice and we're we're rolling it through the organization. And where AI is helping with that is it kinda gets you to the 80% of an integration plan.

So if you're kicking off a big initiative, it involves maybe a dozen teams, maybe as many systems, working out the interaction points, the contracts between those systems would be something that traditionally would kind of get passed around a lot. You'd have to coordinate on a lot of meetings. If you can get off the blank page quicker, we find that we got to consensus much quicker.

Last ones that I'll talk about is scale localization, introducing a new language. So when we had to introduce a new language to the platform and across our dozens of systems, it would take a lot of teams and a lot of coordination. And we decided to experiment with just not doing all that coordination and getting one team to do the work across 40 repos, across thousands of translation files.

And the result of that is that it's very near completion in matter of weeks rather than months, and the engineers involved in that has spent a few thousand dollars in tokens in the process. So they're they're at the top of our spend for the month, but we we don't mind at all when they're having this kind of scaled effect. And this is an example of something that would not have happened without AI.

So some overall results. So we did go up three DXI points which I've referenced before. That was we've draw an equivalence there to about a high $1,500,000 for our team. Our PI throughput went up 20%, so we're we're beating the averages. And we we had uplifts in these DXi productivity drivers. We'll likely focus on these things next.

So why AI coding tools might not make the slightest difference? One is that coding isn't your constraint, probably. Another is you don't know what your constraint is, and a third is that AI might not fix your constraint. So the response to the first one is don't expect weekend results. Don't expect to just introduce Claude code and you're done.

That's where you'll get the 10%. If you don't know where your constraint is, make some educated guesses, measure and repeat. And with AI potentially not fixing your constraint, remember to use AI as an ingredient and not the whole recipe. So you definitely shouldn't be ignorant of AI. You should be curious about it. You should be working out where it can help you.

There's plenty of areas it can help you, but don't expect to just roll it out and for everything to get better. That's me. That is talk resources. Thank you very much.

A vintage Soviet-era portable television set, model 'электронъ къ 408д', with a glowing white screen. The television features tuning indicators labeled 'МВ ДМВ' with channel numbers '1 6 21' and '5 12 60' displayed vertically, and a control knob on the lower right.

2024

GitHub Copilot
GPT-4 Turbo

jccornwall.com/ai-engineer

jccornwall.com/ai-engineer

A line graph displays two trends ending at a vertical dotted line. A solid line represents "40% adoption" showing an upward trend. A dashed line represents "$19/user/mo" showing a relatively flat trend. A QR code is present in the bottom right corner.

2024

  • GitHub Copilot
  • GPT-4 Turbo

2025

  • Cursor
  • Claude 3.5 Sonnet

jescornwall.com/ai-engineer

A line graph shows two increasing trends between 2024 and 2025. The top line, labeled "adoption," rises from 40% to 60%. The bottom dashed line, labeled "$/user/mo" (cost per user per month), rises from $19 to $65.

A QR code is displayed.

2024

  • GitHub Copilot
  • GPT-4 Turbo

2025

  • Cursor
  • Claude 3.5 Sonnet

2026

  • Claude Code
  • Claude Opus 4.6

jecornwall.com/ai-engineer

A line graph illustrating trends from 2024 to 2026. The top line shows AI coding tool adoption increasing from 40% in 2024, to 60% in 2025, and approximately 80% in 2026. The bottom dashed line shows the cost per user per month increasing from $19 in 2024, to $65 in 2025, and approximately $200 in 2026. A QR code for jecornwall.com/ai-engineer is in the bottom right corner.

A graph illustrates the projected increase in AI tool adoption and cost over three years.

  • In 2024, adoption is 40% with a cost of $19/user/mo.
  • In 2025, adoption increases to 60% with a cost of $65/user/mo.
  • By 2026, adoption is projected to be ~80% with a cost of ~$200/user/mo.

2024

  • GitHub Copilot
  • GPT-4 Turbo

2025

  • Cursor
  • Claude 3.5 Sonnet

2026

  • Claude Code
  • Claude Opus 4.6

01 / 20

jecornwall.com/ai-engineer

A line graph showing two upward trends: one for AI tool adoption percentage and another for cost per user per month, across the years 2024, 2025, and 2026. A QR code is displayed on the bottom right.

AI Engineering Tool Trends

  • 2024

    Projected 40% adoption at $19/user/mo.

    • GitHub Copilot
    • GPT-4 Turbo
  • 2025

    Projected 60% adoption at $65/user/mo.

    • Cursor
    • Claude 3.5 Sonnet
  • 2026

    Projected ~80% adoption at ~$200/user/mo.

    • Claude Code
    • Claude Opus 4.6

jecornwall.com/ai-engineer

A line graph illustrates projected increases in AI engineering tool adoption and cost per user per month from 2024 to 2026, with specific tools listed for each year. A QR code is present for the URL.

AI Adoption, Cost, and Productivity Trends (2024-2026)

The slide presents three trends over time:

  • Adoption: Expected to rise from 40% in 2024 to 60% in 2025, and reach approximately 80% in 2026.
  • Cost per user per month: Projected to increase from $19 in 2024 to $65 in 2025, and further to approximately $200 in 2026.
  • Productivity: Expected to remain constant at approximately 10% across all years.

Key Technologies by Year:

  • 2024: GitHub Copilot, GPT-4 Turbo
  • 2025: Cursor, Claude 3.5 Sonnet
  • 2026: Claude Code, Claude Opus 4.6

More information available at: jcornwall.com/ai-engineer

QR code links to: jcornwall.com/ai-engineer

A line graph illustrating the projected trends of AI adoption, cost per user per month, and productivity from 2024 to 2026. Below the graph, specific AI tools and models are listed for each year. A QR code is present in the bottom right corner, linking to jcornwall.com/ai-engineer.

The slide presents projected trends for AI adoption, cost, and productivity from 2024 to 2026.

Yearly AI Tool Progression:

  • 2024: GitHub Copilot, GPT-4 Turbo
  • 2025: Cursor, Claude 3.5 Sonnet
  • 2026: Claude Code, Claude Opus 4.6

Projected Trends:

  • Adoption: Projected to increase from 40% in 2024 to 60% in 2025, and approximately 80% in 2026.
  • Cost per user per month: Projected to increase from $19 in 2024 to $65 in 2025, and approximately $200 in 2026.
  • Productivity: Projected to remain consistent at approximately 10% across all three years.

For more information, visit: jecornwall.com/ai-engineer

A line graph illustrating the projected trends for AI tool adoption, cost per user per month, and productivity from 2024 to 2026.

2024

  • Adoption: 40%
  • Cost: $19/user/mo
  • Tools: GitHub Copilot, GPT-4 Turbo

2025

  • Adoption: 60%
  • Cost: $65/user/mo
  • Tools: CURSOR, Claude 3.5 Sonnet

2026

  • Adoption: ~80%
  • Cost: ~$200/user/mo
  • Tools: CLAUDE Code, Claude Opus 4.6

Overall productivity gain: ~10%

jecornwall.com/ai-engineer

A line graph showing projected trends from 2024 to 2026 for AI engineering tool adoption, cost per user, and productivity. Three lines represent: user adoption increasing from 40% to ~80%, cost per user increasing from $19/month to ~$200/month, and productivity remaining relatively flat at ~10%. Below the graph, specific AI tools are listed for each year: GitHub Copilot and GPT-4 Turbo for 2024; Cursor and Claude 3.5 Sonnet for 2025; Claude Code and Claude Opus 4.6 for 2026. A QR code links to jecornwall.com/ai-engineer.

Why AI coding tools might not make the slightest difference.

Jason Cornwall · Head of Engineering Enablement · SEEK

jecornwall.com/ai-engineer

A QR code is displayed on the bottom right.

Every system has exactly one constraint.

  • problem definition
  • solution design
  • implementation
  • test
  • deploy

100

jdcornwall.com/ai-engineer

https://jdcornwall.com/ai-engineer

A horizontal diagram illustrates a five-stage process flow, resembling a pipe or tube that varies in width. The stages are labeled: "problem definition," "solution design," "implementation," "test," and "deploy." The pipe is widest at "problem definition," narrows slightly for "solution design," then significantly constricts and turns red at "implementation," indicating a bottleneck. It widens again for "test" and "deploy." Below the diagram, a large number "100" is displayed. In the bottom right, there is a QR code that links to the URL provided.

Every system has exactly one constraint.

2024 · GitHub Copilot – GPT-4 Turbo

100

jecornwall.com/ai-engineer

A horizontal flow diagram depicts a process pipeline with five stages: problem definition, solution design, implementation, test, and deploy. The 'implementation' stage is colored red and appears as a narrower section in the pipeline, indicating a bottleneck. Below the diagram, the number 100 is displayed prominently. A QR code is present in the bottom right corner linking to jecornwall.com/ai-engineer.

Every system has exactly one constraint.

2025 · Cursor – Claude 3.5 Sonnet

Process stages: problem definition, solution design, implementation, test, deploy

145

jecornwall.com/ai-engineer

A horizontal diagram depicting a five-stage process flow: problem definition, solution design, implementation, test, and deploy. The 'solution design' stage is highlighted in red and visually narrowed, representing a bottleneck. A QR code is presented next to the website address.

Every system has exactly one constraint.

2026 · Claude Code – Claude Opus 4.6

145

jecornwall.com/ai-engineer

A horizontal flow diagram illustrates a process with five stages: problem definition, solution design, implementation, test, and deploy. The 'solution design' segment is highlighted in red and appears as a bottleneck, while the 'implementation' segment is highlighted in green and appears wider. A QR code is also displayed.

When your constraint is coding,

jecosswall.com/ai-engineer

A horizontal diagram illustrates a process, resembling a pipe that narrows and then widens. It starts with a wide, light brown section labeled "weekend ideas" containing many small white dots, representing numerous initial concepts. This transitions into a narrow, light red section with fewer, smaller dots, leading into a long, thin red pipe labeled "coding," which contains only a few tiny white dots. The process concludes by widening into a light brown section labeled "shipped," signifying the final output. A QR code is also present.

When your constraint is coding, AI's effect is large and obvious.

jecornwall.com/ai-engineer
A horizontal flow diagram illustrates a process from "weekend ideas" through "coding" to a "shipped" product. The "weekend ideas" segment is wide and red with white dots, narrowing significantly into a lighter red section. It then expands into a long, wide beige segment labeled "coding," which subsequently narrows slightly before continuing as a somewhat narrower beige segment labeled "shipped." A QR code linking to jecornwall.com/ai-engineer is displayed in the bottom right corner.

When your constraint is coding, AI's effect is large and obvious.

jecornwall.com/ai-engineer

A horizontal funnel-shaped diagram illustrating a process. It starts wide and red on the left, labeled "weekend ideas," containing many small white dots. It then narrows significantly and becomes light red, leading into a longer, beige section labeled "coding," which is narrower than the initial ideas section and contains fewer dots, suggesting a bottleneck. Finally, it widens slightly again and becomes beige, labeled "shipped," with only a few dots at the very end, indicating the final output.

When your constraint is coding, AI's effect is large and obvious.

05 / 20

jecornwall.com/ai-engineer

QR code linking to jecornwall.com/ai-engineer.

When your constraint is coding, AI's effect is large and obvious.

Is coding your bottleneck?

jecornwall.com/ai-engineer

A QR code links to jecornwall.com/ai-engineer.
  • Feature work
  • Coding

jecornwall.com/ai-engineer

A horizontal bar illustrates a process, segmented by vertical lines and marked with small circles. Two main sections are labeled: "feature work" and "coding". A QR code is displayed in the bottom right corner, linking to jecornwall.com/ai-engineer.
  • feature work
  • coding
  • debugging
  • pr review
jecornwall.com/ai-engineer
A horizontal bar diagram illustrates a four-stage process: feature work, coding, debugging, and PR review. A QR code is present.

Engineering Workflow

  • feature work
  • coding
  • debugging
  • pr review
jecornwall.com/ai-engineer
A horizontal timeline diagram with four labeled points: feature work, coding, debugging, and pr review, illustrating a simplified engineering workflow. A QR code is present.
  • feature work
  • planning
  • sys arch / design
  • coding
  • debugging
  • pr review

jecornwall.com/ai-engineer

A horizontal timeline diagram illustrating various stages of work for an AI engineer, including feature work, planning, system architecture/design, coding, debugging, and PR review.

QR code linking to jecornwall.com/ai-engineer.

Engineer's Workflow Timeline

  • Feature work
  • Planning
  • System architecture / design
  • Coding
  • Debugging
  • PR review

jecornwall.com/ai-engineer

A timeline diagram illustrating different stages of an engineer's workflow, starting with feature work and planning, moving through system architecture/design, coding, debugging, and ending with PR review. A QR code is present in the bottom right corner, linking to jecornwall.com/ai-engineer.

Engineer's Work Stages

  • feature work
  • security / compliance
  • planning
  • sys arch / design
  • coding
  • debugging
  • pr review

Find more information at jecornwall.com/ai-engineer

A diagram illustrates a main horizontal timeline of engineering work stages: feature work, planning, system architecture/design, coding, debugging, and PR review. A branch labeled "security / compliance" extends upwards from the "feature work" section. A QR code links to jecornwall.com/ai-engineer.

Engineer's Workflow and Responsibilities

Key activities include: feature work, security / compliance, maintenence, planning, sys arch / design, coding, debugging, and pr review.

Additional resources: jecornwall.com/ai-engineer

A branching timeline-like diagram illustrates an engineer's work. It starts with "feature work" on a main horizontal path. Branches extend upwards from this path for "security / compliance" and "maintenence". The main path continues, indicating a progression through "planning", "sys arch / design", "coding", "debugging", and "pr review". Small white dots and black 'x' marks are scattered along the paths, possibly representing tasks or time spent. A QR code links to jecornwall.com/ai-engineer.

feature work

security / compliance

maintenance

planning

sys arch / design

coding

debugging

pr review

new tech

learning & development

06 / 20

jecorswall.com/ai-engineer

Diagram illustrating different activities an AI engineer engages in, presented as interconnected and separate horizontal bars. The main horizontal bar shows a progression from 'planning' through 'sys arch / design', 'coding', 'debugging', and 'pr review'. Branches extend upwards from this main bar for 'feature work', 'security / compliance', and 'maintenance'. A separate horizontal bar above the main one indicates 'new tech' and 'learning & development'. Small white dots are scattered along these bars, representing individual tasks or time spent. A QR code is also present.

Coding != Implementation != Engineering

maintenence
security / compliance
feature work
planning
sys arch / design
coding
debugging
pr review
new tech
learning & development

jecornwall.com/ai-engineer

A horizontal timeline-like diagram illustrates various stages and categories of an engineer's work, branching out into different activities. The main flow includes planning, system architecture/design, coding, debugging, and PR review. Branches extend upwards for feature work, security/compliance, and maintenance. A separate bar above represents new tech and learning & development.

Coding != Implementation != Engineering

  • feature work
  • security / compliance
  • maintenence
  • new tech
  • planning
  • sys arch / design
  • coding
  • debugging
  • pr review
  • learning & development
jecornwall.com/ai-engineer
A diagram illustrates the various components of an engineer's work. It shows a main horizontal path for tasks like feature work, planning, system architecture/design, coding, debugging, and pull request review. Branches extend upwards from this path for security/compliance and maintenance. A separate, parallel bar represents new technology and learning & development. Small dots within the paths indicate the relative time allocation for each activity.
  • Coding: 15%
  • Collaboration: 20%
  • Design: 10%
  • L&D;: 20%
  • Quality Assurance: 20%
  • Other: 15%

07 / 20

jecornwall.com/ai-engineer

A horizontal bar chart showing six categories and their respective percentages: Coding 15%, Collaboration 20%, Design 10%, L&D; 20%, Quality Assurance 20%, and Other 15%.

A QR code links to jecornwall.com/ai-engineer.

~10x faster coding. ~10% more productive.

Coding: 15%

Collaboration: 20%

Design: 10%

L&D;: 20%

Quality Assurance: 20%

Other: 15%

Coding

07 / 20

jecornwall.com/ai-engineer

A slide featuring two horizontal bar charts. The top chart shows segments for Coding, Collaboration, Design, L&D, Quality Assurance, and Other activities with their respective percentages. The bottom chart shows a similar structure but the "Coding" segment is highlighted in red and appears smaller, followed by unlabelled grey segments.

These activities have something in common.

  • Collaboration 20%
  • Design 10%
  • L&D; 20%
  • Quality Assurance 20%
jecornwall.com/ai-engineer
A horizontal diagram showing four distinct blocks labeled with activities and their associated percentages: Collaboration 20%, Design 10%, L&D (Learning & Development) 20%, and Quality Assurance 20%. A QR code is also present.

Your org must avoid failure

  • intake
  • design
  • architecture review
  • build
  • security review
  • legal
  • integrate
  • change advisory
  • release approval
  • ship
jecoswall.com/ai-engineer
A diagram illustrates a project delivery pipeline as a horizontal flow. The pipeline starts wide, then narrows significantly into a red section labeled "architecture review". It widens again for "build", then narrows into two consecutive red sections labeled "security review" and "legal". It widens for "integrate", then narrows into two more consecutive red sections labeled "change advisory" and "release approval", finally widening slightly before the "ship" stage. Dotted lines with arrows show feedback loops from the narrow, red review stages back to earlier, wider stages.

Your org must avoid failure

  • intake
  • design
  • architecture review
  • build
  • security review
  • legal
  • integrate
  • change advisory
  • release approval
  • ship

jecornwall.com/ai-engineer

A horizontal flow diagram illustrates a multi-stage process. Wider beige pipe segments represent main phases such as intake, design, build, integrate, and ship. Narrower red pipe segments represent review or approval stages like architecture review, security review, legal, change advisory, and release approval, depicted as bottlenecks in the flow. Dotted lines with arrows indicate feedback loops or rework paths from review stages to preceding phases. A QR code is also present.

Your org must avoid failure

jecornwall.com/ai-engineer
A diagram illustrates a project development pipeline as a horizontal flow. It shows stages such as intake, design, build, integrate, and ship, interspersed with review and approval gates including architecture review, security review, legal, change advisory, and release approval. The review gates are visually represented as narrower, red sections, suggesting potential bottlenecks or points of failure. A QR code is present.

Your org must avoid failure

jecornwall.com/ai-engineer

A diagram illustrates a process pipeline as a horizontal tube, representing a workflow from 'intake' to 'ship'. The pipeline has various stages: 'intake', 'design', 'architecture review', 'build', 'security review', 'legal', 'integrate', 'change advisory', 'release approval', and 'ship'. Several stages, specifically 'architecture review', 'security review', and 'release approval', are depicted as constricted, red bottlenecks in the tube, suggesting points where flow is restricted. Small white dots, representing work items, are shown flowing through the pipeline. Dotted arrows indicate feedback loops, with work returning from 'architecture review' to 'design', from 'security review' to 'build', and from 'release approval' to 'integrate'. A QR code is in the bottom right corner of the slide.

Your org must avoid failure

  • intake
  • design
  • architecture review
  • build
  • security review
  • legal
  • integrate
  • change advisory
  • release approval
  • ship

jcornwall.com/ai-engineer

A diagram illustrates a process flow as a horizontal pipe, showing various stages of development or project execution. The pipe has wider sections for main stages (intake, design, build, integrate, ship) and narrower, red sections representing review or approval stages (architecture review, security review, legal, change advisory, release approval). Small white dots flow through the pipe, and dotted arrows indicate feedback loops from the review stages back to earlier parts of the process, suggesting rework or reiteration when issues are found.

Your org must avoid failure

intake

design

architecture review

build

security review

legal

integrate

change advisory

release approval

ship

jecornwall.com/ai-engineer
A diagram illustrating a process pipeline that visually represents an organizational workflow. The pipeline has several stages labeled: 'intake', 'design', 'architecture review', 'build', 'security review', 'legal', 'integrate', 'change advisory', 'release approval', and 'ship'. White dots move through the pipeline. The pipeline narrows significantly at 'architecture review', 'security review', 'integrate', and 'release approval', representing bottlenecks where the white dots accumulate. Dotted lines indicate feedback loops or iterative paths within the process.

Your org must avoid failure

jcornwall.com/ai-engineer
A horizontal flow diagram illustrates a process or pipeline. It starts with 'intake' and proceeds through stages labeled: 'design', 'architecture review', 'build', 'security review', 'legal', 'integrate', 'change advisory', 'release approval', and 'ship'. The pipe's width varies, becoming narrower at 'architecture review', 'security review', and 'release approval', resembling bottlenecks. Red segments within the pipe highlight the 'architecture review', 'security review', 'legal', 'change advisory', and 'release approval' stages. Small white dots, representing work items, are shown flowing through the pipe, accumulating at the narrower, red sections. Dotted lines with arrows indicate feedback loops: from 'security review' back to 'build', and from 'release approval' back to 'integrate'. A QR code is present on the slide.

Your org must avoid failure

jecornwall.com/ai-engineer
A horizontal pipeline diagram illustrating a multi-stage process flow. The pipeline consists of wider beige sections representing process stages: "intake", "design", "build", "integrate", and "ship". These are interspersed with narrower red sections, which act as bottlenecks or review gates: "architecture review", "security review", "legal", "change advisory", and "release approval". Small white particles flow through the pipeline, accumulating before the constricted red review sections, symbolizing delays or blockages. Dotted arrows indicate feedback loops or rework paths, showing flow from later stages (e.g., after "architecture review" and "integrate") back to earlier design or build stages. A QR code is present.

Review steps often involve heavy coordination.

  • team a
  • team b
  • team c
  • architecture review
  • security review
  • release approval
  • ship

More information: jecornwall.com/ai-engineer

A diagram illustrates a complex review process involving multiple teams and coordination points. Three parallel paths, labeled 'team a', 'team b', and 'team c', represent different teams' work streams. These paths repeatedly converge into large red 'X' shaped intersections, signifying mandatory review stages that require heavy coordination across teams. The review stages are labeled 'architecture review', 'security review', and 'release approval'. Small white dots flow along the paths, representing work items moving through the process. After passing all review stages, the paths finally merge into a single 'ship' point, indicating product delivery. The diagram visually emphasizes bottlenecks and dependencies inherent in highly coordinated review steps.

Every system has exactly one constraint

If your constraint is coding, AI's effect is large and obvious

Your constraint probably isn't coding

jecowall.com/ai-engineer

Three rectangular boxes contain text points. A QR code is present in the bottom right corner.

Every system has exactly one constraint

If your constraint is coding, AI's effect is large and obvious

Your constraint probably isn't coding

What is your constraint?

The process involves three stages: define, implement, and deploy.

jecornwall.com/ai-engineer

A diagram illustrates a process as a series of connected tubes, with a wide opening on the left, narrowing significantly in the middle (the bottleneck), and then widening slightly on the right. The "implement" stage is shown as the narrow bottleneck, with "define" to its left and "deploy" to its right. The initial wide tube contains many small white dots, which then flow through the narrow "implement" section as a red stream, and continue into the wider "deploy" section. A QR code is present.

You can't just look at a cute simulation.

  • define
  • implement
  • deploy

jecornwall.com/ai-engineer

A diagram illustrates a process with three connected segments labeled 'define', 'implement', and 'deploy'. The 'implement' segment in the middle is highlighted in red and appears narrowed, resembling a bottleneck or a material under stress.

You can't just look at a cute simulation.

jpcornwall.com/ai-engineer
A diagram illustrating a process flow with three stages: "define", "implement", and "deploy". The stages are connected by a horizontal, tube-like structure with small dots inside, suggesting flow. The "implement" stage is highlighted in red. A QR code is present.

You can't just look at a cute simulation.

The diagram illustrates three stages: define, implement, deploy.

For more information, visit: jecornwall.com/ai-engineer

A diagram visually represents a process in three stages. The first stage, labeled 'define', shows a wide, light-colored segment filled with numerous small white dots. This funnels into a narrower, red segment labeled 'implement', where the dots appear to be compressed and flowing. The process then expands into a final wider, light-colored segment labeled 'deploy', from which fewer, larger white dots exit. A QR code is present in the bottom right corner, linking to jecornwall.com/ai-engineer.

You can't just look at a cute simulation.

jecornwall.com/ai-engineer
A diagram illustrates a three-stage process labeled 'define', 'implement', and 'deploy'. The 'define' stage is a wide, light brown segment containing many small white dots, which then narrows into a constricted red 'implement' stage, and finally widens into a light brown 'deploy' stage. A QR code is also present on the slide.

You can't just look at a cute simulation.

Make some educated guesses.

Process stages include: define, implement, deploy.

jecornwall.com/ai-engineer

Diagram illustrating a process with a bottleneck. It shows a horizontal pipe divided into three stages: 'define', 'implement', and 'deploy'. The 'define' stage is wide and filled with numerous small white circles. The 'implement' stage is a narrow, red section acting as a bottleneck, where fewer, larger white circles are visible. The 'deploy' stage is a wide, empty section at the end. A QR code is also present on the slide, linking to the provided URL.

You can't just look at a cute simulation.

  • Make some educated guesses.
  • Experiment with interventions.
jecornwall.com/ai-engineer
A diagram illustrates a process flow resembling a pipeline with a bottleneck. The first section, labeled 'define', is wide and contains many small white circles. It narrows significantly into a red, constricted middle section labeled 'implement', where the circles are fewer, denser, and red, representing a bottleneck. The final section, labeled 'deploy', widens again to a solid beige block. A QR code is present, linking to the provided URL.

You can't just look at a cute simulation.

  • Make some educated guesses.
  • Experiment with interventions.

define implement deploy

12 / 20

jecornwall.com/ai-engineer

A diagram illustrates a process flowing from left to right, segmented into three stages: "define," "implement," and "deploy." The "define" stage on the left shows a wide, light-colored tube containing many small, dispersed white circles, representing initial ideas or inputs. This tube narrows considerably into the "implement" stage in the middle, which is colored red and shows the circles packed much more densely together, indicating a bottleneck or concentrated effort. The process then expands into the "deploy" stage on the right, a wider, light-colored tube where fewer, larger white circles are visible, representing outputs or results. A QR code is also present.

You can't just look at a cute simulation.

define implement deploy

  • Make some educated guesses.
  • Experiment with interventions.
  • Measure the results.

jecornwall.com/ai-engineer

A diagram illustrates a process flow starting wide, narrowing to a bottleneck, then widening slightly. The stages are labeled "define" (a wide section containing many small white particles), "implement" (a narrow, red bottleneck section containing fewer red particles), and "deploy" (a slightly wider section with fewer white particles at the exit). A QR code is also present.

Where could your constraint be?

jecornwall.com/ai-engineer
QR code linking to jecornwall.com/ai-engineer.

Where could your constraint be?

  • Build and Test Experience
  • Capacity for Deep Work
  • Change Confidence
  • Cross-team Collaboration

jecornwall.com/ai-engineer

A QR code links to jecornwall.com/ai-engineer.

Where could your constraint be?

  • Build and Test Experience
  • Decision Making
  • Capacity for Deep Work
  • Documentation
  • Change Confidence
  • Ease of Release
  • Cross-team Collaboration
  • Incident Handling

13 / 20

jecornwall.com/ai-engineer

Where could your constraint be?

  • Build and Test Experience
  • Decision Making
  • Incremental Delivery
  • Capacity for Deep Work
  • Documentation
  • Planning Process
  • Change Confidence
  • Ease of Release
  • Production Debugging
  • Cross-team Collaboration
  • Incident Handling
  • Review Turnaround Time

jecoswall.com/ai-engineer

A grid of twelve potential areas where constraints might exist, with "Build and Test Experience", "Decision Making", and "Cross-team Collaboration" highlighted. A QR code is present in the bottom right corner.

Where could your constraint be?

  • Build and Test Experience
  • Decision Making
  • Incremental Delivery
  • Capacity for Deep Work
  • Documentation
  • Planning Process
  • Change Confidence
  • Ease of Release
  • Production Debugging
  • Cross-team Collaboration
  • Incident Handling
  • Review Turnaround Time

jecornwall.com/ai-engineer

Where could your constraint be?

  • Build and Test Experience

    I'm able to perform my work without CI slowing me down

    -24

  • Decision Making

    On the projects I work on, decisions are made promptly with minimal delay

    -12

  • Cross-team Collaboration

    On the projects I work on, interactions with other teams and departments occur without delays

    -15

jecornwall.com/ai-engineer
Three horizontal bar charts illustrating scores for Build and Test Experience, Decision Making, and Cross-team Collaboration, each with a light gray and red segment and a negative numerical value.

Associate productivity gain with dollars

DX claims a correlation between their DXI (Developer Experience Index) and time saved

10 hours / engineer / point / year

jecornwall.com/ai-engineer

A QR code is shown, which links to jecornwall.com/ai-engineer.

Associate productivity gain with dollars

10 hours / engineer / point / year

A calculation is presented: 600 Engineers multiplied by 5 DXI Points, awaiting a result.

jecornwall.com/ai-engineer

Associate productivity gain with dollars

10 hours / engineer / point / year

600 Engineers × 5 DXI Points = 30,000 Hours saved / year

~$3m
Productivity regained / year

jeocoxwall.com/ai-engineer

A QR code links to jeocoxwall.com/ai-engineer.

Build Wait Time

jecornwall.com/ai-engineer

A diagram illustrates a software development pipeline. Three parallel beige lines labeled "build - a", "build - b", and "build - c" converge into a single red bottleneck section labeled "await build agent". After this bottleneck, the line splits again into three parallel beige lines labeled "deploy - a", "deploy - b", and "deploy - c". The red section highlights the wait time. A QR code is in the bottom right corner, linking to the provided URL.

Build Wait Time

  • Evidence for constraint
    • Largest gap between us and benchmark
  • Intervention
    • Warm pool, predicative agent scaling, caching.

jecornwall.com/ai-engineer

A diagram illustrating a software development pipeline. Three parallel lines, labeled "build-a", "build-b", and "build-c", represent separate build processes. These lines converge into a single, central red line labeled "await build agent", which represents a bottleneck. Small white dots flowing along the lines accumulate before and within this red section, visually indicating a queue or wait time. After the bottleneck, the flow splits back into three separate lines labeled "deploy-a", "deploy-b", and "deploy-c", representing deployment processes.

Build Wait Time

Evidence for constraint

  • Largest gap between us and benchmark

Intervention

  • Warm pool, predicative agent scaling, caching.

Result

  • Median build wait time down 15%
jecornwall.com/ai-engineer
Diagram illustrating a build process. Three build streams (build A, B, and C) converge to a single 'build agent' which then branches out to three deploy streams (deploy A, B, and C).

Build Wait Time

Evidence for constraint

  • Largest gap between us and benchmark

Intervention

  • Warm pool, predicative agent scaling, caching.

Result

  • Median build wait time down 15%

Can AI help?

  • Yes, but it's not the main game
  • Agents to optimise build pipelines

jecornwall.com/ai-engineer

A diagram illustrating a build pipeline. Three input lines labeled 'build - a', 'build - b', and 'build - c' converge into a central 'build agent' component, which then splits into three output lines labeled 'deploy - a', 'deploy - b', and 'deploy - c'. Small dots are shown moving along the lines, representing work items or agents. A QR code is also present.

AI-Assisted Project Inception

  • a - design
  • b reviews a
  • b - design
  • c reviews b
  • c - design
  • a reviews c
  • aligned
jecornwall.com/ai-engineer

A diagram illustrating an iterative design and review process. It is depicted as a horizontal series of connected, elongated shapes. Wider, beige sections represent "design" phases, alternating with narrower, red sections representing "review" phases. The flow culminates in a final, narrower beige section labeled "aligned".

QR code.

AI-Assisted Project Inception

Evidence for constraint

  • 12 point gap to Decision Making benchmark.
  • Important projects would take weeks to coordinate on important details
jecornwall.com/ai-engineer

A diagram illustrates a process flow, showing a series of interconnected stages: "a - design", "b reviews a", "b - design", "c reviews b", "c - design", "a reviews c", culminating in an "aligned" state. Each stage has a narrow red band indicating a bottleneck or core activity, surrounded by a wider beige section for other aspects. A QR code is present on the slide.

AI-Assisted Project Inception

Evidence for constraint

  • 12 point gap to Decision Making benchmark. Important projects would take weeks to coordinate on important details

Intervention

  • Ran AI-assisted initiative kickoffs with help with our friends at AWS

jecornwall.com/ai-engineer

A diagram illustrating an iterative project workflow. It shows a horizontal sequence of connected spindle-shaped segments labeled: "a - design", "b reviews a", "b - design", "c reviews b", "c - design", "a reviews c", and "aligned". The wider, light-colored segments represent design phases, while the narrower, red segments represent review or connection points.

AI-Assisted Project Inception

The slide illustrates a project inception timeline with the following phases:

  • AI-drafted kickoff
  • Alignment sprint, comprising steps:
    • B reviews A
    • B - design
    • C reviews B
    • C - design
    • A reviews C
  • Aligned

Evidence for constraint

  • 12 point gap to Decision Making benchmark. Important projects would take weeks to coordinate on important details

Intervention

  • Ran AI-assisted initiative kickoffs with help with our friends at AWS

Result

  • Initiatives kicked off in days not weeks
jecornwall.com/ai-engineer
A horizontal bar diagram illustrates a project inception process, showing phases like "ai-drafted kickoff," "alignment sprint" with several sub-steps, and "aligned." A QR code is displayed in the bottom right corner.

AI-Assisted Project Inception

Evidence for constraint

12 point gap to Decision Making benchmark. Important projects would take weeks to coordinate on important details

Intervention

Ran AI-assisted initiative kickoffs with help with our friends at AWS

Result

Initiatives kicked off in days not weeks

Can AI help?

Yes. AI gets you rapidly gets you off the blank page.

jecornwall.com/ai-engineer
A horizontal timeline diagram illustrates a project inception process. It is divided into three main stages: "ai-drafted kickoff", "alignment sprint", and "aligned". Sub-steps within these stages are labeled "B review A", "B - design", "C review B", "C - design", and "A review C". A QR code is displayed at the bottom right of the slide.

Scaled Localisation - Introducing a new language

jecosw.com/ai-engineer
A diagram illustrating a bottleneck or funnel process, resembling an hourglass or bowtie. On the left, multiple diverging beige lines, labeled 'ai items', transition into a narrower, red, central section. This central section is labeled 'role planning' above and 'program management' below, and contains small white dots within its wider red portions, suggesting discrete elements being processed. On the right, the red central section expands back into multiple diverging beige lines, labeled 'ai auditions'. A QR code is present in the bottom right corner, linking to the provided URL.

Scaled Localisation - Introducing a new language

Evidence for constraint
Introducing a new language required coordinating work with dozens of teams.

jecornwall.com/ai-engineer

A diagram illustrating coordination challenges. On the left, a fan-like structure labeled "20 teams" shows multiple lines converging into a central red bar. On the right, another fan-like structure labeled "20 codebase" shows multiple lines diverging from the same central red bar. The central bar is a bottleneck, with labels "okr planning" above and "program management" below, representing coordination points between the teams and the codebase. A QR code links to jecornwall.com/ai-engineer.

Scaled Localisation - Introducing a new language

Evidence for constraint
Introducing a new language required coordinating work with dozens of teams.

Intervention
Instead of coordinating across dozens of teams, give the task to one team.

A diagram illustrating a bow-tie or hourglass shape. On the left, several fanned-out beige bars are labeled "air teams". On the right, a similar set of fanned-out beige bars is labeled "air codebase". Both sets converge towards a central red, constricted area. The top of this central area is labeled "org planning" and the bottom is labeled "program management", suggesting a bottleneck or coordination point. A QR code links to jecowall.com/ai-engineer.

Scaled Localisation - Introducing a new language

Evidence for constraint

Introducing a new language required coordinating work with dozens of teams.

Intervention

Instead of coordinating across dozens of teams, give the task to one team.

Result

  • Nearing completion, in weeks not the estimated months.
  • Spent a few thousand on tokens.

jecoswall.com/ai-engineer

A diagram illustrates a process flow, starting from a single narrow bar labeled "1 team", expanding to "1 tooling", then further widening into a funnel shape that splits into several parallel bars labeled "40 codebases". A QR code is present.

Scaled Localisation - Introducing a new language

  • Evidence for constraint
    • Introducing a new language required coordinating work with dozens of teams.
  • Intervention
    • Instead of coordinating across dozens of teams, give the task to one team.
  • Result
    • Nearing completion, in weeks not the estimated months.
    • Spent a few thousand on tokens.
  • Can AI help?
    • Would not have happened without AI.

jecornwall.com/ai-engineer

A diagram illustrates a process flow horizontally from left to right. It starts with a narrow bar labeled "a team", which connects to a slightly wider bar labeled "at tooling". This then expands into a large funnel shape that branches out into multiple parallel horizontal bars on the right, representing many outputs. One of these output branches is labeled "all codebase". A QR code is also present.

FY26 Results.

  • +3 DXI points
  • 18,000 hrs / year reclaimed
  • ~$1.5m / year reclaimed
  • ~20% PR throughput increase
jecornwall.com/ai-engineer
A QR code linking to jecornwall.com/ai-engineer.

FY26 Results.

+3 DXI points

18,000 hrs / year reclaimed

~$1.5m / year reclaimed

~20% PR throughput increase

SUCCESSES

  • Build Wait Time +10
  • Documentation +12

jecornwall.com/ai-engineer

QR code linking to jecornwall.com/ai-engineer

Summary of FY26 results showing key metrics including DXI points, hours reclaimed, estimated cost savings, and PR throughput increase. Below this, a section titled 'SUCCESSES' lists 'Build Wait Time' and 'Documentation' with associated positive numerical changes and horizontal bar charts illustrating their progress, with 'Documentation' showing a slightly larger increase.

FY26 Results.

+3 DXI points

18,000 hrs / year reclaimed

~$1.5m / year reclaimed

~20% PR throughput increase

SUCCESSES

  • Build Wait Time +10
  • Documentation +12

NEXT FOCUS

  • Deep Work +6
  • Cross Team Collaboration +4
  • Decision Making +2

18 / 20

jecornwall.com/ai-engineer

Bar charts display progress for 'SUCCESSES': 'Build Wait Time' shows a bar that is approximately 70-75% filled, and 'Documentation' shows a bar that is approximately 90-95% filled.

Bar charts also display 'NEXT FOCUS' items: 'Deep Work' shows a bar that is approximately 75-80% filled, 'Cross Team Collaboration' shows a bar that is about half-filled, and 'Decision Making' shows a bar that is about a quarter-filled.

QR code linking to jecornwall.com/ai-engineer.

Why AI coding tools might not make the slightest difference.

jecornwall.com/ai-engineer
A QR code links to jecornwall.com/ai-engineer.

Why AI coding tools might not make the slightest difference.

Coding isn't your constraint

jecornwall.com/ai-engineer

A QR code linking to jecornwall.com/ai-engineer.

Why AI coding tools might not make the slightest difference.

Coding isn't your constraint

You don't know what your constraint is

jecornwall.com/ai-engineer
A QR code links to jecornwall.com/ai-engineer.

Why AI coding tools might not make the slightest difference.

  • Coding isn't your constraint → Don't expect weekend results
  • You don't know what your constraint is → Make an educated guess and measure. Repeat
  • AI may not fix your constraint

jecowall.com/ai-engineer

A QR code linking to jecowall.com/ai-engineer.

Why AI coding tools might not make the slightest difference.

Jason Cornwall

Head of Engineering Enablement at SEEK

jecornwall.com/ai-engineer

https://jecornwall.com/ai-engineer

A QR code is displayed below the URL, linking to jecornwall.com/ai-engineer.

A small, retro CRT television set, light beige in color, with a black frame around its screen. The screen displays a white background with a pixelated gray arrow pointing right. On the right side of the TV, there's a vertical tuning dial with numbers (1, 6, 21, 5, 12, 60) and Cyrillic text "МВ ДМВ" (MV DMV) and "настройка" (nastroyka). Below the screen, the TV's model "электронЬ КЬ 409Д" (Elektron' K' 409D) is visible. The TV is resting on a wooden surface, with a blurred red background.

Concepts & Methods

  • Developer Experience Index
  • Failure Avoidance
  • PR throughput
  • Theory of Constraints
  • Unicorn Gyms

Organisations & Products

  • AWS
  • Claude Code
  • Claude Opus 4.6
  • Cursor
  • DX
  • GitHub Copilot
  • Knight Capital
  • Microsoft
  • Seq

Works

  • Time Warp