JavaScript debugging the hard way
(upbeat music) - Hi, I'm Marcin, and I'm gonna be talking to you today about JavaScript debugging the hard way.
Sorry.
So based on the title, you think this talk is about debugging, don't get me wrong, it is but it's mostly a talk about a challenging Webpack upgrade that we went through due to the problems of scale of our codebase.
So what I'm hoping you get out of this is a look at some slightly less common debugging techniques that can be applied and special ones related to code that you didn't necessarily write yourself.
So chances are your codebase isn't that big that you consider a Webpack upgrade, particularly onerous task.
You might expect some conflict changes, some plugins that need upgrading, when you're doing a major version and just following the migration guide should sort of get you most of the way there. And I'm not saying this to trivialise the experience that others have upgrading Webpack, I mean, that's pretty much how I've approached in the past, with pretty good a success.
So, why was this upgrade in particular so special? So for a bit of context, I work at Atlassian on the Jira cloud front end platform team.
So we're responsible for the front end delivery of the Jira cloud codebase.
I like to summarise it as we take all the code that other people write and get it in front of our customers and bundling with Webpack is just one part of what we do. So the Jira cloud codebase front end codebase is some two million lines of JavaScript.
So that's our source directory, including tests, but it doesn't include our external dependencies, including our design system components so probably at the end of the day, it's like two million lines of code that were pushing through Webpack to do our build. And we did this as a single Webpack compilation, the bulk of Jira is a single page application and yeah, that's probably roughly around the amount of code that goes into Webpack.
At the end of that build, we produce some 200 megabytes of JavaScript assets and 300 megabytes of source maps.
So 200 megabytes seems like a lot, but we don't serve that to obviously every customer on every page.
Jira's big product with a lot of surface area, there's Jira software, Jira service desk whole bunch of different parts of it, so on average sort of user session is only gonna touch some of these.
And we make a lot of use of code splitting as well, so basically just a lot of bundles and they all add up at the end of the day.
So a typical Webpack build kind of takes around 20 minutes, at least at the time I took this screenshot, it's probably a bit over that now cause we've grown, and it produces the bundles it produces, source maps it produces, some metadata that we use for our front end delivery pipeline.
So let's go back to October, 2018, so at this point Webpack four had been out for quite a while now and we were still on Webpack three and we thought it's probably about time to upgrade or the, you know, bugs should have been ironed out by now. And so we scheduled like a week of work based on our past experiences like we expected to take about a week to migrate the config, test everything, and then get it in front of our customers and obviously I wouldn't be giving this talk if it only took a week.
Normally, the approach to this kind of thing is I'll make the changes locally on my laptop, do a minimal build, so I build without source maps without modification just to sort of make sure the config is working and then I'll push it to our CI environment. And in our CI environment, we'll run the full production build, we'll run tests and everything in parallel, and it kind of gives us that confidence that this change is gonna work.
But what happened in this case was while the build work locally, in CI it didn't work so well.
What we found was it was just running and eventually it would get killed by CI server for timing out essentially.
So there was clearly something different between local and production that was causing this issue. So just by elimination, the main differences were that locally, we were just bundling and essentially emitting JavaScript and then in production we were minifying and creating source maps as well. So, when we turned that off in CI, everything seemed to work.
So clearly there was something wrong in that area. And eventually we realised that if we extended that timeout, basically worked around the CI server killing our build it did eventually complete it, just took some like two plus hours, which wasn't great. So usually when something is taking a lot longer than you expect, in JavaScript you turn to profiling.
So very quickly JavaScript profiling so basically nodeJS is a wrapper around the VA JavaScript engine.
And VA provides something called the inspector protocol, and that's how like when you debug JavaScript through your browser dev tools or whatever that connects through that inspector protocol to VA. The inspector protocol is also used for profiling information.
So profiling information kind of gives insights at runtime of what's happening in that JavaScript engine. There's two main types of profiling.
First of those is memory profiling, which we're not really gonna talk about in this talk, but that essentially lets you take snapshots of memory over time and use that to find memory leaks for example. What we will be talking about is CPU profiling. And one of the views, when you look at a CPU profile is what's called a flame chart and in a flame chart, you've got time along the horizontal axis on the vertical axis you've got function calls. So each of those bars represents a call to a function, and when they're stacked on top of each other that function is called another function and so on down. Eventually you get to this little point at the end where there's like a whole bunch of small lines and that's basically usually a function going into a loop and calling somebody repeatedly.
And if you're zoomed in on this flame chart, you'd see that in more detail.
The other view is a tree table that we use for profiling information.
And this is used to identify hotspots in the code so you can sort by how much time was spent in a particular function or which function had the most amount of time spent in it and you can use that to work out where your progress is slow.
So how do we profile Webpack? So normally you would run like this through node, inspect break let's you turn on the inspector and then connect a profile to Webpack when you run it. The problem is like we want to try to do this locally to try and get that CPU profile, but no matter how much memory we gave a node at the time, like we would just get these out of memory exceptions and we couldn't capture a profile.
Eventually I found this really useful plugin, a CPU profile Webpack plugin.
And what that lets you do is it lets you add like any other plugin to Webpack and that will turn on that inspector API have had inspect API it'll turn on profiling in VA and it'll generate a CPU profile file at the end of your build.
And so because we found a way to get the build to run to the end in CI eventually, by adding this plugin we can get that CPU profile and download it locally as an artefact and have a look at it.
So typical Webpack CPU profile looks a bit like this, so this is one from a working normal build, you can see roughly the phases are equal in length and, first phase is bundling, so that's where Webpack reads all your files, traces the dependencies and then generates like a in memory representation of all that. Secondly, it optimises that graph, that's where it decides what chunks and bundles it's gonna produce.
Then it does a bit of work to generate initial source maps, minifies that code and the source maps and finally does some more work to the source maps that have gone through the minification step and finally admits everything to disc.
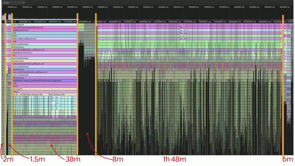
So in our typical Webpack build, those phases were roughly equal in length, somewhere two to three minutes, and that's where you get that kind of 20 minute build time. But in the CPU profile we downloaded from our CI server, we found something more like this, essentially that source map part was taking significantly longer than any other part.
And if you look at the actual timings, there was like one part of it was taking like an hour 48 that was like very long.
So clearly that's an area we should investigate and see what's actually happening there where that time is going.
So, if we turn to the flame chart initially, we can start zooming in on some of these more interesting areas and just see what's happening there.
And what we see as we zoom closer and closer is that this code repeated over and over again, and at the bottom of this stack of calls is the split function and this is literally the string split function in JavaScript.
And you can see that it's taking some like 20 plus minutes to have total execution time in this segment. And if we go over to the other side of the minification boundary, we see exactly the same pattern repeated.
So going over to the tree table view, that confirms our suspicion that split is the major contributor to that execution time and we can dig down we can see where it's getting code from. But, more interestingly then I guess where it's getting code from is to find out where in our codebase that is so that we can see what's happening in the code at that point. And if we look it's actually coming from the source map library.
So if we jump over to the code where this split function is getting called, we see this chunk of code and the details aren't too important in this case but what we see is that there's a split happening using a regular expression.
And this normalised function gets called over and over again as part of generating source maps.
And what's happening is that regular expression is getting created every time and it's getting garbage collected and that's building up a lot of overhead in garbage collection and as well using split using a regular expression to do a string split like this is probably not the most efficient use of a regular expression, although it's been used in this case because it supports multiple forward slashes. So it seems like, Oh, we found a good opportunity to improve this code but not the first one to find this problem. It turns out someone else has already found the same problem and fixed it, in fact months before we even got to this and the fix was pretty much what I just described, they replaced the string split with a regular sort of string walk instead and they also memorised the function so that on repeated calls with the same arguments, it was just returning the results straight away. So why hadn't Webpack upgraded to this new version of source map? So this where it gets interesting.
The change was made it into version 0.7 of the source map library, which totally changed the API and so Webpack couldn't consume this new version so you may well ask, well, why didn't they just backboard the fix to the older version? And someone tried that someone requested that this fix get back boarded but seemed to have fallen on deaf ears Mozilla didn't seem to be interested in releasing an older version of sourcemap. So what can we do when one of our upstream dependencies won't update and we need a new version of it. The first thing you might consider is you might consider forking that dependency. In this case forking was a bit impractical though because source map is like a leaf dependency it's depended on by a bunch of other stuff and there's other versions of source mapping used by other dependencies so it would mean that in this case you would have to fork everything in the chain to make sure it was referencing the right forked versions of everything else and that would make upgrading anything in future nightmare. Luckily again, some searching around found a useful tool for this particular scenario something called patch-package. Now what patch-package lets you do is it lets you go into your node modules directory to a dependency, make some fixes in there and then you run yarn patch-package or npm and it generates a patch file, so it downloads the original source and compares it and generates a patch file in your repository containing your changes.
And then when you run a post instal script, it can apply those fixes at instal time.
And this is really useful because it means you can distribute that fix and the intention is to be used when you're waiting say for a PR in an upstream dependency and you don't wanna, and you need a fix now. In this case, it's pretty much a permanent fix at this point because we don't expect to ever see another version of source map 0.6.
But happy days that actually worked, and that performance fix went in and we were able to do our full production builds in the same 20 minutes or so Webpack three was giving us , even slightly faster.
So the next step was to get these changes in front of customers.
In front of our internal customers.
So we put it in front of my internal customers what we call it dog fooding and there didn't seem to be any issues we ran it for a day or two in our internal environments and everything was fine.
But then within 15 minutes of rolling it out to a small tiny subset of our real customers, we had reports that there some functionality wasn't working.
So in Jira in the navigation, and that's changed since we did this, we had these fly out menus on the side of the search store and star drawer and they would load dynamically load this content.
And on our Jira SBA pages, that would all work fine and that's kind of where most of our internal users were probably using.
But what we found on the older pages like our admin area, if you went to one of those async pages, it would just fail to load, you would just get a blank screen.
So let's dig into this with the Chrome dev tools and try and work out what the actual underlying areas. So if we open up the inspector, we see that it cannot read property call of undefined, okay, so that's definitely something wrong and we being massed here as a warning, so it doesn't come up as an error because we're using like a custom async loading component that's masking this area as well.
And we know we found the right area because we can see the search drawer referenced, but the issue is as well that this is happening on the actual page itself, the code's on the page so rather than in one of the JavaScript bundles that we're producing as part of our Webpack build directly.
So if we click through that, we end up at this beautiful line of code in the middle of a blank sea of nothingness. And the reason for this is that it's minified code. It's being compressed down to a single line. Luckily for us, Chrome provides this pretty print functionality, so you can press this little button on the bottom left and it'll at least reformat the code, so you don't get it deminified because it can't do that, but what it can do is at least give you a bit more context which can be really useful.
Now based on experience, unfortunately in this case there's no easy way to summarise this but I can see from these hashes in the file and especially that .7.js in the bottom line like I'm pretty sure that this is part of the Webpack runtime at this point.
But to identify what part of the Webpack round time is we need to kind of find where this call method is called in Webpack.
So before we look into where in Webpack this is being called from, let's just have another look at this error again. So it's cannot read properly call of undefined. So what does that actually mean? So that means in this case that call is being called on something that's undefined. So that means either e or a or the a property in this case are what's undefined.
So that we need to work out what b and a and that's why we need to look at the unminified Webpack runtime.
So eventually, if we look at the unminified Webpack runtime and search for call, we find this method and we know that this is the right method we can kind of match up the minified code with the real code and we can see these patterns match up.
So that means that our particular call that we're interested in is this function here. And so that means that in this case, a is the module ID and e is the module registry like WebEx internal module registry.
That's interesting.
It's something that Webpack is failing inside Webpack WebEx expecting to find a module that it can't find at that point. So which module is actually failing on? Now the easy option and we all do this when we're debugging is to just stick a console.log above that return and work out where it fails.
The problem here is that this code is the Webpack runtime that's embedded in our page, served by Jira, and in this environment it's not really practical to just stick it the console.log in there, it would require too many moving parts to be running locally to do all that.
So instead what we could do is we could set a break point. The problem is with setting a regular break point is that this line gets called over and over again. It gets called for every single JavaScript file in the codebase that goes into the bundles rather than the bundles themselves, there's tens of thousands of these calls potentially. But what we can use instead is we can use something called a conditional break point. So there's a menu here on the break point button and it lets us set a condition so this break point will only trigger if this particular condition is true.
In this case we wanna check if the type of e.a or e[a] is undefined.
And if we do that and set the break point and then refresh our page and then trigger the era again, we should find that break point gets hit.
And it does, great.
So now we can go into and see to the variable list and see what the value of that is at the time. And then we have our first clue.
We have a particular package that a particular module that is failing to load or it's not finally failing to be found at this time. So I mentioned earlier that another way to do this an easy way to debug this would be to stick a console.log. There's actually another type of break point if you go into that menu again where you can edit the break point, what you'll find in there is that there's also something called a log point. And a log point is basically like sticking your console.log in at runtime.
So what we can do is we can put the value of we want the value of a to be logged when this break points hit and it won't pause execution, it'll just do the logging.
And then if we go through that dance of refreshing and triggering the error again, what we should find is when we go back to the console, will see that there's these thousands of lines of output, this is why a normal break point wouldn't have worked because we would have been stepping through each one of these lines, but at the bottom we find we get to the same result as we did with the conditional break point.
So there's a couple of different tools you can use in this case.
So now with this information, what can we do? We have to work out why it's working on some pages and not others.
So doing a simple grep in our assets, we find that it's present in the jira-spa.
So that's why it's working there but we also expect it to be present in the non spa pages. And if we search our build that we did with Webpack three that was working, we find that it is present in these search and start or components so that's definitely a clue that something's missing between the new version of Webpack and the old version of Webpack. Now, if this was a much longer talk, this is where I would go into a lot more detail about how we dug into the Webpack runtime, we produced a bunch of interesting charts that sort of talked about the different entry points into our bundles and tried to work out what was the difference between them, why one wasn't working and one was, eventually we find a version of Webpack four that did work and one that didn't, and so we used some git-bisect to track this down to a single commit in Webpack that was causing this issue.
And it was a refactoring of some chunk graph generation which even says it's an available modules optimization, so clearly a module was being optimised away because Webpack thought it should be available but it wasn't.
And so we had a whole bunch of information but we didn't have a clean reproduction case to give the Webpack team.
So we took what we had and we produced this very long git hub issue, and we took all the information that we had basically the commit we knew the problem was and hoped for the best.
And we're really lucky because the issue was identified by Tobias from the Webpack team within a couple of hours, and we had a new version of Webpack with a fix. And we even got a nice thank you for our detailed bug report.
That was nice to have.
And yeah, essentially that's pretty much where the story ends.
So after upgrading to that ficus Webpack version, we no longer experienced any customer issues. We're able to roll it out and it's been running ever since. In fact, in the next few weeks, we'll be looking at what it takes to upgrade to Webpack five.
We're gonna go early rather than late this time. So there's potential material for our sequel talk for sure. So one of the key lessons to take away from all this. First of all, understand what tools you have available when things go wrong, I mean, it's hard to sort of know everything that's available straight away, but like you get this with experience, you use this tool, that tool, and then eventually you remember, hey wait, I remember I used this thing back then that helped with this particular issue.
Maybe I can try it for this issue.
And it helps to have that sort of that arsenal of tools and play around with them. Secondly, you find others with your problem and how they've solved it. So we're really lucky in that there was a solution for recording CPU profiles from Webpack in CI.
And we were really lucky that something like patch-package existed so that we didn't have to deal with all sorts of unusual hacks in order to get that source map fixing.
And last of all, it's not always your fault, we spend a lot of time assuming that that Webpack issue was something we were doing that was unusual, but in the end it was actually a bug in Webpack. So raise issues with open source projects, but then do homework.
So if we hadn't have provided that information that we gathered through like days of falling through Webpack code and trying to reproduce it, then it probably wouldn't have been fixed as quickly as it was.
And that's it. Thank you.
(upbeat music)
Error on line 1, column 6532112 of bundle.js? Out of memory error trying to load a CPU profile into the Chrome debugger? Two minutes to see wait and see if a change you made fixed a bug?
While upgrading our complex web application from Webpack 3 to Webpack 4, we ran into these of challenges and more, that required adapting my use of debugging tools and techniques to deal with the scale of the problem.
As your codebase grows the debugging techniques you apply need to adapt – things you take for granted like setting a quick breakpoint, reproducing a bug in seconds, or loading a CPU profile into the Chrome Dev Tools start to break down.
This talk dives into the different issues we encountered, and how we debugged and fixed them – providing practical examples, and tips, for debugging JavaScript in the Browser and Node as your codebase grows, that provide a valuable addition to any developer’s toolbox.
JavaScript debugging the hard way
Marcin Szczepanski, Principal Developer Atlassian
While this talk is about debugging, it’s mostly the story of a particularly difficult Webpack upgrade. While that might seem an unusual thing to have trouble with, the sheer size of the JIRA codebase turns it into a challenge.
JIRA’s codebase had 2,018,981 lines of code as at 2020.07.09 (not including external dependencies); and most of this goes through the webpack build.
This produces 200megs of total JavaScript assets, and 300megs of sourcemaps. Thankfully this is served in a very granular way, but the total is pretty big. The build took about 20 minutes.
So they needed to upgrade from Webpack 3 to 4 and scheduled a week to do it, based on previous experience. As you can guess from the fact Marcin is here talking to us… it did not take a week.
Normally you’d start with a minimal local build to see if the config is working, then push up to the CI environment for a full build.
But while it worked locally, it was timing out in CI. The main difference was that CI was not just emitting code, it was generating sourcemaps and running minification as well.
But to complicate matters there was a problem that made local builds run for over two hours, making repeated test runs impractical.
So they turned to profiling to work out what was going on in CI.
The most common types of profiling are memory and CPU; this talk will focus on CPU profiling, using flame charts and tree profiling.
Usually they’d do this locally by running webpack via node and using the node inspector:
node --inspect-brk ./node_modules/.bin/webpack
…but it was running out of memory. Eventually they found the cpuprofile-webpack-plugin which allowed them to generate a CPU profile in CI.
Comparing a typical flame chart for a normal build, they found the sourcemap stage was taking far longer than normal. The tree table view confirmed that the split function was the source of the problem.
They tracked that back to the sourcemap library, finding it was calling a regular expression a lot and triggering a great deal of garbage collection.
Then they discovered they were not the first people to find the problem; and they’d fixed it in sourcemap – but that hadn’t made it into the Webpack codebase due to breaking changes. So why not backport it? Someone tried that too and the fix wasn’t accepted.
So what do you do when one of your upstream dependencies won’t update and you need the new version?
Forking was impractical in this case as you’d have to fork everything that referenced it. So instead they used patch-package to install the fixes during bundling.
So happy days, the build was working again and back to a normal build time. Time to get this in front of internal customers and that worked, but as soon as it went live to a small initial cohort people started reporting that the navigation wasn’t loading.
Browser dev tools to the rescue? They discovered an undefined error related to the broken feature; and after some digging through minified code, tracked the problem back to the webpack runtime.
Debugging this is difficult. A normal breakpoint is impractical as it’s called too many times, so you have to use a conditional breakpoint. They use a type check to only trigger the breakpoint when the undefined condition is met. This revealed which module was failling to be found.
There’s also a log point, which is a conditional console.log, which would also have located this issue.
The problem ultimately is that the component wasn’t being bundled in Webpack 4, when it was in Webpack 3. They were able to bundled up all the information they had and provide it in a Webpack issue; and ultimately a new version of Webpack fixed the problem.
Key lessons:
- understand the tools available to you
- find out if others have hit the same problem before you
- raise issues (just do your homework first!)