Why Data Science and UX Research should be Best Friends
Well, I hope you all had a good lunch.
For some reason, I always seem to get stuck with the post-lunch talks, so I'll try my very best to keep it engaging and interactive and not put you to sleep.
Okay.
Any guesses what this number is?
This is 64.2 zettabyte of data, and that number is the data that was produced in the year 2020 alone.
So one zettabyte, they had to come up with a new unit called zettabyte of data, which translates to 1 trillion gigabytes.
Of that, 80% of the data collected by enterprises is unstructured data, which means it could be an audio or video document.
You don't really know what sort of structure to expect.
Surprisingly, though, only 2% of that data is saved next year.
So we are getting rid of almost 98 percentage of this huge trillions worth of gigabytes of data.
Now, keeping these statistics in mind, how confident do you feel that you are leveraging the data to the best of your abilities?
Hi, I'm Grishma, and I'm here to convince why your user research and design teams need a data scientist.
So, quick show of hands, how many designers, design teams do we have over here?
Okay, how many user researchers?
Okay, any data scientists over here?
Devs?
Okay, a lot of you developer folks.
Great!
So yeah, this is what user research and user experiences about.
We hear a lot about user experience, but what does that mean?
That's the end-to-end interaction with a system, with a product, with a service, and user research is the methodology that you use to understand: what are the users' needs?
What are the users' wants?
What are they looking to do within your product?
And these are obviously bad user experience examples.
My favorite one is this cake that's shaped like a dog.
What's gonna happen?
You cut the cake, so that's a bit of cringe number one.
Cringe number two; the cake is made of red velvet, so when you cut it, it's gonna ooze, and the last cringe is that this was the cake for a birthday party of a kid with multiple kids who started running away crying, thinking that a dog had been murdered.
Yikes!
So far, I've been showing you examples of user research and user experiences in real life, but of course, we're at a tech conference.
We're gonna be talking about software and products, and let's be honest, how many of you have had arguments because of this?
No one?
You're all lying.
Come on!
You haven't accidentally sent a wrong message to someone and then deleted it only for WhatsApp to say, "Tell them you know, Hey, she deleted a message.
It's probably bitching about you." So all of this to say is that data is the language your customers are using to talk to you, right?
It's the usage data; it's the feedback data.
That's their way of communicating with you, and you've made a change to their experience, you maybe made it better, you maybe made it worse, or you maybe made it more frustrating: you can measure all of that with data.
That's them speaking back to you, and that's what's very essential for us to look at the data and understand what they're trying to convey.
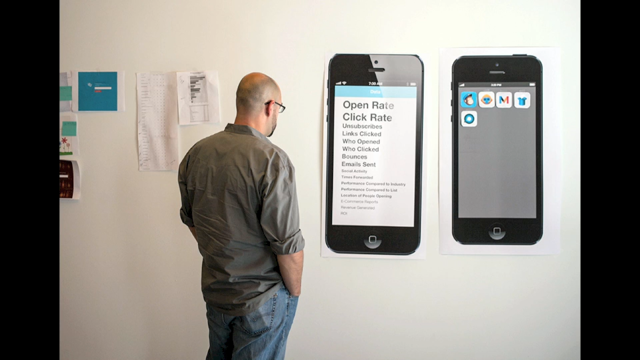
So what are some applications of data science and user research?
You can detect user' struggles.
Are there particular Web pages where people are having a lot of problems?
You can test hypotheses.
You can identify a different user segments and personae; maybe there are particular people who come to your product once in a month, maybe there are daily users?
Analyze usage patterns on a similar line.
Predict user behavior, it's almost like having a crystal ball.
Prioritize and evaluate features.
Which feature matters the most to your customers?
Triangulation with qualitative research because we want a holistic understanding, don't want to look at just one piece of the picture, and also personalization; that's the end thing, right?
Having personalized landing pages, personal profiles.
So these are some of the applications in user research and design that data science can help with.
So before we delve into the details of what data science is, some terms over here: Data is any piece of information that can be stored, that can be processed, that can be transferred, and data science specifically refers to methods, processes, jurisdictions, algorithms, anything that you use to help you make sense of the data.
Now, you've obviously had heard of machine learning, right?
It's hot; it's the in thing.
Machine learning has overlaps for data science, but it specifically refers to systems where the data can learn without you explicitly telling, "Hey, there's a pattern here." So data is good.
Machine learning is good at finding out those patterns on its own.
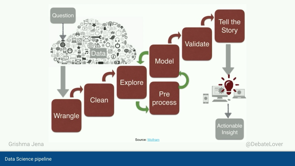
This is what the data science pipeline looks like.
You start off with a question, data, wrangle, clean, explore, model, pre-process, validate, tell the story, actionable insight.
Got it right?
Perfect!
I'm gonna grade you on this and you're gonna score a hundred, right?
Okay, jokes aside, I'm gonna give you a very quick crash course and then we'll go into the fun stuff.
So we start off with a question that you want answered.
Hopefully, you have a question in mind.
If you don't, that's completely fine, you could also start off with data and then think about what questions that data can help you answer.
So hopefully you have a question that your stakeholders or that you want answered.
Maybe it's about who are the next thousand customers we are gonna lose, and why are they gonna leave our product?
Maybe it's about are we selling the right things?
Can we monetize it more?
So those are just an example, examples of questions that you could answer using the data at.
Next, of course, data science is incomplete without data.
Now, data can come from a variety of different sources.
You could have structured data, which is your row column, tablet format, your traditional databases.
You could have unstructured data, which is video, audio documents, and then you could have semi-structured, which is a bit of both.
Kind of like an email where you know, you, there's a subject, there's a center, there's a receiver, but the content of the email could be unstructured.
So question, data, and then you go through the processes of wrangling and cleaning the data, because, let's face it, the data is not gonna be perfect.
It's not a school project where you're told exactly what you have to do and what output you should get.
It's gonna be really messy.
You need to understand, do these values make sense?
Are there duplicate records?
Do you need any scaling normalization?
So that's the fun stuff over here.
Then comes exploration, which is kind of getting your feet too wet with the data and initial investigation.
This is where you start to understand, "Okay, these are some important characteristics or this looks interesting; I did not expect this usage behavior from this particular set of customers." So just kind of getting a little more intimate with the data and the characteristics over there.
And then Model building where you try to understand what are some of the important features.
Yes!
This is an actual example of dog or muffin, which is a classification problem in machine learning.
So yeah, you try to understand what are some important features.
Maybe in this case, is there a cupcake liner that could be a feature.
That's a cupcake.
Hopefully, it's not a dog wearing a cupcake liner.
And then you have some training and testing sets.
The training set is what is the data that the model is trained on, and testing is basically what it's gonna be quizzed on.
And then, of course, if you're quizzing, if there's an examination that we are talking about, there has to be grades, there has to be scores.
So that's the model evaluation part of it.
And here you can see some examples of how accuracy and precision could be two metrics that you used to understand.
Is this a dog?
Is this a muffin?
And finally, the last stage is data visualization and storytelling.
It's gonna be pretty much useless if you have a question, have the data go through cleaning, go through wrangling, modeling, but you don't really have an end result, right?
What do you do with the knowledge that you gained?
What do you do with the insight that you have?
You're hopefully gonna take it up with your stakeholders and maybe recommend actions, saying, "Hey, we need to change this feature, or this product is not doing so well, maybe we need to market it in a different way." So that was a very quick introduction of what the standard data science pipeline looks like.
Now, let's enter user research into the picture.
Here's this interesting what-why framework, that I believe came from Spotify.
And you can see there's actually a lot of similarities between the kind of work that user researchers and design researchers do and data scientists do.
So you can see, data scientists are over here; they're dealing more with numbers, quantitative data, trying to look at the aggregate, understand patterns that exist, and then on the other end, you have qualitative data, where they're trying to look at understanding why something is happening?
How is that making your end users feel?
What has their experience?
What are their pain points like?
To give you an example, let's say if I was offering free ice cream here right now.
How many of you would take it up?
Maybe not all.
Maybe you'll think that this ice cream has expired, or maybe you'll trust me and you'll jump at the opportunity.
So-called quantitative method would be me observing how many of you are taking that free ice.
So that is more on the numbers side.
That is looking at the aggregate, the overall trend.
And qualitative would be me coming up and saying, "Hey!
Natalie, you didn't pick an ice cream.
Are you scared?
Do you think that's not good?
"So kind of understanding the "why?" behind the "what?" that has happened.
Okay.
I'm gonna pause here quickly.
Any questions?
Okay.
Alright, so now we look at some case studies where a lot of these successful companies that you've probably heard of have employed data science and user research.
They've worked together, they've collaborated, and they've come up with really interesting examples and results.
So one of my favorite examples is Airbnb.
It's actually known in the industry to be at the forefront of having data science and user researchers, and designers come together and work in a very holistic, cohesive manner.
So the first one is that, a data scientist actually was going through some of the reservation data and they understood that there was actually a different trend for if a particular host would accept a reservation or not.
So they have these machine learning models created, and what they're gonna show you on the webpage is anything that has a host who has a greater likelihood of accepting your reservation.
And the data scientists actually looked at that and understood that there were different trends emerging for small and big cities.
People in big cities wanted to have huge chunks of time given away for their Airbnb, but people in smaller cities wanted a bit of a break in calendar gaps, very interesting things.
I don't really know what the reason is; my hypothesis would be, maybe people in big cities, you know, it's gonna be more expensive rent.
They probably have just a one-bedroom apartment or a studio, they're going away for a long period of time, and they wanna maximize the amount that they could earn.
But maybe people in smaller cities have huge homes.
Maybe they're just giving one bedroom away, and that's okay with them.
You know, it doesn't have to be utilized 100%.
So that is one example where Airbnb used a lot of data to understand what are the preferences of the host, depending on where they're located.
The second one is back in 2014; Airbnb had a different layout than the one that we see and know right now.
And on their landing page with the reservations or with each of the bookings, they would have an explored the neighborhood.
So you'd have a gallery of pictures that shows maybe a cute garden nearby or a park nearby.
Some touristy things to do, and what would happen for users from certain countries of South Asia was, that users would click on the neighborhood link, browse the beautiful photos, completely forget what they were doing, and leave the website.
That's not what Airbnb wants, right?
So a designer ,and an engineer, and a data scientist, I think it was a group of three, they got together, and they said, "Okay, we are noticing that there's some discrepancy in the usage.
This is not expected.
What can we do?" And what they did was, for that particular segment, for those South Asian countries, they had a new landing page come up, which said," Hey, here are the top destinations in your area or in your region." And that led to an increase of 10% in their conversion rates.
Pretty amazing, right?
Just because of that one redesign.
And finally, the last example from Airbnb is that it showed a skewed search result to users.
Now, what does this mean?
Initially, when Airbnb started, the way they would show their reservations or the places would be, okay, look at this particular address that you have searched.
Maybe it's here in ,maybe it's in San Francisco, because I'm familiar with San Francisco, not as much with Sydney.
And they'll say, "Okay, show me everything within five miles of the Golden Gate Bridge." And that would be the top results that you see.
Now, they started noticing that users were maybe not always interested in five miles of the exact area that they were looking for.
Maybe I wanna stay at a hip, nice, trendy neighborhood that has a lot of nightclubs, a lot of restaurants.
So instead of labeling all of this data manually and going out and saying, Hey, San Franciscans, could you tell us what are the most amazing neighborhoods?
What are these different labels?
How do we assign them?
They had the data from the users searches informed these models.
So the likelihood of users coming in and searching for the Mission neighborhood, which is a pretty hip neighborhood in San Francisco close to nightclubs, close to restaurants, was very high.
So immediately they would say, "Oh, you know what?
A lot of users in the past searched for Mission neighborhood in San Francisco," and this new user is also searching for San Francisco.
Let me add the two together.
Let me create a model which has conditional probability.
The likelihood of them searching for something in Mission neighborhood is gonna be very high, and let me show them the Mission neighborhood's results.
So that was a user data driven search, which is very interesting of how they actually used data from other users to inform the kind of experience that you get.
Okay.
So, so far, I've been telling you about how data science has been helping user research.
There was a very interesting example from ABN AMRO which actually wanted to do something that was sort of tagging.
You have these support tickets come in, these customer service requests come in, and they wanted to add some metadata in the form of tags, which would help them do a quicker, you know, service for the customers.
So this group of data scientists comes together, and they have the most amazing machine learning model; throw in a lot of data, throw in a lot of human input, it's performing amazing.
The metrics we talked about, position accuracy, great through the roof, 90%.
People like the idea of it.
User research confirms that yes, people do want something to support, agents do want some sort of a recommendation that could make their lives easier.
Everything looks great!
Now, they implement this, they go out in the wild, and they test it out.
Absolute disaster!
Any guesses why that might have happened?
Looks good on paper.
User research said it's fine.
People like the idea of this.
It's a feature they want.
Well, what happened was that the model was so good at coming up with results.
It came up with 30 tags at once.
And now our customer service agents, instead of manually thinking of four or five relevant tags, were endlessly scrolling through a list of 30 different tags, which increased the time to task.
It took longer for them to complete the job that they were doing very well manually in comparison.
So this was an interesting case of why data science, machine learning isn't always the answer.
There has to be a human in the loop.
There has to be user research coming in and seeing what that user experience actually is like with machine learning with data science involved.
And of course they went back, and they came up with a good number for, you know, let's not make it too overwhelming, but let's give them enough information.
But that was definitely a place where user research was a missing piece of the puzzle.
Okay, so far we've been talking about a lot of areas where we already have data existing, but Google AI did something very interesting.
What they did was, and for my user researchers, designers out in the audience, you all realized that conducting usability tests is expensive.
It's time-consuming.
You need to find the right participants.
You have to have them show up because you know you face cancellations.
Not everybody's willing to give their time.
You need to give them incentives, and hopefully they're familiar with the product or the kind of job that they're trying to do.
So the deep learning engineers at Google, along with user researchers, came up with the idea, "Hey, can we train a machine learning model to behave like a participant and do the usability testing for us?" And guess what?
They trained it with a lot of data from the previous participants, and this model came up with 90% similarity as compared to human participants.
And the kind of input this model had was look at the buttons, look at the colors.
So, you know, blue is a hyperlink.
Okay?
So that predicts stability of an element.
Is the font big, is the font small, the size of the buttons still out of the canvas?
So these were the kinds of features that were fed into the model.
And then, based on the past data that it had learned from the participants, it was able to identify what is stackable on a particular UI or a screen.
Okay.
I am gonna have a short trivia, well, just one question here.
Let's see if we can hear this.
Okay.
I can hum the song.
Can anyone guess what it is?
Anyone?
I didn't do a good job of having it, so I guess it's okay.
Well, that was a clip for the intro of, "Sorry" from Justin Bieber, which went viral a few years ago.
Right?
I'm sure a lot of you have seen these viral ads from Spotify where they pick a person who is kind of an anomaly and basically embarrass them.
Thankfully not by name, saying, "Hey, your person you listened to, "Sorry" 42 times on Valentine's Day.
What's wrong with you?
What did you do?
Are you okay?" So that's something creative, creepy.
Depends on what, how you think that Spotify does.
They look at these anomalies within the data, and they use it to market their product.
So Spotify again is a great company that does a good job of having user researchers, designers, and data scientists work in conjunction with each other.
So there was this one interesting case study from Spotify Australia initiative, and what they were doing was that they were looking at, they had still there was this concept of skipping ads, right?
And they were looking at all of the data who they thought were par users.
And there was this one particular person who was, seemed to be hitting some sort of limit.
This person was not skipping more than six ads, and that was strange to them because it's unlimited.
There was you know, premium version that they were trying it out, this feature.
So they went with the engineers.
They were like, "Is everything okay?
Does the system look fine?" Like, yeah, everything looks good.
Then they went to the user researchers and said, "Can we do a diary study?
Can we understand why this is happening?
What is this person thinking?" And they speak to this user.
And the user says, "Oh, you know, I can only skip six songs in an hour, and I thought the same limit applied to ads.
So I would just skip six ads, and that's it.
I would never try skipping more because there's a limit, right?" So this was a very interesting moment where the data scientists got something that looked a little interesting, a little funky bit of an anomaly, and they went to the user researchers and the user researchers did a diary study, and then they went, and they actually talked to this participant, and they understood why this phenomenon was happening.
So this is anomaly detection where you have, again, the best of both worlds coming in.
So hopefully I've given you kind of an idea of different case studies out there where user researchers and data scientists have come together.
They both have very different strengths.
As we just saw, data scientists usually, again, not always, usually focused on a lot of quantitative numbers, numeric data, and user researchers focus on a lot of qualitative data.
The why, the how, right?
How is this making you feel?
Both look at the world very differently.
So you'll have new perspectives coming in, but at the same time, they have the same destination: trying to understand to the user, trying to cater to the user's needs, and obviously having some impact.
A holistic understanding of multiple forms of data, which again is what triangulation does, where we have qualitative, quantitative data and that also helps us mitigate the cons of any one particular research type.
So that's where your mixed methods research comes into plain.
Blending people and data together, which is great.
That's exactly what we want ,and also helps keep biases in check.
And by biases of course, there's the whole mixed-method, you know, you are eliminating the cons of one, but the other thing is also that as a data scientist, sometimes it's very easy for us to forget that the data we are looking at has actually been generated by humans like you and me.
It's easy to think of us just as statistics as any other number.
And in my experiences working with user researchers, I've always felt that they have added the human touch, the human element, where they remind me that, "Hey, this is not just numbers in a spreadsheet.
It's not just, you know, quant data in a database." These are people out there who are using a product or using a service, who are happy with the experience, who are frustrated, who maybe cannot, you know, need to go and take a nap because a product was so frustrating for them to onboard.
So they're always coming in with this different perspective, and which is why I feed this code from Ovetta Sampson, from Microsoft, is so relevant.
"All data is created by people, and all people create data.
And unfortunately today we are divorsing people from their data, and giving companies license to forget about the people who are behind this data.
It allows us to divorce ourselves from the responsibility of what that data can do." And this goes into a huge discussion about the ethical implications, and you know, the biases, equality of all of that.
So I can feel that this is really important to keep in mind, and as user researchers, as designers, you all generally have a huge sense of empathy, compassion for the users, which data scientists, engineers can sometimes lack.
Again, not stereotyping, but that's how my personal experience has been.
So I feel like it's a really good perspective that they bring in as well.
Okay, so we saw what data science and user research can do.
Hopefully you got a flavor of the different applications, some case studies.
You got a very quick crash course on what the data science pipeline looks like, what data science are capable of and not.
And I guess your question now would be, "Okay, Grishma all of that sounds great, but what do I do next?" Like just gonna listen to this presentation, forget all about it.
Maybe two years back, come across Spotify fans like, "Oh yeah, there was that random person talking about some skipping ads." Yeah, whatever!
You wanna take something out of this, right?
Some actionable takeaways, hopefully go back and feel inspired to make a change.
So just a few pointers from my experiences.
So the funny thing is this role was kind of created by me and my vice president at the time, and he said, "Hey, we have a bunch of data.
We need a data scientist for the user research team.
Do you wanna come on board?" I said "Okay!
Sounds cool, sounds challenging, different." I don't know what to expect.
He didn't know what to expect, and I spent a lot of my first year, my entire year talking to a lot of different user research and designing teams and the first impression would always be; "We have a data scientist.
Yes!
Yes!
We needed you like yesterday." I'm like, "great!
How can I help?" Uh, "what exactly does a data scientist do?
Like, I know you're cool, and you're awesome, and you can help because you know it's the new hip thing in the, in town, but how do you, what do you do exactly?" So I had to spend one year just having conversations, brainstorming with them.
"This is what I do, this is what I do.
This is what I don't, I'm not here to take away your job.
I'm not here to automate processes.
So you are, you know, laid off.
Nothing of that.
We are not talking with Terminators or anything here.
So just a few things from my experiences.
Here's what you can do.
Find the data scientists in your org or your company, and if you're a data scientist or the developer, find the user research or the designer in your company.
It could be your product; it could be your department.
Maybe you're a small startup.
It's all the same.
Find them.
Discuss your pain points with them, hear their pain points, and then start brainstorming.
Maybe you have a data scientist who is trying to make sense of why this anomaly exists.
Why is this person only skipping six ads?
Right?
And you can actually help them with that or maybe the user researchers need to see, okay, we're hearing a lot of these complaints from people, but we don't really know what to do.
Is it just one specific part of the population that's saying this, or is it more of a broader trend?
Do you have the numbers to back us up?
Do you have the evidence?
Start small; create prototypes, which we have been hearing in a lot of the stocks over the last two days.
Get buy-in from your executives.
That's the great thing about a working prototype.
Once you do something on your own, you can go back to your executive and say, "Hey, I have this idea.
I would like your buy-in.
Oh, by the way.
We already tried this, on a small scale, it works, and we've been seeing great results." They have more of an incentive now, right?
And then you quickly iterate on the projects and start using the data, your outputs, your result as evidence.
Very similar to our keynote speaker yesterday, she mentioned that she wanted the Boba emoji in the, you know, the unicorn org, but it never came true; she kept getting rejected.
And then a bunch of data scientists came to her and said, "Oh, here's the data to prove that Boba is actually very popular, and it's a billion-dollar industry." And then she, the emoji, got accepted, right?
Like pretty cool.
You actually have the data, and then you have a person doing all of this magic going together.
These are some of the resources that I am sharing for further reading, further understanding.
Hopefully for more brainstorm discussions with your user researchers, data scientists, designers, engineers, your peers in general and I hope they are inspiring too and can help you get started.
And finally, just a shameless blog.
I recently did a podcast with core user to UX, where I talked a little bit about my role and the whole, you know, what research ops is?
How we are doing user research, libraries, all of those fun things?
And of course, data science and analytics.
And these are a few ways to connect with me if you have any questions.
Thank you so much for your time.
I hope this was a new, interesting perspective that you got today.
And like the quotation in the last few slides said, it's gonna be useless if you have this data, but you're not actually driving a change or making an impact.
So I hope you can take something away from today's lesson and actually apply that to your workplaces or in your life.
Thank you again so much!
It was really nice having you.
Today’s world generates data at unbelievably rapid rates. It is important to leverage the available data to better understand the bigger picture. Data scientists and UX researchers often have the same destination but different routes. This talk gives an overview of how Data Science can complement UX research, including quantitative and qualitative methods.
It introduces the Data Science pipeline along with describing useful applications for UX research like identifying users to interview, finding different segments of customers and generating data for usability studies. It highlights interesting instances of how the two fields can help each using real-life examples from Spotify, Airbnb, Tesla, etc.
By the end of this session, audience members will have a better grasp of the capabilities and processes of Data Science. They will be able to identify opportunities where Data Science can support and enhance UX research. They will feel motivated to encourage their UX research and Data Science teams to work closer together to understand business and user needs.