The State of PWAs
Hemanth HM: Welcome to Web Directions.
In this talk will be looking into the state of PWAs.
I'm Hemanth, member of technical staff at PayPal, Google Developer Expert for Web && Payment domain a TC39 delegate.
And you can catch me at @gnumanth.
Let's travel The The year is July 11th, 2007.
That's just 18 days before the iPhone was launched.
And Steve Jobs was talking about this platform, which had Web 2.0 and AJAX and was secure and we could easily build and ship applications.
And he dreamt that this would be the means of building and shipping and distributing secure applications.
Yes, there was a browser and there was the web.
And that's what Steve jobs, envisioned apps to be.
But we know what happened later on.
We had app store and there was lot of money movement happening.
People did see a lot of traction in app stores.
And a lot of other companies started building something similar maybe Google Play store, or maybe Amazon store or, windows store.
And we all know the story where the app revolution and mistake them.
And we also know there are a few startups which went App only.
So they did have a website.
There was an URL, you clicked on it and it said, please go and install this application, the native application to get the experience or to use our app, or some of them did have sites, which said, this is best viewed in our app.
Please go and install our native app and a lot of startups and huge companies kind of face challenges by going on App only mode.
And we all know that history.
Come back to 2015.
The gentleman here on the screen envisioned something called PWA.
PWA stands for Progressive Web App.
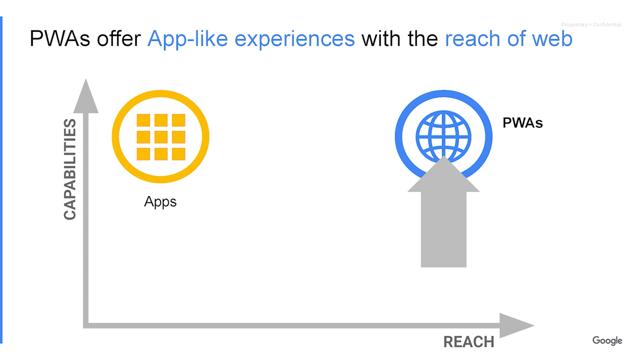
A Progressive Web App of a Web App which progresses itself to a native look and feel app, right?
So basically it's built with Web technologies, maybe HTML and CSS in JavaScript or a few frameworks to help to build it at the crux it's web, but behaves like a native app . To quickly look into a a PWA.
It basically provides you the functionality of installing the application to your home screen, like how we'll do with native apps, so that you've got added to your home screen and click on the icon, then it would launch, and it would have a splash screen to say what an application is about and the most interesting aspect it works offline.
And there are a lot of other features that get backed into it may be like background sync background fetch notifications and likes.
The success story of PWAs is huge among that there are some of the picked use cases.
What we have here, where Twitter, reduce the data consumption by 70%, Alibaba increased this conversion by 76% Ali express included increase the time spent on the site by 74%.
The Washington post improved its performance by 80%.
OLX is one of the leading applications in India, which kind of helps you to sell and buy goods online, increased its engagement by 250%.
OpenSooq generated 260% of more leads and Flipkart increased its engagement by 40% and we see whopping numbers of increased performance, engagement and conversion all happened because of PWA.
Maybe the lightweight that PWA provided are, like less affection and installation, and especially for you know, devices with less capacity in terms of storage or processing abilities, PWA was a really very good use case and we saw a lot of victories and we are seeing a lot of victories happening in PWA.
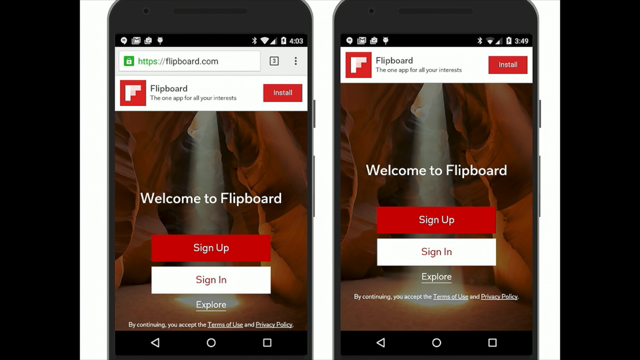
Early examples I remember of repeatably is Starbucks as you can see on the screen help you to add at your home screen and start an order and do everything that you will probably do on a native app or on our own website but as a PWA Well that's the state of PWA, and that's the history and present of PWA and thank you.
Well...actually welcome to Jurassic park.
I'm talking about the Web Almanac.
The Web Almanac is a project by HTTP archives the idea of Web Almanac is to provide insights and reports of the state of the Web.
It's not just about speaking about what are the new features that are available on the technology or what are the upcoming features and proposals but rather looking into the real data from HTTP archive and gathering information and extracting information out of that raw data and presenting it in a beautiful format in terms of graphs and charts and numbers and explaining what each feature is really about in terms of consumption, based on the real data, and some useful insights and some interesting anecdotes from the raw data.
So the 2020 chapter edition basically had 22 chapters spanning from aspects of page content, user experience, publishing and this move and lights . Out of which Chapter 14 was PWA And I happened to be the author of this chapter, but without the help of the reviewers and the analysts I could not have done it.
And it would be not right on my part If I didn't mention all the efforts put in by the reviewers and especially the analyst in terms of churning the raw data, helping us to generate the graphs, and giving us more insights from the raw data which helped us to shape this Chapter.
And so I'm mentioning all of them on the screen and thanks to them without them this chapter would not have happeneed.
Let's get into the methodology and understand how Web Almanac uses this raw data, and what is the process of basically authoring this which kind of gives us the perspective of the state of the web and in this particular use case it's the state of the PWA.
So Step 0 basically is to form a content team.
In Step 0, we kind of put deadlines to ourself and say these are the project owners.
We have the author, and there might be multiple authors for the chapters, and they happened to be like the content lead.
And then the content team has at least one author, one reviewer, and one analyst.
There can be multiple of this but there must be one, and hence, a team of an author, and a reviewer, and an analyst is formed, and it's all open and happens on Github, an issue is created and the issue is linked to a parent issue which says these are the chapters we are going to author this year, and these might be the potential authors.
Do you have some solutions?
Do you have someone you think could author this chapter and it's all open to a submission and if folks agree they can be the authors or the reviewer based on their expertise.
And Step 1 is to plan the content.
The content team has completed the chapter outline at this point of time.
We have the list like a table of contents saying that these are the things that we think make sense for this year's chapter.
So for example PWA or SEO or if you have some of the capabilities all of these are different chapters and each of the chapters would have their own outline And by a particular deadline we kind of set it to ourselves saying that by this time let us come up with an outline And we happened to meet as often as we can, probably on chat or sometimes on call and try to come up with this draft document saying that what roughly this Chapter would cover.
And then the analysts have kind of triggered these feasibilities of all the proposed metrics So we kind of say because we have this draft content and the analysts works and says is it really feasible for us to catch this information or not ? Gauging what we could pull off the raw data.
Right, and of course the logical step next is to gather the data, so analysts have added all the necessary custom metrics and the draft PR to track the queries and the progress Basically you run a crawl and check whether this metrics makes sense and here's how they draft to a PR for the custom metrics look like.
And then the analyst have queried all the metrics and save the output to the results sheet.
So basically we have a results sheet which all of these grades output has been in effect with that result sheet and saved in the results sheet and varying we go through that present sheet analyze and look for anomalies and try to clear it, or we would take a look to see what are the new insights that are available from this data.
And then the results are validated.
The content team has reviewed the results sheet, as I mentioned we go through the sheet and see if all the data that we have gathered makes sense.
Or does it looks there is some kind of a deviation should we leave this as a query or does everything looks fine.
And also is it in sync with the the draft, what we have formalized with the data what we have gathered can we make a meaningful visualizations, or no?
Or should we gather more data.
The final step here is to draft the content.
So authors have at this point of time have completed the first draft in the doc, like end-to-end what each subsection in the chapter is talking about, what on the different aspects that we want to describe, so if it's more like a draft and the content per time and visualized all the data that was gathered in the previous step.
The raw data that was saved at the results sheet, now we have visualizations of that data.
So it's more about getting this idea of whether the the content is reflecting exactly what's been visualized and the learnings that we found from the raw data is it equally depicted or not.
And finally, it's publication time the content team has reviewed the final draft and it's converted into a markdown, and a PR has been filed and then we have a target launch date and we go ahead and launch.
So this is the entire process of how each chapter is authored or realized, right?
So they the amount of work that goes in is intense, and everybody are equally involved, maybe the reviewers, analysts or the author , and hence they provide this beautiful chapter and each of them go ahead and carry this process and each chapter gets compiled, and then we finally have pages that gets released online.
So at the crux of it all we have is the HTTP archive raw data, and the BigQuery magic that runs on this raw data and fetches the metrics for us that we are interested for a particular chapter and in this case PWA.
And then we go ahead and visualize and generate meaningful graphs and insights and information from the grind.
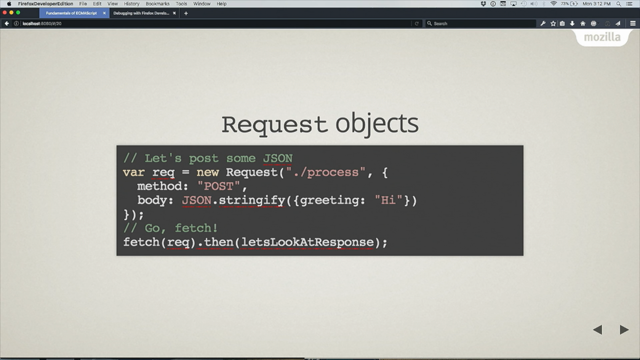
Here's an example on how the BigQuery would look like In this example we are going through the HTTP archive Almanac service worker and we say select star from that particular database and limited by thousand, and just as an example and you can see the Table schema has date ,client, page, URL and body.
And that's what gets written as JSON, and based on that we could derive whatever thing that we are really interested in and pull it.
This is just an example of a service worker but the HTTP archives kind of provide some insights on different metrics, and there are different attributes that we can gradient and pull the data.
Here's an example of a service worker adoption.
Here we are saying from HTTP archive blink feature usage where feature is service worker control, fetch me all of this num_urls as frequency total _urls as total and pct_urls as pct.
We ordered by declined and in a detrimental fashion on the day and we could get the service for production . So each of the metrics that we will see from here would have its query associated with it, and from that query we got the data and that data is visualized.
So what we're seeing here in the background is that sheet, the result sheet, so the output of the query is basically saved into this results sheet.
In this case you are seeing the popular PWA libraries, of course, what box is the popular in this particular scenario?
And you see there are different pages here maybe the lighthouse PWS, core popular PWA libraries, service worker events, service worker objects.
So each of the metrics in itself is a sheet in this results page basically And then you can we go through each of these reserves and try to generate this graph and also look into if there are some anomalies and if you have to read on those queries and fix them.
And here based on this we have lot of metrics that's been generated, from this late onwards let's say to dive into those metrics let's see those graphs and see what meaningful insights weren't derived and that kind of defines the state of PWA right here.
Let's dive into Service Workers.
Service Workers are the heart of PWA.
It helps us to control the network rather than the network controlling us.
Here's a snapshot of the draft Second August, 2021, yes this draft is actively being polished for the new requirements as and when we are progressing and as and when the web is progressing and it's we have this excellent authors who are very active and making sure that the draft is meaningful and has newer and better features being added into the spec.
And what we have here is the timeseries of a service worker installation.
If you look into this graph we see that 0.88% of desktop sites and 0.87% of mobile sites use Service Workers.
While that usage my seem pretty low it's important that we realize that the other measurements equate to 16.6% of the web traffic which is really huge.
Right And then the difference is due to the high-traffic websites tending to use Service Workers more.
So here you see the green graph is representing the desktop and the blue is representing the mobile.
and this is this will be the legend through our entire chapter of this book where we are we seeing different metrics of peer review.
And what we saw now was the timeseries of, service installation.
Lighthouse is one such beautiful tool which helps us to measure the performance of an app we have application it also gives us insight in terms of Progressive Web App or in terms of accessibility, and the latest has these many metrics and they have their own waves and you could change it up for your need and create your own custom metrics if you required.
The things that it measures is the First Contentful Paint, the Speed Index, the Largest Contentful Paint, Time to Interactive, Total Blocking Time and Cumulative Layout Shift, and not diving deep into what each of them really mean but we use lighthouse to kind of derive an audit.
And from Lighthouse audit with weight of these let's see what is the like the percentage of users of these audit metrics that we were interested in.
So we looked into the PWA category of audits gathered over like 6 billion pages and this gave us a great insight and few important touch points.
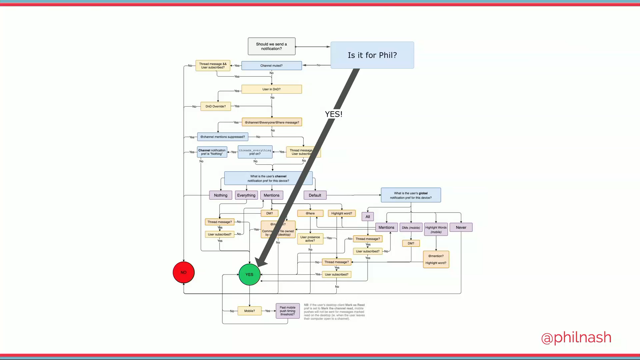
If you look into the audit, the load fast enough for which is weighed at seven points I had a percentage of 27.97% ,works_off line was 0.86% and installable_manifest was 2.21%, ease is-on-https or even with the weight of 2 had 66.6 7% And redirects-http was 70% of viewports were 80% You could see this because the browser kind of punishers the applications if they are not on htpps it it's kind of gives a red warning saying that Hey this site is not secure and of VC, all of that, that's why the percentage there is pretty high And we also had the apple-touch-icon around 34.7 5% and the content-width a 79.37% We had the maskable-icons are on 0.11% which is one of the new features that we have the offline-start-url is also one search where it was around 0.75% service-workers gathered about 1.03% and splash-screen for 1.9% and theme-omnibox was 4% and site without-javascript was a whopping 97.57% . This was some of the inciting, interesting insights from latest audit that was gathered during this exercise And whenever you're looking to this animation from Jake from Google it talks about different phases that the Service Worker can be.
It may be in different events are that the Service Worker listens to and responds to, and hence we kind we kind of created this graph that using the data we gather for the most used Service Worker events.
The results for mobile index stop were similar we had installed, fetch and activate being the top 3 of the data we gathered and then it was, we had the notification clicks, push, message and notificationclose.
It's interesting to see that installed, fetch, and active placed in the not the top three of the data that was gathered, definitely makes sense because that's where the offline capabilities of Service Worker is used, whereas sync being pretty new, relatively new, and the adoption rate is low That's why it's down like the last 1% And then we see notification and push happening.
So in terms of events we had installed, active, and message and on functional events we had fetch, sync and push, and this was the data for desktop and mobile for 2020 for Progressive Web Apps, especially for the Service Worker events.
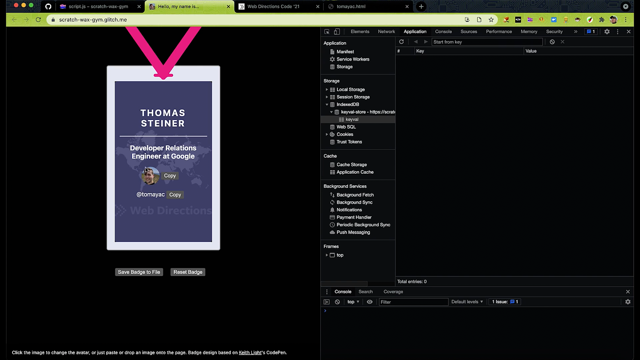
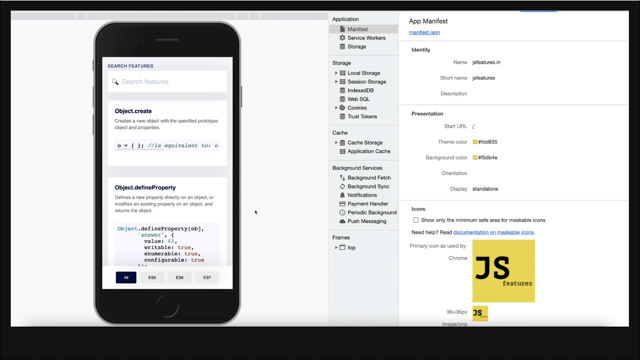
So,let's talk about manifests Json, so manifest json is on directs the application on how it should look in terms of the splash screen on the theme, or the icon on the home screen, and what should be the theme color, what should be the background color, what should be the name, the short name and all of this is described in the Manifest JSON.
So here's an example of JS features which is a PWA and we have these values in its manifest which can be easily seen in our inspector using the Chrome inspector and going to the application tab and hitting our manifest So we created insights on manifests and Service Worker if you see the manifests usage is around 6.4% and 5.6% when a Service Worker usage is 0.76% and 0.84% and use cases where both of them were used as 0.59% And 0.68% This sounds really interesting right?
So if you have an application which JSON manifest on it doesn't make it a PWA .So for PWA to happen we know it should have Service Worker,it should have offline capabilities.
Without Service Worker just having the manifest, it it was kind of interesting, why would that use case happen?
And that is because the large part of the web where the CMS driven applications like like WordPress or Drupal or Joomla have manifest by default and they might not have Service Workers, and that's where we have we had manifests with application which had just manifest and didn't have Service Workers and 0.59% and 0.68% was applications which had both, so that was a really interesting insight, and when we were looking at the audit it was like pretty puzzling that way.
Like there are so many applications with just JSON manifest and then like based on the data we were able to derive, from where are we getting those manifests, what type of sites are there.
And that's when we were able to derive that it was from a CMSs like WordPress or Luna or Google.
Manifest properties on Service Workers is one of the other interesting graphs.
You And approximate.
you could see that name, display, icons, short_name and start_url, theme_color background_color,all of these are on top on almost like equally scoring ,and it really makes sense, right?
Because you're if you have a PWA without these basic attributes it doesn't really make sense.
What And, would it be if without a name or what would it be if you don't put a theme color and then we had the Google cloud messaging center ID and we had the scope description orientation and language and an interesting thing that we found in the data was this common typo that was there in terms of theme color So the theme color was spelt in different ways and basically they were typos, it was more like theme hyphen color theme underscore color theme with capital T and small and C underscore color And the other one we saw was a orientation.
So we saw a lot of typos in this and probably editors and leaders can kind of catch these if you have a manifest blender, of course they wouldn't be many such small modules but that was an interesting insight that we had while we were digging through the data And let's talk about this Display Mode which is one of the interesting aspects within an app.
You could think of Display Mode probably the table should be read from bottom up.
You kind of think of a browser like a full-blown browser, which is the display module, say a progressive application has the complete browser functionality or it can be a minimal-ui or it could be standalone or fullscreen based on how you percieve your app should look like.
So if it's a full screen, then there's no address bar or nothing, but the app opens in the full screen and stand alone, you know the application will look and feel like a stand alone application This can include that applications having different window its own icon on its application launch et cetera.
And the fallback for each of this display mode, from fullscreen would be standalone ,from standalone it will be minimal-ui, for minimal-ui it will be browser, and from that, of course there is no fallback.
So most used display value for Service Workers pages was standard and then it was minimal-ui and then full screen, some of them didn't have it set and some of them had set it to browser.
So standalone took the lead which definitely makes sense because you want your Progressive Web Application to feel and behave like a native of a standalone application.
Right?
And full screens are more like the gaming PWAs.
PWA manifest categories where one of the other important insights that we were trying to derive and out of the top categories shopping stood at the top and 13.16% on mobile traffic, which is not unexpected for PWAs, because most of them are e-commerce applications, and news was the next big thing with 5.26% on mobile traffic, and then we had entertainment, utilities, business, games, lifestyle and social and finance and web and recruitment and music and education.
And the other important property which we are seeing here is for small percentage where it was separate through, there is a signal that there are many web applications that is just that just have a manifest which is not really a PWA.
These are the manifests which are preferring native application, so if you see what is the preference on each maybe mobile and desktop.
So 98% were set to false which is a very good sign, and on mobile 98.52% what was set to false.
And then we have the icon size, for icon size 192 x 192 is the standard of the winning icon size we saw and out of that there's like the varied number of icon sizes.
The manifest kind of talks about the icon size and that's the icon size that sits on the home screen based on your OS and need and 192 x 192 was the leading dimension, and then we had the end 16 x 16 . The top manifest for orientation for self portrait mode was on 14.47% and any was set to 6.4% of them were said to any, primary portrait-primary and natural and landscape followed.
These were a manifest for orientation and the importscript matter off the worker global space AI interface the API that kind of helps within Service Worker to import scripts and apart from import script the default API that spec provides we had Workbox which was used a lot and then followed by SWPA toolkit, and Firebase, Onesignal and other libraries and 58.81% had no libraries and in importscripts was like the APA that was used in terms of 29.6 0% of desktop usage and 23.7 6% for mobile usage But it definitely made sense the native API which helped us to import tasks.
And it wasn't a surprise that Workbox kind of took the second spot given all the capabilities that the library provides.
Workbox is the open source library which makes life easier to deal with Service Workers by Google and we kind of because it was the most used library apart from the postscript native API we kind of look into the data for the most used Workbox packages and what was the different things within Workbox that was used.
It was mostly on strategies, routin,g and precaching it was like commonly used across whichever Application was using the Workbox library.
Workbox was most heavily used in our option array in terms of 12.86% and 15.29% of PWA sites on mobile index stop respectively.
And that was all we had in terms of gaining the insights and the state of PWA based on the HTTP archive data, BigQuerys and all that raw data kind of churned into analytic analytics and the graphs and insights that gave us a view on what is the state of PWA.
I hope you enjoyed the talk and please go and read the latest chapter that's cooking as we speak and shall be released soon Thank you.
In 2020 PWAs turned 5. So in that milestone year, what’s the reality of PWA developer adoption? Hemanth HM, author of the chapter on PWAs in the most recent Web Almanac, a comprehensive report on the state of the web, backed by real data from HTTP archive, and trusted web experts, dives into real world adoption of the technologies underpinning PWAs, to see just how in reality PWAs are being deployed.