The State of front end performance
Introduction
Ben Schwarz kicks off his talk by reminiscing about his past appearances at Web Directions and acknowledging John Allsopp's contributions to the Australian web scene.
The State of Web Performance in 2024
Ben dives into the current state of web performance, highlighting the prevalence of slow, bloated, and inaccessible websites despite claims of "blazing fast" speeds by various frameworks. He presents data from Core Web Vitals, indicating that many popular frameworks fail to deliver on their performance promises.
The Rise and Challenges of Single Page Apps
Ben discusses the prevalence of Single Page Apps (SPAs) and the challenges they present in terms of performance. He notes that while browser capabilities have improved, SPAs still struggle to consistently deliver optimal performance, particularly in achieving Core Web Vitals benchmarks.
The Impact of JavaScript on Page Size
Ben investigates the growing issue of JavaScript bloat and its significant impact on page load times. He explains that the increasing reliance on JavaScript, while offering functionality, comes at the cost of slower page speeds due to the resource-intensive nature of parsing, compiling, and executing JavaScript code.
Core Web Vitals: Measuring What Matters
Ben provides an overview of Google's Core Web Vitals, emphasizing their importance as the industry standard for measuring web performance. He explains the three key metrics: Largest Contentful Paint (LCP), Interaction to Next Paint (INP), and Cumulative Layout Shift (CLS), outlining their significance in delivering a positive user experience.
Understanding the Chrome User Experience Report (CrUX)
Ben introduces the Chrome User Experience Report (CrUX) as a valuable resource for understanding real-world website performance data. He explains how Google collects this data from Chrome users and makes it publicly available, allowing developers to gain insights into how their websites perform for actual users.
Core Web Vitals in Action: Analyzing Australian Retailers
Ben presents data on Core Web Vitals performance among Australia's top retailers, highlighting the significant gap between industry leaders and those struggling to meet performance standards. He emphasizes the importance of optimizing for mobile devices, particularly given the high iPhone usage in Australia.
Deep Dive: Largest Contentful Paint (LCP)
Ben examines the specifics of Largest Contentful Paint (LCP), outlining the factors that influence this metric and providing practical tips for optimization. He explains how Time to First Byte (TTFB), resource loading, and rendering processes all contribute to LCP, offering actionable strategies to improve each stage.
Optimizing for User Experience: Minimizing Cumulative Layout Shift (CLS)
Ben shifts focus to Cumulative Layout Shift (CLS), explaining how unexpected layout shifts can lead to frustrating user experiences. He demonstrates how to identify and diagnose CLS issues using Chrome DevTools and outlines practical solutions to minimize layout shifts, ensuring a smoother and more enjoyable user journey.
Enhancing Responsiveness: Interaction to Next Paint (INP)
Ben introduces Interaction to Next Paint (INP) as a crucial metric for measuring website responsiveness. He explains how INP captures delays in user interactions caused by background tasks, highlighting the importance of optimizing JavaScript execution to deliver a seamless and responsive experience.
Tools and Techniques: Measuring and Improving Web Vitals
Ben showcases practical tools and techniques for measuring and improving Core Web Vitals, including the Web Vitals library for identifying performance bottlenecks and strategies for optimizing DOM size and JavaScript execution to enhance INP scores. He emphasizes a data-driven approach to identify and prioritize performance improvements.
Introducing cwv.report and cwvtech.report
Ben introduces two free tools: cwv.report for quickly checking Core Web Vitals scores for individual pages or entire websites, and cwvtech.report for comparing the performance of different frameworks and platforms based on real-world data. These tools empower developers to make informed decisions about technology choices and identify areas for improvement.
The Future of Web Performance: Speculation Rules and View Transitions
Ben explores emerging technologies like speculation rules and view transitions, highlighting their potential to revolutionize web performance. He explains how speculation rules allow browsers to pre-render pages in the background, delivering near-instant loading experiences, while view transitions enable smooth and visually appealing transitions between pages, blurring the lines between SPAs and traditional multi-page applications.
Performance as a Spectrum: Understanding the User Context
Ben emphasizes the importance of considering the wide range of devices and network conditions users experience. He advocates for testing across a spectrum of performance capabilities to ensure a consistently positive experience for all users, regardless of their device or connection quality.
Prioritizing Performance Improvements: The Performance Workbook
Ben introduces the concept of a performance workbook as a practical framework for prioritizing performance optimization efforts. He explains how this simple spreadsheet can help teams estimate the potential impact, difficulty, and cost of various improvements, enabling data-driven decisions about where to focus development resources.
Integrating Performance into the Development Workflow
Ben stresses the importance of embedding performance considerations throughout the entire development process. He highlights the benefits of using browser dev tools for performance testing, integrating performance budgets and alerts into CI/CD pipelines, and leveraging automation to ensure consistent optimization. He concludes by emphasizing the need to make performance data visible and accessible to the entire team, fostering a culture of performance-driven development.
Key Takeaways: Actionable Steps for Improved Web Performance
Ben summarizes the key takeaways of his talk, providing actionable steps for improving web performance. He encourages developers to become performance advocates, track Core Web Vitals, set performance budgets, test in real-world conditions, regularly review progress, and integrate performance considerations into every stage of the development lifecycle.
Alright, yeah, hey, thanks for the introduction, John.
This is actually my third time speaking at Web Directions, I think.
Last time was almost a decade ago, which is a long way of saying I'm old, but John's older.
And, look, it's, always a privilege to come along to an event like this and, I think John, I don't know how long he's been running Web Directions now, but probably 20 years?
20 years?
Let's all just give John a big hand for that.
I don't think the Australian, web scene would be quite as far developed, if John hadn't been there.
As a, somebody putting a lot of effort and a lot of, training and bringing out people and all of those things that he's done.
Big thanks to John.
Today, we're gonna be, we're gonna be talking about web performance.
It's usually, a hot topic.
And it's been something that we've been talking about more and more over the last few years.
And in 2024, where are we at?
We're still seeing slower, more bloated, websites that still aren't accessible.
They often trade customer data with hundreds or even thousands of third parties in some cases.
We failed to deliver the promised web.
Or if we did, it still sucks.
Many of the choices that we make as teams or individuals have a huge influence on end user experience and how websites perform.
From technology choices, website architecture, which third parties we engage, the list goes on.
As web performance metrics evolve, it's important to keep track of the current gold standard of measurement techniques as well as mediation strategies.
So today we're going to have a look at the current landscape and some of the things that you can use today, as well as a couple of little tools here and there.
At the moment, web performance is the hot feature on pretty much every marketing page.
I had a look at the marketing pages of all of these frameworks, but there are many more.
And they'll say that they're blazing fast.
They'll say that they're built with performance in mind.
I had a look at that.
If we go to go ahead and use core web vitals as a marker of how performant these frameworks are.
You'll see next JS up there with, only 23% of sites that are deployed and found in the dataset, actually pass core web vitals and the, the results aren't so great for many others.
Today, development teams are still building single page apps.
Who's doing it?
Kinda everyone.
Keep your hand up if you're passing Core Web Vitals.
There's two people!
Wow, cool.
Yeah, and I, I think it's it's an, I, I build a single page app as well, so there's no, there's no blame game to be played here, but it's an interesting position that we find ourselves in where browsers, a few years ago, maybe when we started to build those apps, didn't do the things that we wanted for applications, right?
They didn't feel like they could do all of the things that we wanted to achieve, long session times for users, and UIs that, that kind of moved it around, and I, I think it is potentially interesting and I had a whole part of my talk, that got a little bit heavy on React, but after drinks last night and talking to people I felt like they had enough of React bashing, so I actually hid those slides.
But with React I think it is pretty interesting because we've got basically one single vendor that controls React now.
And we've been talking about server side rendering for five years.
Still difficult to do, can still only do it in one web framework.
And that web framework is largely building SPA for most people.
Moving on.
In the last four years, page byte sizes have increased by 33%, from just under 2 megabytes to about 2.6.
But, JavaScript is always the answer to a JavaScript developer.
What you'll find if you look at JavaScript over the same period of time is that it's outweighing all other asset types.
It's growing at a rate exponentially faster than anything else.
And that may be because it also includes CSS in JS, sometimes it includes SVGs, other assets that are bundled in, that we don't necessarily expect to be there, but they are.
And the problem here is that JavaScript is byte for byte, pound for pound, slower than any other asset type.
So it's slower because the machine has to download it, has to parse it, has to compile it, and then it has to execute it.
So it has a longer tail in the browser in terms of performance.
Since Core Web Vitals, we're released in 2020, we've actually seen a bit of, improvement.
In 2020, only 37 percent of sites on desktop passed Core Web Vitals.
And today, or May, for the month of May, we're up to 53%.
And mobile has also jumped, rather considerably.
These are pretty good signals that things that we're doing are working, and things are actually getting better across the whole.
Google's Core Web Vitals definition is probably the most popular bar of measurement for any kind of performance.
There are other performance metrics and methods out there, but they continue to be the most popular.
Core Web Vitals, everyone know what they are?
Yeah?
Okay.
Around 70 percent I think.
And yeah, Core Web Vitals are three metrics that are designed to encapsulate several important user experience details from how quickly a page renders, how quickly it responds to user interactions, whether or not the layout shifts at any time.
Using these metrics and a healthy, input of new and emerging best practices, we can quickly make tangible improvements.
And in this talk, I'll actually show you some.
But, Core Web Vitals aren't finished.
It's not a definition that is set in stone, and it's going to remain that way.
Just recently, we've seen the deprecation of a metric called First Input Delay, which, frankly, never really was a very good measure of much going on, and we've got a new metric called Interaction to Next Paint.
I'll show you how that works later on.
Let's recap.
Google collects Core Web Vitals, From real browser sessions from real Chrome browser sessions.
They surface that information for everyone to be able to get it In the Chrome User Experience Report, also known as CrUX, so it's available for free using a JSON API.
You can also use BigQuery, but that's harder, so probably just stick to the JSON API unless you want lots of data, or very specific data.
Websites will only appear in Crux if they have, if they meet certain criteria, so that means things like, you can't have a no index header on it for SEO, so if you've got a no index header, it won't be included in crux.
Pages must be public also, and they also need to be sufficiently popular.
And this is actually a point of contention, because Google don't actually say what sufficiently popular means.
In my experience, it's been a few thousand hits a month.
The way that I've been able to demonstrate this is deployed a new blog post.
Watch the amount of traffic that it gets.
Two, three, four thousand hits over a period of a day, and it'll be there the next day.
You can actually, get an idea of it based on your traffic, but it does vary.
It also, requires that the browser is in certain conditions, so signed into the browser, I think, is one of the factors that is important too.
The Chrome User Experience Report dataset is also used by Google Search, and it's used as a page ranking factor.
It's not a huge factor, it's one of actually many factors that are taken into account.
Things like the security, things like how big buttons are, whether they're clickable for people, whether they're usable.
But yeah, that data is actually used.
Really importantly, it does not include iPhone.
That's actually really important in Australia, because in Australia we have more iPhone than pretty much anywhere else in terms of deployment.
At the moment, according to StatCounter, about 55 percent of traffic in Australia is iPhone, and 43 percent is Android.
I went ahead and looked at Australia's top retailers, and ranked them by Core Web Vitals, and whether they passed or not.
You might not be able to read, basically, everyone fails in this list, except for Harvey Norman, actually big surprise, Amazon, and Aldi.
Sorry if anyone's from Harvey Norman, Jerry Harvey.
As I said, Core Web Vitals, have evolved over time, but generally, what you need to know is that there are three metrics.
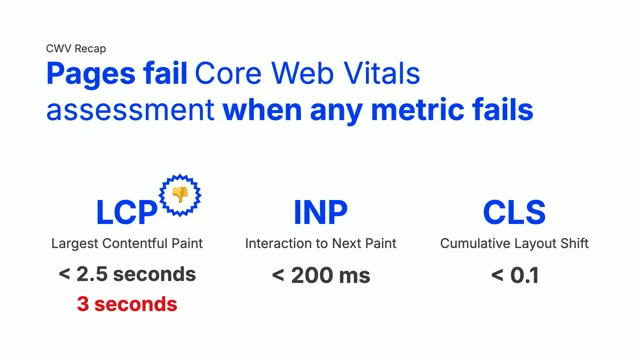
There is LCP, Largest Consentful Paint, which is about the display of content, there's INP, which is about the responsiveness to user input, and there's CLS, which is about visual stability during the page session.
Basically, you need to stay within a threshold, so Google published thresholds of what is good, needs improvement, or out and out bad, and yeah, here's what they are.
For Largest Contentful Paint, it's less than two and a half seconds, for INP it's less than 200 milliseconds, it's like the largest task in the page, and for CLS, It's a fraction of how much movement appeared in the page based on the size of the object that moved.
In the case of this example, if you had, yeah, three seconds for your LCP, then it would fail.
And it means that you've completely failed the assessment.
If one metric fails.
There is a small detail there.
If you INP, Interaction to Next Paint, requires interactions in the page.
Not all pages actually have interactions, right?
If you just have a blog post that has no clickable buttons or anything like that, there may not be any INP actually collected for that page.
If your page doesn't collect any, it won't fail, it's just a null, effectively.
The Chrome User Experience Report includes other metrics as well.
So you've got the first three that I've mentioned.
There's also time to first byte.
Which we'll have a look at in a moment.
First Contentful Paint, and First Input Delay, which is now deprecated.
So let's look at first, time to first byte.
You go ahead in your browser, you enter example dot com, you hit enter.
That's when the browser request starts.
Then, the browser checks to see if there's any service workers that are involved.
If service workers are there, it may shorten the load or prevent a load from actually occurring at all.
Same thing for cache.
After that, we move on to the network waterfall that you may be familiar with.
DNS lookups, SSL negotiation, any redirects that occur, which is particularly important if you're, maybe have a landing page from Google.
And, it has redirects to capture clicks or whatever, those things are factored into, into TimeToFirstByte, in its collection in Crux.
TimeToFirstByte is the moment when the first byte of the response is, arrives from the browser request.
This is really important to know when you're trying to optimize Largest Contentful Paint.
Largest Contentful Paint is when the largest text, image, video, renders.
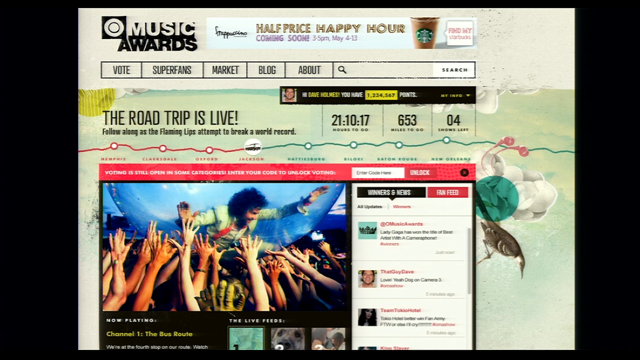
In the case of the page above, we can see the green, dotted line.
And on the first frame, we can see that the first visual, stories text is maybe, not maybe, definitely is.
The browser will say, this is a candidate for Largest Contentful Paint.
As the load progresses, it will find a new candidate.
So the who qualified for September debates so far would be the next candidate.
So they get invalidated as they go.
So it's an interesting API.
And then finally, the image that appears is designated as the LCP element on this page.
For that to happen, we need a couple of things first.
Firstly, we need time to first byte.
If you have a slow time to first byte, you will delay when content renders.
Because there's no HTML.
So we need time to first byte to have happened.
Then, the browser needs to go and discover an LCP resource, so it will look at text nodes, and during that process it might have to download a font, if it's an image it'll have to download the image, if it's a video it may have to download a poster image, depending on if it autoplays, there are a few factors in play.
Then you've got to wait for the resource itself to load, so if there is a web font, you'll have a delay for that, but if there is an image- so on and so forth.
And then finally, the render.
Those make up, wow, that effect was really a lot better than, The, yeah, those make up Largest Contentable Paint.
A quick mini guide to how you can optimize your LCP.
If you're using Chrome DevTools, you can open it and the top arrow, you can press this to reload the page and record a trace of the browser.
Then in the timings timeline, there's a little LCP badge.
If you click that, the bottom panel will provide a summary.
And in the related node area, sorry it's a little small.
In the related node area, you can click that and then you can view that element in the DOM.
Or you can hover over it.
And so in the screenshot I've hovered over it and it's this hero image is the designated LCP.
Depending on what you're doing, What type of content your LCP element is, like first you have to identify which element is for LCP, so image or text or video, first thing you want to do is try and make it load as early as possible, so to do this you could use a fetch priority tag, where you can tell the browser, I need this as soon as possible.
Please provide it for me.
And what that will do is it will, let's say that image was maybe further down in your DOM, or further down in the HTML document, it will know that it's important, and it will put it to the top of the list, so it will occur earlier.
So that's one way that we can tell the browser, you don't know this, but you're gonna need it.
You can also do things like turn on the best compressions.
Anyone heard of ZStandard?
A couple people, yeah.
ZStandard comes out of, ooh, I misspelt it, sorry.
So ZStandard comes out of, Facebook or Meta.
It's a really, good compression algorithm.
Compressor's a bit better than Brotli.
So the way that compression algorithms work in browsers is you can have your web server support Brotli and ZStandard and GZip and it'll use the one in the order of specification in the HTTP header.
So you may as well turn it on.
It comes for free.
It's a better compression.
You get smaller assets.
Smaller assets deliver faster.
They deliver better over spotty networks.
You can also do things like use new image formats like AVIF.
Instead of using JPEG, or you can use WebP.
WebP is supported in pretty much every browser now, it's very, well supported.
It's taken me a long time to use it, but there are actually some benefits there in terms of file size.
And then the last thing that you can do is, you can use a CDN.
The concept of a CDN is that you put content that's close to your users geographically so that it has less network to cover.
Less distance to cover, less latency.
So that can really improve the load speed of things.
That's how you improve Largest Contentful Page.
Now, who here has, Who's been there?
I have been there.
Not in this situation exactly, but it's definitely happened where you click and then you're transported to a new page or something happens.
It's really disorientating.
Cumulative Layout Shift is a metric that's designed to find these kinds of really frustrating user experiences, maybe where text is jumping around the page or buttons are jumping around the page, and they're difficult to interact with.
Here's how you fix it.
One thing I'd like to mention though, on the video here, I slowed it down 800 percent because this feature in Chrome, you can turn it on, it's called Layout Shift Regions, and it'll highlight areas of the page that are repainting for cumulative layout shift.
If you have any epilepsy, it may cause issues, so just be careful with it.
It actually has a warning on it.
But what it'll do is it'll allow you to see which areas of your page are moving around and you'll see those shifts.
So you can keep hitting reload in … a lot of cases I actually record a QuickTime video so that I can actually intentionally slow it down so that I can see the elements and scrub over them.
It's a good little trick that you can use.
So firstly, you want to visualize them so you know which elements are shifting.
Secondly, you want to use, Lighthouse or, PageSpeed or Calibre, the tool that I work on.
You can actually, have an audit that, It tells you to avoid large layout shifts, and in this case, it lists the elements and the text that are shifting, and then tells you how much they're shifting.
So you can find the biggest offenders and address them first.
You can use font display optional, which tells the browser, this web font, is optional.
So if it can't load within a couple hundred milliseconds, it'll just abort it.
So you won't have shifts based on that.
There are other options for the font display, property, like swap.
Using optional is the only way that you can actually definitely, ensure that it won't shift.
It's the won't shift version.
Yeah.
You can also preload your fonts.
So in the same way that you can preload an image, you can preload a font, tell the browser you're going to need this.
So this is something you can put in the head of your document.
Downloads the fonts.
The way the browser finds its fonts is it waits for the text to be there, then it downloads the CSS, and then it finds the selector to match that, oh, this is using a web font.
So that process can actually be delayed before the browser will actually fetch the web font.
So you can use this to just trick it to say, let's do it right now.
And then finally, you can specify dimensions for your images for ads so that content doesn't shift as late loading content appears.
Interaction to Next Paint.
Really fascinating.
Interaction to Next Paint effectively finds positions in your page where an interaction is delayed by JavaScript main thread.
This might be, you've clicked on a button and, you need to do some processing in the background, maybe you need to send a HTTP request, something like that, and then the UI will update.
So it might be like posting a comment, or it might be responding to something.
This is a great tool built by, Philip Walton from the Chrome team.
It allows you, I've cropped it out, you can't see it, but, it allows you to specify different timeouts and different, parameters to see how INP would score and get some empathy for users to see, when they type, how delayed it can possibly be.
And so I was typing at completely normal speed here.
So Interaction to Next Paint is during an interaction for a user, so it might be on a keyboard, it might be on a mouse, or it might be with your finger, where there's a background blocking task that prevents paint from occurring.
So if you have this render and paint cycle that's going to happen so the user can see something, if that's being delayed, that'll be scored by interaction to next paint.
And in terms of the Core Web Vitals or CrUX data, it will take the largest interaction on a page, so maybe you've got a search box, and that's really quick, and that works really well, but then you have an add to cart button, and the add to cart button's the actual slow part, that's the thing that will be scored in metrics.
It won't give you the smallest interactions, it'll give you the biggest interactions on the page.
So if you want to fix INP, there's a couple of things you can do.
Firstly, there's a library called Web Vitals that Google puts out, completely free, it's on GitHub, you can read all the code there.
It's It has an attribution mode, so we've included the attribution build here, and from that you get this thing called a LOAF.
It's on line 5 or 6 or 7.
So LOAF scripts.
And that will give you the script that it occurred on, the selector of the object that you clicked on.
So this is something that you can put into your analytics.
Give you the actual character, position in the script, give you the file name, everything.
So that's a really good way to track it down in analytics and see what your users are doing in the wild.
Another thing that you can do is reduce DOM size.
This is a really interesting one.
So if you have, for example, an SVG in your document, SVGs can be very complex and create a really deep nested DOM.
And have lots of tags there as well.
By limiting the size of the document you're giving the browser a better chance of being able to respond to user input quickly.
So instead of using, an SVG inline, I know they're really great to style, but when you can, use an image tag.
If you're using NextJS, there is a, or if you're using React, in fact, which a lot of you are, I imagine, there is a startTransition function that you can include, and you can wrap a change or an interaction with startTransition, and what it will do is it will delay the code so that it goes into the next event loop.
And then you can update your UI, so it just effectively gives the browser a little hint to say, okay, you can move on, we're painting soon.
So that's a really easy way to, implement an INP fix.
If you want to check what your vitals are, I built a free tool, it works in about one second, so go ahead and try it out if you want to.
It'll give you all six metrics, It'll tell you if you pass Core Web Vitals.
You can run it on a domain, so the whole site, it's called an origin, or you can do it on one single page.
You can also filter down by device, so mobile or tablet or desktop, so you can really get an understanding of which pages are problemmatic and if they are problemmatic on desktop as well as mobile.
This is based on the last 28 days of data, so that's the window period that Google looks at.
You can also make framework decisions using cwvtech dot report.
And this is how I got the statistics for how well React or NextJS is doing.
This can be helpful if you're trying to make decisions, looking at libraries, comparing things.
You can also compare platforms, so in this example I've compared Shopify with Wix and Squarespace.
So if you're using a CMS and you're trying to make a decision based on maybe a vendor that you're evaluating, this is a good way to at least get an idea of how sites in the wild are performing.
Something that I'm really excited about is speculation rules.
Has anyone seen this?
This is brand new.
Experimental technology.
Speculation rules is only available in Chrome at the moment, and maybe only the latest version, release, I'm not sure, and what it allows you to do is specify a If you would like the browser to speculatively pre render a page completely in the background, or pre fetch a page.
Pre rendering is going a little bit further, pre, pre rendering is going a little bit further, and pre fetching is just get it, but don't actually render it in the background.
And so what will actually happen is, you can specify, href matches.
So if the, page URL matches this, you can also use.
CSS selectors, or other ways of targeting elements in your DOM.
So if there's a link, you could actually say, like a logout link, you can say, I don't want you to preload that, because we don't want to log users out, so you have good control over the situation here.
And, yeah, as a user navigates, it'll just switch out the page immediately.
It's already there, it's already rendered in the background.
So this, I think this is particularly interesting because, we're building SPAs because we want user inter we want one load, and then we want it to render immediately, right?
On a multi page application, you can do exactly that using speculation rules.
Pretty exciting.
Definitely encourage you to give it a go.
Alongside that, view transitions.
Not currently supported in Firefox, but it's coming, and there are actually part, it's partially supported in Safari, but not all the way with multi page.
A view transition allows you to use some CSS properties and tell the browser how you want one page to transition to the next.
I could keep telling you about this, or I could show you this great demo.
This is a Spotify clone, built by the Astro team.
And what's happening here is we're actually navigating between completely static pages.
This isn't a, this isn't a SPA.
If you check the address bar, is updating every time.
It's not using push state.
Really exciting.
So with those two, two things coupled together, with speculation rules and with view transitions, I think we were actually able to have applications that feel pretty native and feel really fast and instant and have great user experience without all those trade offs that we're seeing in SPAs at the moment.
Those things like having routers and watching the URL change and using a pop state and doing all those extra things that we're doing.
We can maybe just opt back into browser.
Performance is a spectrum.
I would guarantee that somebody has iPhone 10 or above in their pocket, or the equivalent Android, pretty much everyone in this room.
Very few people are going to have the LG Nexus 5, right?
But some of you users do.
And some of you users have it, a fast phone, and then they're on the train, and then they're in a tunnel, or they're on the bus, or they're in a cinema, or a stadium And the experience isn't going to be the same for everyone at every time.
It's not going to be the same as you on your fast developer machine that costs a few thousand dollars, on your phone that costs a few thousand dollars.
To really understand how users are feeling, you need to test the full spectrum.
You need to test the slowest version of what your site can perform at, and if you can optimise that and make that fast, it'll be fast for everybody.
So it's a really good way to, put yourself in the shoes of your users and actually do that.
The thing that I like to do when I'm evaluating where to make performance increases, performance is really, fun.
I find it really, addictive, in a way.
But it's really easy to do things that don't push the needle.
Or to do things that are difficult to actually land.
Maybe it's interesting to, get a little demo and say, Oh, I think it's faster.
But it's hard to get it to production.
As a team, how do you evaluate what you should do?
I'd like to introduce you to the idea of a performance workbook.
Effectively, it's just a spreadsheet.
In the spreadsheet, you could have an estimated gain, the achieved gain, so after you've done it, you can guess and then see how much performance you gained, whether you did or not, and use this as a way of reminding yourself how effective these things could be.
Also noting down the difficulty and the estimated cost, because we can't just go on a, we can't disappear for three weeks on a performance fix that gives us half a second of rendering time.
That's probably not enough, right?
So let's look at some stuff that we could do.
We could preload fonts.
We reckon, probably, you can probably speed up font rendering by 3 to 5 seconds.
And maybe you can improve your first Contentful Paint.
It's pretty easy to do.
Doesn't really cost anything.
To me, this is golden, you should do, absolutely do this.
This is a performance improvement that is a no brainer.
Same for font display.
There's no negative here.
It's easy, you get instant text rendering.
Doesn't cost much.
You should do it.
But then, things start getting harder.
It's probably pretty easy to do, but as a company, these things take time, and you have to have conversations.
Big favorite of a lot of people here.
Maybe it doesn't matter if you're not paying the salaries or the bills, but, you have to look at what the benefit may be for your users and for your team, and in terms of maintenance and in terms of everything that follows this work.
Could remove your ads.
And this is a point of contention.
Maybe you could remove a third party.
But maybe, yeah, maybe that's all of your revenue and that's how your business does, actually makes money.
So there might be ways you can work around these things.
Maybe you can reduce the amount of ads or maybe you can lazy load them or you can make, take them out of the critical request chain so that they're not such a big impact on users.
But writing these things down and keeping a list of how effective you thought it would be, and then seeing how effective it actually was is a really good exercise to go through.
And then finally, my favorite, delete all the JavaScript.
Very easy to do.
Gives you a lot of performance straight out of the bag.
I mentioned in the beginning of my talk that performance isn't something that you can just bolt on after the fact.
It's got to be something that you do from beginning to end to really, truly be effective.
And it means that teams got to understand their user base, they've got to set targets together, they've got to monitor them, they've got to get regular signals throughout the whole process.
In development, you can use your browser's dev tools to throttle CPU and network speeds, and just to see how your pages perform in those scenarios.
It's really quick and really easy to do.
You can also put performance into your CI CD suite.
So this is a feature of Calibre that I work on, where we will watch for deployments of your PRs, and as they occur, we'll go and test the performance of that PR and we'll compare it to production.
So you get a report on your PR, it's visible to everyone in your team, and you can see, Largest Contentful Paint is actually 14 percent slower on this, on this PR that I made.
You can also block merge.
Which is really interesting.
So you can actually enforce a performance budget.
Or you can say, if our JavaScript goes over 500k, just block that PR.
You might have to change your budgets, or you might have to make some negotiations, but it might catch out some of those large bundle size increases that we don't, anticipate on doing, but they happen.
You can also do things like automatically compress your images, Or other, automations to make sure that people are getting a really optimized version of your site.
But most importantly, I think, it's about making performance visible to everyone on your team.
So that's putting it into the tools that they're using.
It's putting it into a Slack channel, it's putting it into GitHub, or anywhere else that you might be working.
So we covered a few things.
Here's my takeaways.
You will be a better performance advocate at your company.
If you get to know common performance issues.
You should track Core Web Vitals.
They're the gold standard.
It's what everyone uses.
And they're actually a pretty good estimation of a user experience.
You can use metric budgets and alerts.
So you can set budgets for different types of metrics, like the size of JavaScript or how many third parties there are on a page, and make sure that you don't go over those thresholds.
You can test using real world customer situations, so go and get a cheap Android phone.
You can buy one as cheap as $150 and it'll probably be, one of the worst, performing in terms of CPU performance.
One of the worst performing devices you can get.
You can get them at the post office and, you can put yourself in the seat of your users.
Back in the day, Facebook used to have a slow, slow 3G Tuesday, I think it was, where they would basically have everyone on their development team having slowed network to really fully appreciate how slow the site would be if they had that network condition, which is interesting.
Should review your progress weekly, or monthly, or both.
Just have a regular interval where you catch up on these things and audit where are you at.
And with performance fixes, form a hypothesis, and then test it, and then prove it, and then fix it.
Make all your work environment's the same.
What I mean by this is use a tool that publishes your PRs and make sure that it's similar, to production, so that you have like for like production and performance, because a lot of the time you can deploy something and it seems okay in dev mode, but in production, when there's larger queries or larger datasets, maybe it doesn't perform quite as well.
So try to actually test your work in like for like conditions so that it doesn't get to production and then you discover the performance issues.
And yeah, just monitor everything that you can all the way through.
Thanks very much.
Since the arrival of Core Web Vitals, understanding and optimizing front end performance has never been more critical.
So Ben Schwartz whose life revolves around performance will shed light on the current state of front end performance, focusing on central metrics and the latest developments in performance measurement and enhancement, particularly Core Web Vitals (CWV) with an emphasis on Interaction to Next Paint (INP) as the latest metric to watch.
Drawing on extensive data, Ben will identify common pitfalls in performance optimization efforts and provide actionable insights for teams to track, avoid, or rectify these issues, ensuring a seamless user experience.

