Getting up to speed with Web Performance in 2019
(upbeat music) - So I mean, just to get this out of the way first, it's gonna be really clear you're in the engineering room just from the quality of my slides.
There's no confusion with the design track. Yeah, and so hopefully it won't be too boring but we're gonna spend the next 45 minutes or so talking about metrics.
And hopefully, it'll be not just the raw details of the metrics, but sort of the backstory, which metrics work, which ones don't, why they don't work, why we still don't have? And this will be a spoiler alert, there is no one number that tells you how fast your user experience is. There is no one number that Google can use to say, rank fast sites for example.
And depending if you're black hat or white hat, you'll also get out of it how to game each one of the metrics to make it look faster in case your comp happens to be tied to making one of those metrics look faster. So, back sort of way back in the day, this is before Steve Souders' book back in 2007, give or take, web performance was largely looked at from Ops as the server response time, how quickly can my server shove pages out to the internet or requests out to the internet? Largely didn't even sort of care about the whole concept of a page.
It was, this is my server, what's the requests per second that it can spit out? And it's actually still fairly popular to be looked at by the Ops teams.
That's pretty much all they care about, because that's the part of the world that they run. The servers, we need to be able to handle the load. We care about churning out requests per second. Users don't care.
Users care about how quickly my request comes back, not how quickly, how much you can scale the back end. And so, interesting problem with this is, and it's becoming more of a problem these days. Nginx, for example, as a web server is designed to churn through requests per second as quickly as possible, basically to, for the benchmarks, to rank really high in the benchmarks.
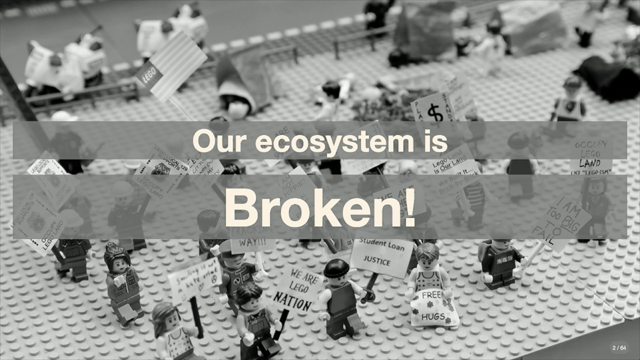
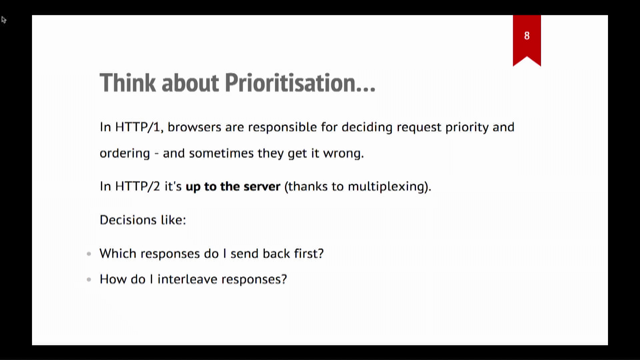
To do that, they basically can't prioritise HTTP/2 correctly.
And so, Nginx HTTP/2 prioritisation today is completely broken, because of shoving data through. And so, this is one of those cases where, depending on what you're optimising for, you're kinda gonna shoot yourself in the foot in other cases.
And spoiler alert, the next talk, you're gonna be hearing all about HTTP/2 and why it's broken.
So I'm not gonna have to go too much into that. Steve Souders back in 2007, he's sort of the godfather of front end web performance these days.
He was at Yahoo at the time, created YSlow, but sort of one of their big revelations was you know that server response time that we're talking about and then the Ops team is sort of myopically focused on is only 10% of the actual user experience.
90% of the time is spent loading all of the stuff that the HTML references.
It's a little scary, but 12 years later, that number has roughly held.
We go back every year to look at the HTTP Archive, it scans, currently, it's 2 1/2 or 4 1/2 million pages on the web. And it's still the case that only 10% of the time to load the content is spent loading the base HTML. And so, that was sort of the beginning of the shift into looking at the front end of the performance, the browser's view of the performance and how long it takes to load.
And so that's when we came into whoo, the age of the front end.
Time to First Byte is still important.
This is the time when the server responds with the HTTP headers, and maybe some of the HTML of the content.
And this was one of sort of Steve's critical optimizations was, if your HTML or your server takes 10 seconds to do all of the search and the backend queries and whatever else it needs, give the browser a head start. You know the static JS that all of your pages are gonna use, you know what the tidal is going to be.
So send that HTML first, give the browser a head start on fetching the JS and other things while you're still finishing the backend.
For Google, this is the backend for the search results. And if you look at a Google waterfall, it'll look very much like this.
There's a chunk of data at the beginning of the HTML response, and that's the static stuff that doesn't change, and then the actual search results, the backend calculations and everything else come in the second chunk.
But in the meantime, the browser can start downloading the CSS, the external scripts, your third parties and everything else that don't change.
And so, this was the early flush of the content where send the static stuff out quickly, get your First Byte Time back to the browser as quickly as possible and then worry about getting the rest out.
If you have a slow Time to First Byte it is guaranteed your web performance will be slow. The browser can't do anything until it has HTML to work off of.
And that's sort of, a fast Time to First Byte won't guarantee a fast experience, but a slow one will absolutely guarantee a slow experience. And so, it's still one of the core critical metrics that we look at.
And in the whole Google search will optimise based on your web performance, one of the definite correlations you can easily see, I don't know if the new Search Console does it, the old Search Console definitely had it.
In the First Byte time, as the crawler crawls your pages, the faster your pages respond, the more content it can crawl.
And so, you'll see the number of pages crawled per day is higher when you have fast response times just for the HTML.
That's sort of the genesis of performance impacts your rankings and your SEO and search and all of that kinda stuff.
It's based on the HTML and the First Byte.
Page Load Time, this was an easy one for browsers. This is the onload event.
If you're in JavaScript land or in DOM land, it's when the HTML has been parsed by the parser, all of the JavaScript has been run, all of the scripts, CSS, images, everything that's statically defined in the page has been loaded, and completely finished.
Before single page apps became a thing, this was largely when the content was complete. It's a good endpoint, it's still used fairly, fairly often, it's still referenced as when people say the Page Load Time took X, they're usually still referencing the onload event. It's just the usefulness of the metric has somewhat declined since it was originally created.
Single page apps, Gmail, for example, the we're loading your mail spinner, or now the M for the mailbox animation, that's the onload event.
Then it's running all of the JavaScript and everything else and actually loading your Gmail.
So the page load event, depending on what your content is, may or may not mean anything, it may be way faster than the actual user experience. And there are cases, retargeting pixels, ad trackers, that kinda stuff.
All of those if they're at the end of your HTML, for example, the browser is gonna have to fire all of those, even though the user is seeing your content interacting with your content, all of the invisible stuff is still firing in the background.
In that case, the Page Load Time is way slower than the user experience.
When Google announced that speed was going to impact your ranking, that was the sort of golden age of gaming metrics and my favourite one was an accelerator CDN to remain unnamed for now.
They would return an empty page and use JavaScript to inject the HTML after the onload to load the actual page the user was visiting, because the Page Load Time would be almost instantaneous. And so, they can say, "Hey, we gave you an instant Page Load Time, "and then we actually loaded your page." It's just that the page being loaded wasn't being captured in the metric.
And so, that's one of those cases where they gamed the metric, sucked for user experience because injecting the HTML after it was parsed and loaded removed the ability from the browser to incrementally parse the page, but they could game the metric against their competition, and we can say we can give you the fastest Page Load Time. And they, and since Google never sort of really announced what they cared about performance they could also say, "Hey, and it's also gonna help your ranking." DOM Content Loaded, this is the point when the browser, the parser for the browser, that's what goes through the HTML, it's the main instruction sheet for the content. When the parser gets to the end of the HTML, it's executed any of the inline scripts, the external blocking scripts.
When it reaches the end, it will fire DOMContentLoaded. The DOM of the document is complete at that point, you can generally, the structure of your app is complete. The async images may not have loaded, you may not have any visible content yet, but structurally, your document is complete. This is still one of the better technical metrics as far as the user experience goes.
It's not perfect, because like I said, there might be nothing on the screen, there definitely won't be all of the images on the screen. But generally, the static application code has finished running and executing.
Easy to game as well though, similar to the Page Load Time, so you have to be careful, and it's pretty much in all of these cases, test your own sites, see where the metrics line up, see what the user experience looks at, at that point and determine if it's a useful metric.
Don't just sort of pick whatever metrics people are espousing at the time.
Every site's gonna have different ones that matter to them. Page is Interactive, which was this, this has nothing to do with the current Time to Interactive metrics or any of that stuff. Back in the day that was effectively the exact same as DOM Content Loaded.
One's before async scripts run, one is after async scripts run, but it's effectively the same thing.
So when monitoring companies, for example, tell you they're monitoring the time the page becomes interactive generally, they're measuring DOM Content Loaded. You have to watch out for and we'll get to what Time to Interactive and some of the new interactive metrics are.
If they call those out specifically, then those are sort of some of the more modern metrics, but generally, most of the monitoring companies are doing the old school simple browser fired, DOM Content Loaded or readyState became interactive, we're gonna go ahead and measure that.
It's really easy to measure, because it's well defined in the HTTP or the HTML spec, the W3C spec, but it means nothing necessarily for the user.
Which sort of brings us to User Timing.
So we were trying to figure out, how can we measure pages without necessarily knowing anything about the page? How can we determine across all pages if it's fast or slow? User timing was sort of the, we don't necessarily know what's up, what's important to applications.
The developers writing the code could just give them away to instrument the pages and say, "Hey, this event happened at this point in time." It's JavaScript, you do performance.mark, you give it a name, and then anything that's measuring performance can pull all of those marks out and go, "Okay, this is the point in time when this happened," as sort of a well defined standard.
There's nothing magical about it, you could have always just done sort of console.log or store things in a JavaScript variable.
But it gives you a unified way across sites to measure important keystones in the lifetime of the application.
And so, when you're building out your more interactive apps, your single page apps and things like that, if you start marking the points where the user experience, I have hydrated my content at this point in time, for example, now all of a sudden you can have application specific metrics that actually mean something for your users and your application.
One of the big things that came out around this time and this is sort of Navigation Timing, and User Timing all happened at the same time was it's the window.performance object was added basically to the DOM.
And prior to this, there was no start time, you had no idea when the request actually started, your code only runs when the HTML started to be delivered. And so, there were all sorts of crazy hacks to try and figure out well, what was the zero time that the user actually started to navigate? So if you're in a multi-navigation flow, the previous page unload handler would record a or a cookie that said, "Hey, this is the wall time when I was unloaded," so you know when the next page navigation actually started. And so, one of the big changes with Navigation Timing is it gave us the start time, a zero time for the actual user navigation. And so, all of the User Timing marks and all of the window.performance timing measurements, all have realistic start times that you can measure from now.
And so, one of the main uses for a WebPageTest is you can, if you're not familiar with webpagetest.org it's a performance testing tool.
You put in a URL, some connectivity parameters, and you say run a test.
One of the main things it does is it records video of the page loading as well as the waterfall, and sort of the main thread activity and DevTools and things like that.
But you can compare the visual experience to the network experience to the browser events and see what was actually on the screen at the time that this event happened.
And so in this case, I'm assuming Daily Telegraph is sort of like one of the Daily Mail in the UK and more tabloidy, but anyway, it worked as a great example. DOM Content Loaded, actually, all of the content was already on the screen, all of the above the fold content, for example. Page load time in this case, so DOM Content Loaded was nine seconds.
Yeah, not great, but not the worst I've seen. Page load time was 30 seconds.
Visibly, the only difference is in the top right corner. There's a little bit I don't know if it's a sign on or something along those lines.
But more of the JavaScript has basically run and it's hooked up more of the application code, but the user experience, they've had content for 21 seconds before that. And so, if you're tracking Page Load Time, and you're at Daily Telegraph, you're not actually tracking anything useful as far as the user experience goes. You're tracking when your Sign On button became available, which is useful to know.
But it's not necessarily reflective of the user experience. And if you were to optimise for the Page Load Time, you might do things that actually delay getting the images and everything the user cares about loading. And so that's why you have to be careful, sort of what metrics you use as your goal metrics, that the behaviours you incentivize people to optimise for actually deliver the user experience gains you're trying to get.
Which sort of brings us into the renaissance of performance metrics.
It's when we started caring about, okay, those are interesting browser technical metrics that have absolutely nothing to do with the user experience. So we started paying a whole lot of time and focus to the user experience, the filmstrip, the content and rendering, when does the content render for the user? And so, Start Render, this is the WebPageTest version of when things first displayed.
Its measured by recording the video, the screen is not white anymore.
The user first saw some piece of your content. It's a great marker for when the user experience started to transition.
It doesn't tell you anything about what the user saw, or how meaningful it is.
Unfortunately, it's one of those.
If you use like a grey background colour on your page instead of a white background colour on your page, start render might look artificially fast and it may still look completely blank when you're looking at it.
And so you wanna make sure you're calibrating these metrics and checking to make sure they're actually measuring something useful for you.
First Paint, there's an ish on the line.
So first paint is the browser's view of when the content first started to paint on the screen. The browser's rendering pipeline is kind of complicated and becomes more complicated with GPUs and off-screen textures and things like that. And so, most of the browser code only knows when it laid things out, and when it sent it to the GPU to do something with to eventually get it onto the screen. And so, the first paint that the browser records, it's usually really close to something showing up on the screen, but it's not unusual for it to be blank at the time that First Paint happened, and then 100 milliseconds later, the content actually showed up on the screen. Probably also worth mentioning at this point, when you're looking at web performance metrics trying to get millisecond-level granularity is never going to happen.
So maybe an aggregate and you're looking at millions of people and you sort of see and you squint just right, you might be able to see it, but screens display 60 frames per second.
So at a minimum, you've got 16 milliseconds of jitter in your metrics just from when the screen refreshes, depending on when they started doing something. Things tend to be a lot more jittery than even that. So set your expectations that if you're trying to measure like 100 millisecond improvement, you may still have to squint pretty hard.
The noise level in most web performance metrics tends to be a lot higher than that.
RUM, Real User Measurement where you're measuring users' experience of loading the web, not in a lab. The noise levels are significantly higher than that. Just because you're also a slave to sort of user experience, user behaviour, who's loading the page at what point in time, the networks they're on, their WiFi signal, all sorts of crazy stuff.
You need a lot of users millions before you can start seeing that stuff even out. That's why I sort of, real user and lab go kinda hand in hand.
The lab metrics tend to be a lot more stable. But even in the stable case, you're still talking maybe 100 millisecond granularity.
So if you're setting goal is I'm gonna improve my performance by 10%, if you're already at like 1 1/2 second Page Load Times, you're not gonna be able to measure a 10% improvement. So something to watch out for.
Speed Index.
I'm sorry.
This was my metric that I created at Google, and it's unfortunately, very, very, very, very difficult to explain.
And it doesn't always work really well.
But what it tried to do was incentivize people to get as much of the content on the screen as quickly as possible.
And so, we saw with Start Render, if it's like a grey background, or just like a little pixel somewhere, wa-ha Start Render happened and you get full credit for it, no matter what was displayed.
What Speed Index tries to do is look at how much of the screen is painted as early as possible. And so, if you can render all of your content except for the Sign In button early, you'll get 99% of your credit for the early rendering content, and you'll just get dinged for the Sign On button showing up late just a little bit. The way it does that is it calculates the visual progress of the page loading across time, and basically goes, each frame at 100 or 10 frames per second, or whatever frame rate it's capturing at, it goes, "Okay, this frame is 5% complete, "90% complete, 100% complete." And then it just takes the area above the curve, it ends up being like someone who knows math way better than me explained it as the average time that a pixel reaches its final state. And so, if you look at the entire rendered version of the page, and each one of the pixels in that case, you average the time that it was displayed on the screen is what Speed Index gives you.
And so, more of the pixel sooner you get a much better Speed Index than if you have a blank screen all the way until the end and pop all of your content, that will give you a really slow Speed Index. The main problem with this and a lot of these is sort of, I hand waved around how you know how Visually Complete a page is at any point in time. Speed Index, Visually Complete, you'll see in a second. A lot of the metrics that sort of depend on knowing how complete you're at a point in time take a snapshot of the screen at the end of the page loading, and assume that is the final state, and then it compares everything along the way to that final state.
That works great if you've got a static page, if you've got a video, if you've got an image gallery, where you're rotating, like the hero image every 10 seconds rotates, and says, "Take a look at this, you need to buy this," you end up with sort of randomised end states, where maybe it's the second image in the carousel that gets captured at the end of the test, and you lose your credit for displaying the first image in the carousel throughout the loading process.
And so, dynamic pages that don't sort of load to a static end state are a really weak point for Speed Index in particular.
The other one that tends to toss it up quite often is interstitials.
The you haven't clicked Okay on the damn Cookie button, big banner that shows up in the middle of the page, usually 30 seconds after you started reading the content. If the test ends at the point that the cookie banner comes up, it's gonna say, "This is the content you were trying to show the user," and you'll lose all of the credit for actually showing the content up until that point.
There are two flavours of Speed Index.
SSIM, I think is the, I don't know that they're named differently. But Lighthouse, which is Google's web performance auditing tool uses a version of Speed Index, that doesn't give you credit if the pixels move on the screen.
So if you have all of your content loaded and then an ad gets inserted at the top and everything shifts down 10 pixels, you'll lose credit for all of the content that was displayed up until that point in time because the pixels aren't in the same place. So it's sensitive to position on the screen. The version of Speed Index that WebPageTest uses, doesn't care about where things are on the screen. So you can move things around, move, adjust when you get an ad banner, or whatever. And you'll still get full credit for the content that was displayed up until that point in time. Depending on how you feel about content moving under the user, like while they're trying to read it, they're trying to click a button, and all of a sudden they clicked on the ad. Business loves it, users not so much.
One of those might be more useful for you than other. They're sort of two extremes on it though, not giving you any credit at all seems kind of painful. Visually Complete, it's very similar, in that it uses the same progress calculations that Speed Index does but it basically goes, "The first point in time that we reach 100% complete, "go ahead and call that Visually Complete." There's also variations to that which is 90% Visually Complete or 95% Visually Complete, if you wanna use a threshold that goes, "You know, I don't care about the last button, last pixel being rendered, I want when is most of my content displayed. And if you want a point in time metric, one of the difficulties with Speed Index, it's an average.
So if you get a Speed Index of like 2,500, which is 2 1/2 seconds, you look at the filmstrip in 2 1/2 seconds, you will see nothing, because it's not a point in time metric, you can't point to it and say, this happened at this point in time.
Whereas Visually Completes, you can say it was 90% complete at four seconds here, look at the film strip, there you've got your 90% complete image.
And so you've got a point in time that you can reference. The reason the 100% for Visually Complete is kind of important is that it's not unusual for sites to like the gallery sites or for sites that display something and then it goes away, for them to reach 100%, drop down to 40% and go back up to 100%.
And so, the first time you reached all of the content being available is what we generally refer to as the Visually Complete. Yeah, sort of like I mentioned, there's, by default WebPageTest will pull out 99, 95, 90, and I think 75% Visually Complete if you wanted to use them as metrics.
But you're also welcome to sort of use whatever you think makes sense for yourself and for your site in particular.
And again, this is not something that's going to be universal.
You can't say okay, me and my competitors, I'm gonna measure us both to 95% Visually Complete and just go, you largely need to test your competitors and make sure 95% Visually Complete or whatever metric you're looking at, actually means something for the site you're comparing to. And this was one of the big problems.
So when we came out with a lot of these metrics, I don't know if any of you remember PageSpeed Service, but it was Google's attempt at a hosted accelerating proxy that ran in front of your sites, and will make your site's 10% faster or 50% faster. And so, we were trying to quantify without knowing anything about the sites, how much faster is it run when it's run through the PageSpeed proxy? That's where sort of the Speed Index and the Visually Complete metrics all came from. Unfortunately, they do have their weak points. And so it's like, well, we'd have to look at each site anyway, because do we know if it was faster because there was an interstitial or not, or did it not get faster because there was something going on that was a weakness in the metric? And yeah, so this is the rotating content page for example. Chloe, the website it's real.
The mobile version of the website, it's basically a big giant image behind a little bit of text.
And that big giant image changed.
And so, the final state had the second version of the image loaded.
Even though all of the content was loaded at 18 seconds, which is the first box, it only had 47% credit, and that's only even that high because some of the colours happened to match the colours that were in the 22 second version of the image. Another reason that helps to look really carefully at the filmstrips, and not just sort of point in time metrics as far as the user experience goes, you'll notice between 19 and 22 seconds, it kinda looks like crap.
And that's because the gallery rotates images regardless of the other images actually having loaded yet. It's just on a timer, and so it changes what image is being displayed.
And so, you get this case where the image that was completely loaded is getting slid out of the way and the image that was replacing it hasn't actually loaded yet.
So you have kind of a torn image, a white that you're looking at, and it's kind of a crappy user experience.
And so it's, I don't think I have yet seen a gallery that waits for the background images to have loaded before it swaps it in.
So if you feel like creating one, I think everyone, especially in the WordPress community would love you for it. 'Cause they're the ones that sort of pick up all the plugins and just use it and aren't sort of aware of what the experience looks like.
More modern versions of some of the rendering metrics, I don't know if you've heard FCP bandied about First Contentful Paint of the Chrome Dev REL team has definitely been pushing it fairly hard. Instead of the first paint, which could be random background, First Contentful Paint is either text or an actual user image that was loaded and displayed on the screen. And so, the background colour of the page or elements on the page, the rough layout of the page won't matter and won't get credit.
This is when the first piece of content that maybe the user actually cared about was drawn to the screen.
There's been a lot of push behind it, mostly because it's a relatively useful metric but it's really easy to measure, and it's really easy to guarantee that it at least means something similar across all of the sites.
So the Chrome User Experience Report, if you haven't looked at it yet, Chrome beacons back performance data for all of the sites that people visit, if they've opted into sharing data with Google. And then the Chrome User Experience Report basically aggregates all of that data by domain. And so, you can see your page and your competitor's page and look at the distribution, the histograms of some of the performance metrics between both of your sites, so you can get real user performance data for you and your competitors.
And First Contentful Paint is one of the more useful metrics that it includes in the Chrome User Experience Report. And if you're doing any performance measurements, I definitely recommend either capturing it if you're doing RUM directly, it's in window.performance as a browser visible metric, as well as in synthetic testing tools.
First Meaningful Paint.
I know there's been a lot of talk and push for it. It's supposed to be when, after the biggest layout of the page when was the next paint that happened? In theory, it's supposed to be capturing when did the main user content display on the screen? It was a great theoretical metric, and I say was, because even though it was sort of implemented three or four times in Chrome, no one's been able to figure out how to get it to measure reliably.
The biggest layout may not actually be meaningful layout it may just be juggling all sorts of stuff around that was already on the screen.
Or even after it's done the layout, it may not actually be displaying any user content in the next paint event.
And so, it's a great sort of North Star Metric that they sort of refer to in the measuring the user experience talks and things like that. But the technical implementation, there hasn't been one yet that actually works reliably.
So you can pretty much ignore anything First Meaningful Paint related.
It's not a useful metric as things stand right now. It's had a few years of trying, I think they've moved on to newer metrics, and off of that one.
And so, during this sort of user experience renaissance, we were very, very heavily focused on rendering metrics, getting as much content to the screen as possible. Single page apps, frameworks were all really big as these were coming out.
And so, JavaScript, client-side JavaScript rendering was really slow, you'd have to deliver all the JavaScript, it would run, it would set up the application and then the browser would finally start loading the content the user actually needed to see.
And so, all of the visual metrics would look really, really bad for the single page apps. And so, this is when server side rendering became a thing. Well, we'll just move all of the initial rendering up to the server, we'll send down simple HTML, our single page apps can render really quickly, and then we'll hydrate them, we'll add all of the JavaScript after its rendered. This is one of those cases where incentives sort of drove that behaviour.
I still think it's good user experience behaviour, to get them the more content sooner.
But the downside to that was, we delivered the HTML, we showed the content to users, and then they would furiously tap on the content or click on it and not to be able to do anything because the main thread on the browser was completely hung trying to do all of the hydration.
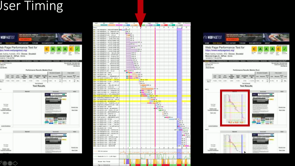
And so, my favourite one of this, if you ever look at, this is actually a fairly good one, relatively speaking, The Daily Telegraph.
So eight seconds, roughly, which is like here.
So this line down here is the main thread activity, yellow is JavaScript running, purple is layout and things like that.
Roughly around here is when the main content got displayed. For the next 30 seconds or so it's running JavaScript blocking the main thread. If the user tries and clicks, they're not gonna be able to get anything, it's gonna be really junky, a really horrible experience. But all of our performance metrics said, "Yes, we displayed the content to the user really quickly." Right, and so if you ever follow Alex Russell on Twitter, I'm sorry, but you will see him railing heavily on frameworks and hydration and server side rendering, and it's because of this.
It's we sort of incentivized delivering the content visibly quickly to the user, but the content's not actually usable.
And so, in the past couple of years, there's been a lot more focus on, okay, when is the content visible and useful to the user? When can they expect that when they tap and click on something your app is actually going to respond and be useful for them.
And so, that's where timed interactive came from, but it sort of evolved from what they called long tasks, which are anytime the browser's main thread is doing something for more than 50 milliseconds, it's considered a long task.
Basically, it's not responsive to the user tapping or trying to do something immediately.
Sort of it calculates all of those and provides them as a list of long tasks that are available after, and it starts after the page actually rendered something. And so, there were a bunch of interactivity metrics that came out of the long tasks.
And the long tasks are available, there's a JavaScript API on the DOM.
So if you're running JavaScript on the page, you can actually get a list of them in your user's browser. But the Time to Consistently Interactive, which used to be called TTI, Time to Interactive was the later of when something was displayed to the screen, Start Render, or DOM Content Loaded, which is when the application framework and the DOM has been set up.
So basically, start looking at the point where something is on the screen and the DOM has been constructed. And then scroll forward in time until we have a window with no long tasks that is at least five seconds long. And we finished loading the JavaScript on the page. And so, it's basically trying to measure the point in time where the user no matter what they're doing, they can expect a fast response.
And so, so the, the 50 milliseconds is roughly a little bit longer than the visual frame rate. The five second window was arbitrarily picked as, hey, if we've got five seconds, odds are it's going to be open for a while longer. I really don't recommend gaming this one and saying, hey, sleep for 10 seconds and then load all of my JavaScript just to game it 'cause you don't have anything hooked up yet it's not gonna be a great user experience even if you get the metric to look better.
And so in this case, down below the main thread activity WebPageTest will show you the interactivity measurement of the page.
When it's red, it's not interactive, when it's green, it is interactive.
And so, it hopefully makes it easy to eyeball kind of why Time to Interactive is as late as it is. The main problem and this is one of my main peeves with Time to Consistently Interactive or TTI is you can have a single 100 millisecond slow task in your onload handler.
And you've had 20 seconds of completely interactive time up until that, and your Time to Consistently Interactive just because JavaScript happened to be loading, even though it wasn't blocking anything, your TTI is still gonna be 20, 30 seconds or whatever, just because of that one tiny 100 millisecond window, where you happen to cross the 50 millisecond execution barrier.
The odds of a user actually tapping at that exact time and hitting that 50 millisecond window is close to zero. And so, it's one of those really weak points in the Time to Interactivity metric, in that if you happen to have one slow task way late, it's gonna make your overall time look way later and not represent the user experience at all. And so, this is another one of those cases, hopefully, when you know what it all means, and you look at the waterfalls, and you can see the red bar at the bottom.
If you see a lot of red and a lot of main thread activity, you really have a problem.
If you have a lot of green down there, and there's one red thing all the way at the end, I wouldn't worry about it, no one's gonna ding you for it. Alex may complain, but your search ranking's not gonna get hurt, your users aren't gonna notice. First CPU Idle is very similar to Time to Interactive. I think in WebPageTest, I called it First Interactive for the longest time, as basically once the first point in time where we had a five second window where the main thread became interactive.
And so, this is the case where if you added a six second sleep or whatever, you'll have a fast First CPU Idle, but I think it represents the user experience a little better.
It won't get dinged by one tiny thing way late. This is when all of your main JavaScript has quiesced and the user can generally expect it's gonna respond. So if you're gonna look at an interactivity metric, I definitely recommend looking at First CPU Idle more so than Time to Consistently Interactive. Estimated Input Latency.
Unfortunately, it's something I can't show on a graph. But it's a calculation for what's the probability in the time after the render or DOM Content Loaded, that when a user taps on something, they're going to have a delay, and how long is that delay likely to be? And so, the Estimated Input Latency when you have mostly green is gonna be effectively zero. And so this is a much better case of a metric than Time to Interactive.
First Input Delay, this is a field metric, I believe it's in Chrome User Experience Report. This is how long did the user actually had to wait when they clicked to interact with your page? And so, this is definitely a very useful one. It's the actual measured delay.
It doesn't tell you what point in time that happened. it's just when the user tapped on something, how long did they wait for that to register. And so, we still have all of these metrics, they still have all sorts of crazy rough edge weaknesses, and ways to game them, if you so feel inclined. Where we're sort of moving towards Speed Curve, which was a monitoring company created Hero Timings, which is it'll look for the main hero image on your page or the H1 element, and it'll measure the time in, point in time when those got displayed.
That sort of evolved into a JavaScript markup, a DOM markup, a HTML markup, I guess, where you can actually tag DOM elements on your page with element timing attributes, and give it a name, and the browser will tell you what point in time did those elements render, and you can calculate the actual hero elements and when they loaded versus sort of your, the browser's estimation for it.
Largest Contentful Paint is Chrome's latest iteration on First Meaningful Paint.
And it's basically when did the largest paint of content in the screen happen? They're just launching it now so we'll have to see how useful it is.
There's still a good chance that it'll be like a big giant ad banner going down the side of a desktop page or something which will have absolutely no usefulness, but it's another metric in the toolbox.
Total Blocking Time, as far as interactivity goes, is potentially more useful than either of the other Time to Interactivity metrics.
And it basically takes all of the red bars, mashes them together and goes, "Okay, you've got 200 milliseconds of main thread blocking "after a nine second Start Render.
"So you've got a 9.2 second total blocking time." And so, that sort of takes all of your JavaScript long tasks and crams them together and lets you know, in aggregate, how much of a problem do you have.
The two main key takeaways that you really need to pay attention to, how are you measuring your metrics? Synthetic, in the field? What metrics are you measuring? But more importantly, are they driving the right outcomes, the incentives? As we've seen, we thought we were doing really good when we were pushing people to look at visual metrics, visual user experience rendering, server side rendering became a thing and all of a sudden, it was bad for the user experience, right? Same goes with the Page Load Time and gaming the Page Load Time.
If you're paying someone and you're holding their annual goals to make this number faster does it actually improve the user experience? And that's sort of the core takeaway that you need to watch out for on your metrics because otherwise, if someone's income is tied to it, they're going to game it if they can't actually make it faster.
Thank you, I'll be around if you want to chat. (audience applauds) (upbeat music)
Not too long ago, improving web site performance was a relatively straightforward task. A bit of gzipping here, some concatenation there, judicious use of image compression, and hey presto, faster sites.
But as the complexity of what we build has increased significantly, the number and size of the assets we deliver has exploded, our job in ensuring highly performant sites and applications is increasingly complex.
So who better to help us navigate the most recent developments in web performance than the creator of WebPageTest, Patrick Meenan. In this session, Patrick will explore different ways to measure the “user experience”, what the newer metrics like Time To Interactive mean and how best to detect and analyze performance issues.