Building a grid-aware web
Sizing Tech’s Carbon Footprint and Why Energy Sources Matter
Fershad frames the problem: technology accounts for an estimated 2–4% of global annual emissions and can represent up to 40% of a company’s footprint, putting it on par with aviation and shipping in urgency to decarbonize. They explain that technology’s impact is tied to electricity, which varies by region between clean renewables and fossil fuels. This sets up the talk’s central theme: aligning how and where we compute with cleaner energy to reduce emissions without sacrificing utility.
Tracing Emissions Across the Stack and Picking the Levers We Control
Fershad walks through five emissions segments: hardware production (embodied carbon), back-end use-phase (data centers and servers), networks, front-end/device use, and end-of-life disposal. They note that developers primarily influence back-end and front-end, while leaders can shape procurement and responsible disposal, and networks remain largely out of developer control due to overprovisioning. An “internet that sleeps” is floated as a future idea, but today’s focus is on the practical levers teams can pull now.
Choosing Green Hosting and Building Carbon‑Aware Backends
Fershad introduces the Green Web Foundation’s verified green hosting dataset, available via a directory, checking tool, and API to help teams select greener providers and verify claims. They then introduce carbon (grid) awareness—modifying systems to use lower‑carbon energy by shifting compute through time (cleaner hours) or space (cleaner regions). Nuances and grid constraints require thoughtful load balancing, but these strategies are viable today and already in use.
Big‑Tech Examples and a Case for Grid‑Responsive Front Ends
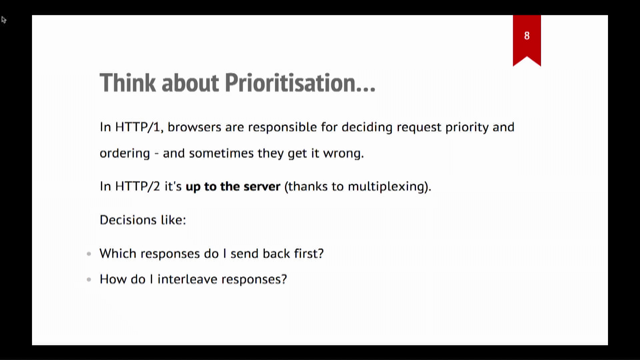
Fershad highlights live implementations: Google moving workloads to cleaner regions, Microsoft scheduling carbon‑aware Windows Updates, and Apple piloting cleaner‑energy charging for iPhones. For smaller teams that can’t move users in time or space, the path is dynamic, grid‑responsive front ends that meet users where they are. They demonstrate Branch, an online magazine that removes images and delivers a core reading experience when the grid is dirty, progressively enhancing features as the grid gets cleaner.
Lessons from Branch and the Shift to Edge‑Powered Grid Awareness
Fershad explains Branch’s limitations: client‑side grid checks cause a “flash of unstyled website,” heavy API calls and DOM work on user devices, and a mismatch when decisions use the host country’s grid rather than the user’s. They then present the Grid‑Aware Websites project, which precomputes variants at the CDN edge to eliminate the flash and tailor the experience to the local grid (e.g., Taiwan vs. UK). This edge approach is optimized for performance and enables incremental adoption on existing sites and routes.
Implementing Grid Awareness: Open Library, Electricity Maps, and Incremental Rollout
Fershad details an open‑source library that handles grid‑awareness logic—querying an API and returning flags developers can use to toggle design and functionality. They use Electricity Maps as the data source and are collaborating on a new API to better support grid‑aware use cases across the stack. The Electricity Maps open‑source map offers rich, interactive grid data, and the approach lets teams adopt grid awareness progressively without rewriting entire applications.
Productionizing on CDNs and Designing Low‑Carbon User Experiences
Fershad shares helper libraries for Cloudflare and Netlify to reduce boilerplate and leverage advanced edge features, and invites other CDN providers to collaborate. The core library is plain JavaScript, encouraging experimentation wherever server‑side JS runs. They deliberately leave UI choices to teams, suggesting patterns like limiting high‑FPS animations on dirty grids, reducing nonessential JavaScript, and swapping dynamic ads for static when needed—backed by design inspiration directories that prove sustainable UX can be beautiful and engaging.
Toward a Grid‑Aware Web and a Fossil‑Free Internet
Looking ahead, Fershad imagines browser‑level grid awareness (with privacy safeguards) and “green CDNs” that route via cleaner energy regions, citing Solar Protocol as a working example of solar‑powered, sun‑routed hosting. They emphasize the end goal: a fossil‑free internet that obviates time/space shifting because clean energy is the default. The Green Web Foundation’s mission targets 2030, and Fershad invites collaboration via workshops, training, and services—especially with teams across Australia, New Zealand, and APAC—to scale these practices.
[Foreign] Before I start, I did leave a few stickers around on some of the desks, and then I ran out. So if you would like a sticker or if you would like to trade stickers, please come and find me tomorrow. I'll have more with me, and I need to make my luggage lighter because I've got Tim Tams to take home to Taiwan with me.
All right, so it's been a long day, so I'll try and be quick with this, eh? Two to four percent, that's the range you'll normally hear people talk about when they are referring to the annual carbon footprint of technology.
For most companies, technology can be upwards of 40% of their own annual carbon footprint, even if they are not a tech company.
But back to this 2 to 4% number. Doesn't seem like much, right? Global annual emissions 2 to 4%, really small.
Comparing across industries, this figure puts tech in line with aviation and shipping in terms of an annual carbon footprint, an annual impact on the planet. And I think we can all acknowledge that aviation and shipping are industries that need to decarbonize and decarbonize fast. Tech is in the same boat. That was an unintended pun.
Just like aviation and shipping, tech plays an important part in our daily lives. And just like a lot of other things in our daily lives, tech requires energy and electricity to make it work. Where that energy and electricity comes from, though, varies. In some places, as this map shows, in green and different shades of green, some places have access to plentiful amounts of clean, renewable energy.
But most of the world still relies on finite, polluting fossil fuel sources for their power.
So we'd ideally like to be using the greenest possible energy for our compute at all times. But as that map showed us, it's not always going to be possible, right? But as people working in technology, we've got a lot of levers we can pull on the back end and the front end to make sure that when available, we can use green energy for our compute.
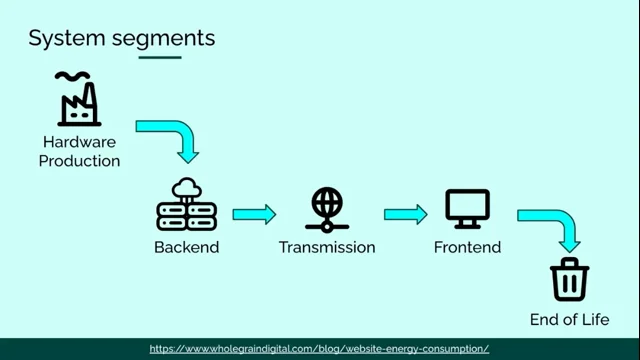
And when we can't have access to that green energy, we can do things to reduce the amount of energy our websites and apps are consuming on the user's device. To do that, let's first understand where the carbon emissions of tech come from. You'll normally see these represented in these five system segments here.
Starting with hardware production, every time you buy a device, there are embodied emissions that come along with that device. That's why the best practice is to try and extend the life of your device for as long as possible, so you reduce, you spread out those embodied emissions over a longer period of time. We've then got the use phase emissions from backends, the topic that everyone's talking about now, data centers and servers. You've got networks, transmission, and front end, people using the devices. A lot of you are in the room right now.
And finally, you've got your end of life, the disposal of the devices themselves.
that also has an impact.
Now, as web developers and app developers, to be honest, we only really have control over the back-end and front-end components of these five. If we are lucky, and I'm glad I'm speaking in a room with leaders, if we are lucky, or if you are able to within your organizations to have sustainable procurement practices, you can take care of the hardware production and end of life components on behalf of your staff. It is not something that they can control, but you as leaders can control that, or you might sit next to someone in the office who is able to make that decision. And meanwhile, for networks, for transmission, these things are over provisioned. They are always on.
They have to be so - to deal with spikes in technology, to deal with spikes in access.
So for example, when COVID happened, we don't have any levers we can pull as developers on that segment right now. There are people trying to work on that problem.
One of the most beautiful solutions I've heard ideated is an internet that sleeps, that kind of shuts off and then wakes up as it needs to just in time. It's a nice idea. There's a lot of work to get to something like that. But as a web developer and an app developer, we are left with control over the back end and front end. And we can already do some things on the back end today.
At the Green Web Foundation, we maintain a data set of verified green hosting providers. This has been going since 2006 and is updated regularly. We add, update, and remove hosting providers from time to time.
We ask them to provide evidence updates to us on an annual basis.
So annually they have to share evidence with us, which allows us to verify their green claims.
We make this data set available through an online directory.
So the next time you're starting a new project, perhaps you can visit our directory and see if you can find a green hosting provider that fulfills your needs for some of the services you might require. We also make this data set available through an online checking tool and an API.
This allows developers and anyone really to go to a website and enter a web domain and it returns a result to show whether that domain is served from a green web host or not.
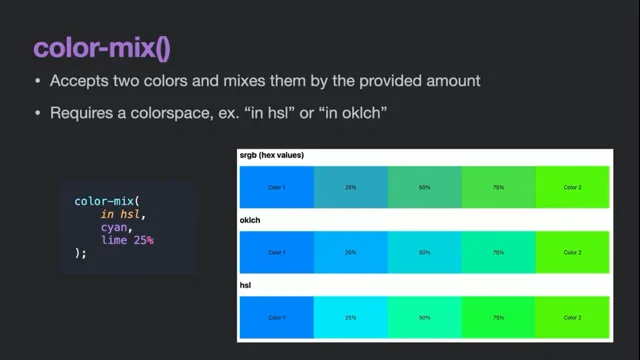
But besides using green web hosting, one of the other things we can do is to make our software grid or carbon aware.
Now, there is slight nuance between the terms grid awareness and carbon awareness, but for the purpose of this presentation, I'm going to be using the two interchangeably. So carbon awareness is all about modifying our systems to take advantage of the lowest carbon energy possible. And there are two ways that we can do this. We move our compute through time, or we move our compute through space.
Moving through time means running compute at a time of day when there is more green energy available on the grid.
Whilst moving through space means moving to a place where there is more green energy available to us.
Now there is again nuance to both of these approaches.
If everyone in Melbourne suddenly decided, "Hey, I'm gonna run my computer 2 p.m. in the afternoon because the grid's clean then." Good luck. The grid here is gonna freak out. But likewise, if everyone in Melbourne decided, "I'm gonna run in that data center in Tasmania because they've got the greenest energy in Australia", Tassie's gonna have a panic attack. All right. But there are - these two approaches are what we have available to us today. And there are ways that you can balance out that load across your systems so that you are not putting pressure on the physical grids themselves.
And this is something that's been already being done by organizations.
So Google's been moving compute through space, moving to cleaner regions for upwards of five years now.
Microsoft has been trying to do this on user devices as well. They have carbon aware Windows Updates, which try to find out the time of day when there'll be more clean energy on the grid and schedule the update to run at that point in time.
Likewise, Apple's been trying to do this around how and when iPhones get charged. Now, this feature was released as a beta in the US. I'm not sure if it's made it out to Australia as yet.
But if you are an iPhone user, you can keep a lookout for it.
But what if you're not a multi-billion dollar tech company?
What if you're just a web agency building websites and apps?
We can't throw our users out and tell them to come back at a different time. We can't tell all of our users to move to Spain just so they can use green energy as much as people might like to move to Spain to use green energy. We have to meet our users where they are. We have to provide them with dynamic experiences on the front end that react and respond dynamically to the grids that they are being used on.
This is an example of it happening. This is Branch. It's an online magazine that we run at the Green Web Foundation. Branch was launched in 2020, and it's one of the earliest and one of the fewest examples of a website that changes how it looks and how it behaves based on the energy grid. So you can see here that when the grid is powered by more fossil fuels, Branch will present a core experience to the users. Images are removed.
A user has to opt in to view them. But we present the core experience to them, which means the article which they have come to read.
As the grid becomes cleaner, that experience is progressively enhanced with more features and functionality.
But there's a catch. Because the first time you visit Branch, at least the way that Branch has developed today, the first time you visit it, you'll get an experience like this.
So you'll notice we had that gray screen. I'll play it one more time for you. You'll notice we had a gray screen before the colorized version of branch came into view for the user, right? It's almost like a flash of unstyled something. Flash of unstyled website. There you go, I've made up a term. And that's because all the processing to determine what version of Branch to show the user based on the energy grid is done on the client.
Doesn't matter if the user is using a MacBook Pro or if they're using a seven year old Linux machine.
It's done on the client. That's a lot of API calls, and that's a heck of a lot of DOM manipulation going on on the user's device. Another thing which is slightly counterintuitive is that Branch bases the version it shows you on the UK's energy grid, which is where the website's hosted.
But the changes it's making are trying to reduce the energy on my device, the energy being used on my own device here in Melbourne or in Taiwan where I live. But it's making that decision based on an energy grid that's not relevant to me at all, right? It's a good start, but we can do better. That's the idea behind this Grid-aware websites project, which is a project that we've been working on at the Green Web Foundation thanks to funding from SIDN fonds in the Netherlands. We've been working on it for about eight months now, and the idea behind grid-aware websites is to create dynamic online experiences that respond to the energy grids that they are being used on. This is for the front end.
So looking at that same Branch website again, you'll notice this time there was no gray screen. I'll play it one more time for you.
So there's no gray screen shown. We jump straight to the version of the website that we need to show the user. You'll notice as well that it was a different color this time. The previous one I think was green. This one was orange. And these videos were taken a minute apart.
This orange version is based on information for Taiwan's energy grid, which is where I live.
The reason we're not seeing this flash of unstyled website initially is because all of the processing for grid-aware websites as a project leverages cloud edge functions, CDN edge functions, CDN edge workers. So the processing is happening in machines that are optimized for this kind of stuff. We're not leaving it up to chance on the user's device.
We use data from an organization called Electricity Maps, and I'll talk about them a bit more later, which has information for a lot of grids around the world and makes it available through an API which we can query. And by using these edge functions, we allow for two things. We allow grid-aware websites, which is a new idea, a new project, to be applied to existing websites today. and we allow it to be done in an incremental manner. You can apply grid-aware websites or grid awareness to your own website on specific routes and then test it out, get user feedback and increment from there. So how might you go about making your website grid-aware? Well, we've been working on an open source code library. So this library does all that grid- aware logic. It does the checks to the API and then we'll return a flag to say the grid is in this state, which then indicates to the developer design changes should be applied or not.
I mentioned Electricity Maps before. We use their API as a source of data. There are other providers out there, but Electricity Maps is very comprehensive, and we are actively working with them to create a new API, which will be super useful for the grid-aware websites project, but will also be useful for other applications of grid awareness across the tech stack.
And we hope that that API can be released maybe this week, maybe next week. You'll have to follow us on LinkedIn to find out when that happens. If you remember the map I showed at the start of this talk, that's an open source project from Electricity Maps as well. And there's a lot of interesting data in that map. It's very interactive. So if you have a moment, go to their website and check out that map, click around, see what you find about some places in the world and how they get energy.
We're also working on some helper libraries which allow grid-aware websites, this project, to be applied to existing CDN edge functions. So we have helper libraries for Cloudflare and Netlify. The purpose of these are to use some of the advanced functionality that these CDNs provide, as well as reduce the amount of boilerplate code that people have to write to get this thing off the ground. That said, we would love to work with other CDN providers and we would love to figure out how grid-aware websites can be applied on other CDNs.
So if you know folks at any of these providers or any other CDNs that offer edge functions as a service, please put them in touch with us. I'd like to nerd out with people every now and then so we can have a good chat. Grid-aware websites, that core library I showed you initially as well, that is just JavaScript. So in theory, wherever you run JavaScript on the server, you should be able to run that library. I haven't tested it out. That's why I'm being a bit kind of guarded with my statements.
But if you want to test out for me and raise any issues on GitHub, you're more than welcome. I say now and regret later.
So we talked about how you apply this, but what about those design changes, eh? Our grid-aware website's library deliberately stops short of applying arbitrary design changes to websites.
And that is because every website is unique, and we understand that the stakeholders that are responsible for a website, the designers, the product managers, the developers, whoever else, have their own requirements for that website. So we do not feel comfortable going in and just saying, "We're gonna do this on your website." That decision is left up to the designers or the developers that are implementing this. But here are some ideas you might want to think about. Stephanie, I'm sorry, only animate content when the grid is clean if you can, because animating stuff on the web at 60 frames per second is one of the most energy intensive things you can do in a browser. Try and be creative with other content like images, videos, other interactive elements that are on your website. Limit the amount of use-- well, use less JavaScript, sorry. Like just in general, use less JavaScript. But maybe when the grid's dirtier, you can look and see what parts of your website might not be necessary for core functionality.
Maybe you could run fewer dynamic ads, please.
You could replace them with static ads, perhaps, when the grid's dirty. And as the grid becomes cleaner, you can then put those dynamic ads back in there. For a bit of design inspiration, check out these two directory libraries. I hope that they give you a sense that sustainable web design doesn't mean a poor web experience for users. It doesn't mean a boring website.
Some of the websites that are showcased in these directories are really, really engaging, really interactive, and really beautifully designed.
So just to wrap up, what about the future? Like we've talked about applying grid awareness to individual websites.
What about a grid-aware web? What about grid awareness in the browser with just a toggle? Instead of individual websites having to apply this, and it being piecemeal, what if every website could become grid-aware?
Now, there'd obviously need to be thought given to stuff like fingerprinting and how you reflect to the browser what changes to make to your website, or do we just let the browsers run wild and make changes on our behalf? But this would be so cool.
What about the idea of a green CDN or a grid-aware CDN? Instead of just prioritizing delivering content from the nearest location to a user, you prioritize delivering content from the nearest location to a user that is powered by the cleanest energy. And this is actually possible today.
This website you're seeing here is hosted on something called the Solar Protocol. So it's hosted on a bunch of servers around the world, all connected to solar power. Solar panels.
And the version of the website you get is the one is from the server that is receiving the most sunshine at any given time.
But if I'm honest with you, this is where we want to be. A fossil-free internet.
Because once we're there, we don't have to worry about grid awareness.
We don't have to worry about moving compute through time or through space because the internet is green by default, when we're here. And that is what we're working towards at the Green Web Foundation. We are a Dutch nonprofit that works at the intersection of technology, climate change, and climate justice. And our mission is for a fossil-free internet by 2030. If the ideas in this talk or the idea of a sustainable internet appeal to you, please do get in touch. As a nonprofit, funding is always a struggle for us. We do offer workshops, training, and other commercial services. So if those are things that might appeal to you, please do let me know. We would love to do more in Australia, New Zealand, and APAC as well, because being a Dutch NGO, we've so far been focused a lot on the US and Europe.
Look forward to talking to you all throughout the next few days, folks. Thank you.
.
What if websites could adapt their behaviour based on the electricity powering them? This talk explores the vision of a grid-aware web that responds dynamically to the availability of clean power sources. We’ll examine the role that engineering leaders and decision makers can play in pioneering a web that operates with a sustainable focus.