Debugging Apps with JS Frameworks
Hello, I'm here today to talk to you about debugging applications built with JavaScript frameworks, and I'm here to talk to you about debugging because like probably most of you, I wasn't always very good at it.
You know, this was very much me.
Most people are not taught how to debug.
Nobody ever sat me down and said, oh, this is how you use debugging tools, or this is how you should approach a problem whenever you encounter an issue with your software.
And so I ended up doing what a lot of developers do and use what I like to call the debugging dartboard.
Right?
So you may kind of throw spaghetti on the wall.
See what sticks, do a lot of trial and error where maybe you change one line of code at a time, or you just kind of comment things out in order to see what happens.
And then eventually hope that you stumble upon an actual solution.
And this isn't great because developers actually spend up to half their time debugging and maintaining software.
We talk about how developers are more like mechanics just kind of trying to keep the engine running versus architects who can build out new features and functionality for our users.
So we spend all this time debugging, but we aren't taught how to do it, especially not how to do it effectively.
And the issue here is that debugging is complex because our applications are complex.
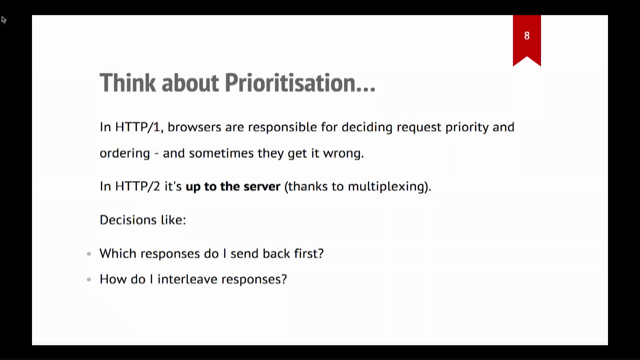
So if you think about your application and you think about clicking a button.
A lot of things happen whenever your user clicks that button.
So you may have an event listener, then an event handler, you may set a loading state in your store then you have an API request that can go out to your backend, which has a request handler, which may then do some business logic, update the database to say, you know, whether or not an, an item is now sold.
And then you need to send the response back up to the front end, which then handles the response.
Maybe it updates your front end store again, sets that loading state back to false, and then finally updates the DOM with whatever new information was received.
So.
There's a lot of things that happen from a single button click.
So if your user clicks that button and something goes wrong, or it doesn't work the way that it's expected, then there's all these potential steps that could have the problem.
You have to investigate potentially all of these steps in order to debug.
So that's an application.
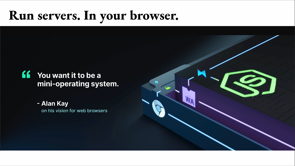
Now frameworks add even more complexity and whether you're building with React, Angular, Vue or something else, you know, frameworks make our life a lot easier because they give us these tools to develop applications, but they also do add complexity, which can make it more difficult to debug.
So again, if you think about all of those steps that your application goes through, in reality, it looks more like this because you have things like event emitters, maybe you're dispatching actions to a front end store.
There's life cycle hooks that are triggering in between.
And all of this is, you know, you're writing this code to interact with the framework, and again, these are all steps at which something could go wrong that you then need to debug.
So the good news is that we can fight this complexity by identifying patterns within frameworks.
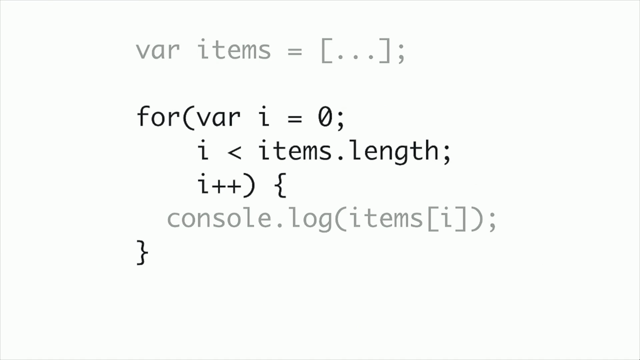
We already do this with JavaScript.
There are patterns within JavaScript that we learn and then we're able to use when we're debugging.
So let's take a look at a pattern that most of us know.
So type error, "x" is not a function.
This is an error that most of you have probably seen quite a few times.
I know I have you know, I write buggy code all the time, like most software developers.
And you may already be thinking of some of the reasons that this error could occur.
You know, things like, for example, a typo in the function name, X is not a function because it's spelled wrong.
It could be the wrong prototype.
Maybe you're calling a function on a string that really is a prototype function for an array, for example.
It could be that the variable that you're calling the function on is the wrong type.
So say you do mean to call that string method, but for some reason, the variable that you're calling it on is actually an array.
So that could be another issue.
And then also it could be a missed import.
You know, maybe X is not a function because you never actually imported X before calling it in your file.
So again, if you were already thinking of some of these potential solutions for that error or potential causes, I should say for that error the reason that is because you've been able to identify those patterns through experience with debugging these issues.
So we can do the same thing with frameworks, and we can do that by using tools that are specific to framework debugging, to better understand how our application interacts with our framework.
So let's take a look at some of those tools.
First is framework dev tools.
And so again, whether you're using React, Angular or Vue, there is a dev tools for you.
And so all of the three major frameworks do come with a dev tools.
There is also Redux dev tools.
So despite the name, redux dev tools can actually be used for a variety of state management frameworks, including Vuex NgRX and MobX.
And so if you are using that same pattern where you're dispatching actions then you can leverage Redux dev tools.
All of these dev tools essentially do function in similar ways.
So you typically that can be used in a browser or your IDE, your text editor, your development environment.
And then they come with kind of two categories of functionality.
The first is inspecting.
So this may be the component or in Vue, it's called the inspector tab, which allows you to take a look at things like elements, your component's state, and values, and further its props, and then also evaluating.
So this is understanding the execution, what is triggering renders and perform.
And these tools are specific to the frameworks that they support.
But again, they do have similar patterns.
So let's go ahead and take a look at an example.
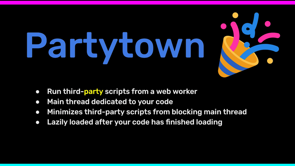
This is an application it's a Vue application built with Vue Resource Library.
And this is a video of interacting with the application and we can see on the right hand side, the inspector tab is open in view dev tools.
And again, if you're in React or in Angular this is gonna be called your components tab.
What this does is it allows you to inspect the components and your application to be able to view state and props or, in view, you know, things values that are inside your setup function as you're interacting with your application.
So here as I'm, you know, typing in my form and as I'm selecting a type I can see on the right hand side, my, you know, my error message updates, my search input updates.
So I can see that live reaction to the user interface updating via the dev tools on the right hand side.
And this is again the inspector or the component tab, and it allows you to be able to inspect those types of elements within your application.
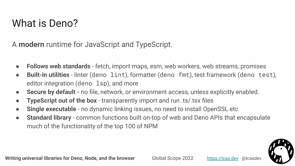
Then there is the timeline or again, in React and Angular, it's called profiler.
This allows you to understand the events in your application and then specifically for React and Angular as well, the change detection events.
So understanding when your components render and why.
It does allow you to record essentially a flow of your application in order to then understand the performance that took place and evaluate that within that recording.
And then you can also see all the individual, again, methods that are being called from the framework within the dev tools.
So here in this video, I am essentially interacting.
I'm uploading a component.
And when I do that, I can see every single one of my component cards re-renders.
And so even though I'm only interacting with one card, all of my components are re-rendering and that could be potentially a bug or a performance issue.
And that's something that I'm able to identify with the pro the profiler or the timeline tab.
So then we also have kind of these, our, our regular dev tools, which is now here in the Chrome dev tools.
I am using a debugger, which I've used to essentially lock in on a point in time in my code execution.
So I'm using a Vue method called onRenderTrigger in order to stop the application, whenever a render is triggered so that I can then evaluate what is causing that render to occur.
So if there are more renders taking place than I expect, or that should be happening, I can go in using these methods provided by the framework to evaluate what is causing that to occur.
So this is a function that's provided by Vue.
And then there are other functions in React and Angular that could allow you to tap into certain functionality in the framework.
So you can understand how your framework is reacting, [laughs] no pun intended, to user interaction in your application.
While it's extremely helpful to leverage framework dev tools in order to inspect and evaluate your code and also understand how your application is interacting with your framework, there can be some difficulty because it is a little bit like catching lightning in a bottle.
Developer tools are evaluating live.
As we saw every time that I would type in an input, my dev tools would update.
The breakpoint has to catch that moment of time and execution.
So many developers will end up if they don't know where the problem is occurring, will add break points or add random console logs to different lines and try different things manually, in order to try and catch the bug that's happening.
You know, you have to reproduce it every single time.
You may have to make a change to your code, save that, reload your server in order to see that new console log.
And if it evaluated the way that you expected.
And all of that becomes a little bit of a tedious debugging process because everything is happening live and you're having to reproduce as you go.
So again, it can kind of start to feel like that dartboard again, where you're adding break points or adding logs across different points in your execution, hoping for the best.
So again, going back to all of the events that take place once we click on our button, we talked about that there's not only the, the things that are happening from the framework, but there's also the framework itself.
So there's underlying framework code that is executing between each of these component render.
You know, like we saw there's the triggers, there's the patches there's watchers that are, you know, keeping an eye out for state changes.
There's things that are being you know, deciding whether or not the component is gonna bail out before it actually rerenders or not based on a state change.
All of this happens in between every single piece of code that you use writing the framework and you know, what happens if you need to debug something in the framework itself, or if you need to really understand why the framework is reacting to your code in a certain way?
Or what if you just want to be able to pause at any point in time without having to reload your server, and reproduce it every single time?
So you could use something like Replay.
So Replay lets you record your application to create a shareable recording with built in debugging tools.
You know, at its core Replay is a runtime recorder, the Replay browser can be used to record manually, or you can also record automated test execution.
The replay itself, isn't just the video.
It actually captures everything that's happening in the browser including your HTML elements, your JavaScript execution, network requests, user events at each and every moment in time so that you can then replay your application execution to debug.
So let's take a look at an example.
Here we have our viewer, which is playing a recording or a replay of the Vue Resource Library that we took a look at.
And I can see all of my click events.
I can see my key presses.
I can navigate between them in order to go through time.
In my dev tools tab, I'm going to get access to all the debugging tools that I'm familiar with from browser dev tools and also from framework dev tools.
So in the developer tools tab, you'll have things that you're familiar with.
Like being able to inspect your sources.
You'll have your console evaluations you'll have your React dev tools to be ordered in order see your components.
And then you'll also have network requests, call stack, scopes, everything that you kind of would expect from a debugging experience.
In addition, you can also see how your code executed during the recording.
Here, I'm taking a look at view source code, and I can see on the left hand side, a function outline that shows me how many times each function was called during the replay.
So this can help me see, for example, if I'm expecting a function to call and it doesn't to be be able to dig in why or if, for example, a render function is being called way more than it should be, that can help point me in the right direction for my debugging.
The real magic of replay comes though in the ability to add print statements or console logs retroactively to the recording.
So instead of having to add console.log here, console.log here, console.log here.
You know, again, reload your application, save it.
You can add a console log to the recording and then log it to the console as if that already existed at the point in time, the recording was created.
So here in this video, I am essentially, I'm adding a console log to a line of code.
And I'm outputting the tag and the props every time an element is created.
I can then navigate through every execution or call of this line and see what the value was at that point in time.
I can fast forward.
I can rewind.
I can see the DOM update in reaction to those navigation points and again, see what the values were at that point in time.
And none of this requires me to reload my application or go back and find that version of the code.
Everything is done within the replay itself.
And lets you kind of essentially go back in time to that moment, and add a print statement to see what the the value would have been when that application ran.
So again, by using tools and no matter what tools that you use the point is to use them effectively to identify patterns.
And so I had to say that maybe the real treasure was the bugs we fixed along the way.
Right?
So every time that you debug you not only better understand debugging, but you also better understand your application and its interaction with the framework used to build it.
And this helps us to identify patterns, right?
So patterns like component rendering, you know what triggers a render.
What doesn't trigger a render.
These are things that you can identify by better understanding your application and framework relationship.
Also things like state some really common patterns are having multiple sources of truth.
Maybe you have state being managed in a component, but then also in a global level, and they may be competing or have different values at different points in time due to some like a race condition or an accidental mutation.
There's also error handling.
So, you know, understanding, do you have silent errors in your application?
If you click the button, then nothing happens including no output that makes it much harder to debug.
Additionally, understanding how you pass errors through your application and how you pass them you know, potentially through components or also through different function calls.
These are patterns that can cause a lot of bugs when you're using frameworks and being able to understand those and identify them will help you get better at debugging over time.
But essentially the point is to, you know, embrace bugs intentionally with a learning mindset, don't be afraid of debugging and because it is really an opportunity to learn and to identify these patterns.
You know, throw out the dartboard you're gonna spend half your time debugging anyway.
So you might as well enjoy it and get better at it.
Thank you so much.
And happy debugging.
Developers spend up to half their time debugging software, but many don’t have an effective process or understanding of debugging tools. JS frameworks add to debugging complexity. This talk outlines how to approach debugging apps built with JS frameworks like React, Angular, and Vue. We’ll discuss process, tools, and identifying common framework-related bugs.