The state (of the art) of Observability: Using telemetry to create insights into user experiences and business outcomes
Framing Observability Around Business Outcomes and Bias Disclosure
Erwin frames observability as a means to align engineering with business outcomes, shifting focus from “are servers happy?” to “are customers happy?”. They outline the talk’s agenda—state of the art in observability, the plummeting cost of context, and three business outcomes to target—while noting their affiliation with Honeycomb and acknowledging potential bias. This setup grounds the conversation in practical impact rather than tooling semantics and prepares the audience to evaluate observability through a business lens.
Tracing the Evolution: From Logs and Metrics to Distributed Tracing
Erwin walks through the evolution from file-based logs to time-series metrics to APM and, crucially, distributed tracing. In today’s microservices world, they argue, tracing is essential to understand who talks to what and to diagnose interactions across services. This historical arc explains why older, siloed approaches struggle with modern complexity and sets the stage for making traces the primary observability data source.
Standardizing Telemetry with OpenTelemetry
Erwin introduces OpenTelemetry as the consolidated successor to OpenCensus and OpenTracing, celebrating a rare reduction in competing standards. They explain how OTel provides a vendor-agnostic way to instrument code and export telemetry anywhere, eliminating the need for multiple proprietary agents. This standardization enables flexibility and portability, supporting the broader goal of using observability to drive business value rather than vendor lock-in.
Lowering the Cost of Context with Smarter Sampling
Erwin explains the “plummeting cost of context”: with time-series metrics, each new dimension explodes cost, while event-based traces let teams add rich context and compute metrics on the fly. They detail head vs. tail sampling—head is easy but context-poor; tail is powerful but requires buffering—and show how keeping all error traces while sampling successes controls spend. By choosing an acceptable accuracy level, teams manage costs while preserving the detailed business context needed for meaningful analysis. This shift makes the information we actually want—customer, plan, user, and product context—effectively affordable.
Connecting Telemetry to How Companies Make Money
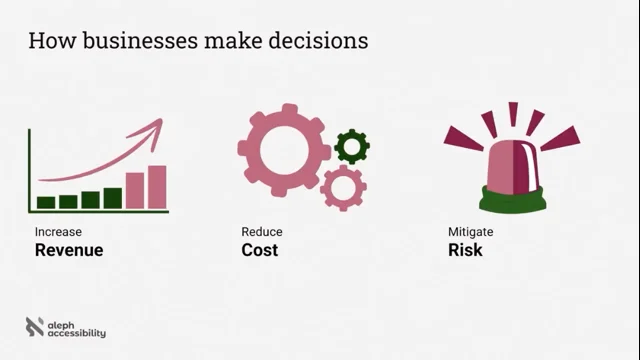
Pivoting from data to decisions, Erwin urges engineers to understand how organizations make and use money, referencing the Personal MBA. They preview three avenues of business outcomes—protecting revenue, reducing cost, and increasing revenue—and propose measuring what matters along these lines. This reframing turns observability from server-centric diagnostics into product and business instrumentation.
Protecting Revenue with Risk Management and SLOs
Erwin explains revenue protection as managing risk: know your “one job,” meet compliance requirements, and prevent outages. They demonstrate Honeycomb’s use of SLOs to page on ingestion and query latency, and they describe comparing canary vs. production error rates and performance before full rollouts. Observability here safeguards reliability and trust—foundations for sustaining existing revenue streams.
Reducing Cost the Right Way: CAC, COGS, and Unit Economics
Rejecting superficial cuts, Erwin focuses on meaningful cost levers: customer acquisition cost (CAC) and cost of goods sold (COGS). They show how Honeycomb tracks per-invocation Lambda costs in telemetry to identify high-cost query paths and optimize by customer segment, especially for heavy users. This segment emphasizes measuring unit economics in production to guide pragmatic performance and cost improvements, particularly for mature organizations.
Driving Acquisition with Telemetry-Informed Experiences
Introducing the AARRR “pirate metrics,” Erwin starts with Acquisition and gives concrete examples. For Honeycomb’s enterprise trials, telemetry triggers Slack alerts when trial users hit rate limits so solutions architects can help in real time; for e-commerce, teams should monitor Core Web Vitals on product and home pages to protect conversion paths. The throughline is using observability to ensure prospective users experience fast, unblocked entry points.
Activating Users: Identifying Behaviors That Predict Success
Erwin defines Activation as the moment users become likely to succeed long-term, citing Facebook’s “7 friends” heuristic. They recommend instrumenting sign-up and onboarding flows—checking completion and accessibility—and share Honeycomb’s activation proxy: creating and using SLOs. Observability helps teams detect friction and confirm that key activation behaviors are happening across all user segments.
Retaining Customers, Encouraging Referrals, and Unblocking Revenue
For Retention, Erwin tracks whether customers continue getting value (e.g., active users per account) to avoid surprise churn. On Referrals, they instrument share actions and inbound share traffic—illustrated by a news client—to help existing users bring in new ones. For Revenue, they stress monitoring payment and checkout flows, including abandoned carts and follow-ups, because many users who want to pay can’t due to avoidable friction. Erwin closes by urging a mindset shift: use observability to ensure customer happiness and business outcomes, not just server health.
But yeah, let's go talk about observability.
It's the much over-hyped word that we're talking a lot about lately.
And so, what is it? But more importantly, where is it at? As sort of an industry, where it's going. But more importantly, how do we use it to align ourselves around certain business outcomes?
One of my favorite quotes from one of my colleagues is: "We used to worry about whether the servers were happy. Now we can worry about whether our customers are happy." And so that's what this is going to be about. First, I want to start off with a little bit of a disclaimer.
Then we're going to talk about where the state of the art is in observability.
I want to talk about one of the consequences of the technical sort of progress that we made there, which is the plummeting cost of context. And then we're going to talk about the three possible business outcomes that Maia sort of cleverly spoiled for me.
But we're going to dig into that a little bit more.
So the disclaimer is that I work for Honeycomb, which is sort of known. A lot of what I'm going to talk about is stuff that we do None of it is specific to Honeycomb. More importantly, people have very much sort of accused me of being biased about this because I work for Honeycomb, to which I say you're completely correct that there's a very strong correlation, just not in the direction you think it is.
But yeah. Let's go back a good set of 75 years. Wherein the sort of 50s, we had these things called files, and they were great to store strings in, lots and lots of strings. And so we had logs.
Then at one point, we started having sort of time series sort of database. Then it became sort of easy to store a lot of information in a sort of based on time and we can start querying on time sort of effectively. And that led to a set of metrics, right?
2000s, 2010s, we're starting to get into sort of application performance monitoring, But more importantly, distributed tracing started to become a thing. And distributed tracing is the thing we definitely need these days, right? In our microservices world, where everything talks to everything else, whether that's a good idea or not. Just knowing who talks to what is a non-trivial problem a lot of organizations are having these days.
So observability, the term sort of came about 2016.
And so where are we at right now?
And so this is sort of like the one big thing that we're sort of seeing. Distributed traces as your single source of truth. The challenge with metrics and the challenge with logs is that they're all separate sort of bits of data that we then need to sort of put together and sort out again. And it's usually you, the developer, or your unlucky AI companion who has to do all of that work.
And so that's really, really hard. And by having traces or sort of wide events as your single source of truth, we can now calculate those metrics on the fly. We don't need to store these metrics independently anymore.
Does that mean that there's no case for metrics at all?
No, there's still some bits and pieces where metrics are useful.
But in general, most of those can be calculated on the fly.
And like I said, that doesn't mean we have to let go of our graphs. Right?
We can make more interesting graphs because we can sort of query for a particular subset at any sort of point in time. So we don't have to think ahead of what dimensions we might want to query by. But we can on the fly figure out what is relevant to us and then create these sort of graphs on the fly. So traces don't mean no metrics. When we talk about traces, it's the source of truth that we're talking about.
One of the other set of massive changes in the observability ecosystem is the open source project that's OpenTelemetry.
There used to be sort of two big ones.
Are people familiar with the one XKCD that - there there were 14 standards and then they decided to create a standard to rule them all and now there's 15 competing standards. This is the one time that I'm aware of that two of those 14 standards went 'maybe we should like join and become one.' And that's sort of what happened with open sensors and open tracing. They merged, and OpenTelemetry is the sort of outcome of that. So we reduced the amount of standards in the world by one, which is really impressive.
And so what's great about OpenTelemetry is that It gives you one way to talk about instrumenting your code. So you can instrument your code with OpenTelemetry and then export that to pretty much any vendor in the space. And so that's amazing achievement, right? Where before you had all of these, every vendor, have their own set of agents that you would install and use to collect and send your telemetry data.
That's no longer the case. You can just use OpenTelemetry and switch, or use both, or all of the providers that you sort of want.
So, with that set of two things, what we see is the plummeting cost of context.
When you're using time series data as your main source of truth, you create a new time series for every unique combination that you want to measure.
Right? So if you go to your vendor or if you go - what does it cost to store a time series?
You can then start to go, well, so what we want to measure is we want to measure our P90 latency and the amount of errors and maybe do P95 as well. Do we need P99? I don't know, maybe. Let's just throw that in.
Multiply that by the amount of hosts that we have, then by the amount of request methods, the response status codes, what API endpoint it is, and maybe the version of the software.
This is already way too much and we haven't even gotten to the really interesting context, which is what customer is it? What plan are they on? What user ID?
There's nothing in here yet about your business outcome.
And so, In this sort of world, context is really expensive.
And you've had, I'm sure you've had conversations around should we measure this or not?
Right?
Contrast that to a situation where sort of traces and sort of events are the fundamental sort of thing that you build on. And your costs are the total number of events that you want to create times your sampling factor.
And the great thing about sampling factor is it's smaller than one.
So your bill gets smaller.
What you can do is you can give up complete accuracy for a lower cost. And you can decide what amount of sort of accuracy you're willing to give up for a lower cost. Right.
And so when we're talking about sampling, There are sort of two big sort of forms of sampling.
You've got head sampling, which is sampling where before you start a trace, you decide whether or not you're going to sample this.
And then there's tail sampling, which is after you've done - you've finished your request or you've finished whatever operation you're doing, Once you've collected all of the information, then you make a sampling decision.
Now, they're not mutually exclusive, lots of customers that use both.
The trade-off is head sampling, really easy to do, but you have very little context when you're making that decision. Tail sampling, super powerful, I have all the context that I need to make the perfect sampling decision. I just need to have somewhere where I can temporarily store and buffer like an entire trace worth. So it involves running some kind of sort of application somewhere.
Again, neither is good or bad, but they're different trade-offs. And so when we're talking about sampling, do you really need to hold on to all the requests that went well?
Probably not. Probably throw away half of them, two-thirds, 90%. Right? But I want to keep all of my errors, right? And that's something that's sort of tail sampling, for example, is really good at. It's going like, save all of the entire request flows that had an error in them and send through 10% or 2% of everything that went well.
So you now have full control over your costs.
And because these are events, you can put any amount of context in them.
So context is basically free now.
The thing that we really want is now basically free.
This gets me to the sort of second bit is now what?
Now that sampling is context is free, what do we want to sample or what do we want to sort of collect and how are we going to use that in our sort of telemetry going forward?
And whenever I'm asked what the best book you can read as a software developer to get better at software development, it's this book, the Personal MBA.
And the reason that is is that knowing how organizations sort of make and use money is critical in sort of delivering, in helping you figure out what to deliver and how and when to whom. How does the company sort of make money? Right? So.
How are we going to do that? As I mentioned, Maia sort of spoiled them sort of already. But there's three ways that companies can make money.
And again, to - making money is never the purpose of an organization.
But there are very few organizations that can survive with no money at all. Right?
You need at least one Google account for your email. Right?
And so what we're going to do is we're going to go through and start to think about what are things that we can measure given that these are the ways that we make money.
It very much depends on what kind of organization you're in.
So to start with the most obvious one, the one that we're most familiar with is protecting existing revenue.
This could take multiple sort of forms. I called it managing risk because that's what it is.
We have an existing sort of business, an existing business model and it's making us a lot of money.
How do we not fuck this up?
Right? So in here is to think about, like, what's your one job? What's your one, what's the one job that you get paid for?
If you're in financial or healthcare, like compliance is a big thing. How do I get this regulator off my back?
And the last one, like preventing outages, right?
So yeah, so for example, at Honeycomb, we do two things, right? We take your telemetry, and we make it available to query. So that's what we got sort of SLOs on service level objectives is what we use to sort of monitor.
We can't take more than if we take more than five milliseconds on average to process your event too many times, someone gets paged out of bed. If your queries are too slow, for too long, for too many users, someone gets paged out of bed.
Working with companies on the sort of preventing outages side of things to go, "hey, before we go from your Canary deployment, to your full rollout, let's sort of automatically compare the errors and sort of other performance indicators of your Canary deployment versus your production deployment, right, before we sort of go live." And so, yeah, what's your one job? The next one is reducing cost, the right way.
And this is not - the right way, is not taking away the free fruit during lunch.
Right? Which is an actual honest to God cost cutting measure I've seen in a company I worked for. We're not going to... or maybe they limit it to one banana per person. That was - it was a while ago.
Right, like it's that sort of like, that's Dutch dumb shit, right? If you want to reduce cost meaningfully, there's two ways to do this.
There's the CACs and there's the COGS.
CAC is the cost, the customer acquisition cost.
What does it cost us to acquire a new customer?
Right? How can we bring that down?
How can we spend less money on acquiring new customers?
And COGS is cost of goods sold.
If I sell you $50 headphones and it cost me 30 dollars for the set of components and another 10 to put them together. That's $40 in cost of goods sold.
And so that's what you can work to - that unit cost, bring that unit cost down.
For us at Honeycomb, for example, for some of your queries, we will spin up a few dozen Lambdas to get stuff from S3, process it, and then send it to you. And that's a major cost in our sort of querying. So we want to keep track. And so every Lambda invocation basically has a dollar amount in the event telemetry data that gets sent to our dog food environment, which is actually called dog food, which is one of those funny things.
But yeah, dog food we can query - exactly how much we spend on our Lambdas, by customer.
And so we have a few very large financial institutions as customers that sort of create a massive amount of queries that happen to hit these sort of query paths a lot - they span a lot of lambdas and they have a lot of data. So that costs us a lot of money. And so we actively sort of keep track of that and find ways to optimize it.
It's not our main source of things we work on day to day, because again, this is mostly for much more mature sort of larger organizations. But you want to keep an eye on it.
And now, the favorite bits.
How do we get more revenue? This is every sort of small to medium business. We want to, the best way for us to get more money in is to get more money in.
And David McLure, ex-startup founder, investor, came up with the sort of R acronym, which of course meant that the whole thing became pirate metrics very quickly. But they're a great way for you to think about the user journey and the points on which you and your software impacts that user journey.
So the first A is for acquisition.
And again, this depends very much on sort of what your organization does.
Honeycomb, business to business SaaS, a lot of our - the things that we do is salespeople, larger organizations, and we do enterprise trials.
We have telemetry that goes, if we rate limit someone that's on an enterprise trial, we will send out a slack notification to the channel where all of our solution architects that work with these kind of customers in and report it.
We don't do this for all of our customers because our regular customers know the drill and they know what's going on. But for our trials, they might not know they're being rate limited. So we're actively working with them to help them sort of shape their telemetry.
Maybe you're an e-commerce site and this is all about your core web vitals.
Of not your account page, because no one cares about that, but what are the core vitals on your product pages? On your homepage?
What are those doing on that path of acquiring a customer?
Next one is activation. And activation is a fun one and it's not as obvious. But what it means is the - how do we know that a user that we've gotten has gone from a regular user to someone who's going to stick around.
The typical example, for example, in this case is like Facebook. Facebook at one point realized that if you have more than seven friends on Facebook, you're hooked. And they got you for life.
Well, until they fucked that up. But.
That's an entirely different story. But yeah, like, what are those things that distinguish an okay user or an okay customer from a great customer? Right?
Maybe this is the sign up flow after you've sold them something, like, create an account, sign up to our email letters, or for us, it is around service level objectives.
Once you've created set of service level objectives in Honeycomb and sort of use them and sort of know what they are, you've leveled up, right? You've gotten all the value, you've gotten the most value out of using Honeycomb.
And that's sort of what we're sort of measuring.
How many people are trying this? Are they succeeding?
Does that work? Like your sign-up page, right, is one of those things where it's not accessible.
Right? That's the stuff that you want to catch in these two sorts of things is how do we get new customers in? Does that flow work? Does that flow work for everyone?
Right. Retention. How do we keep people?
How do we prevent people from leaving?
And this is again, what's your one job?
What are you doing that is useful?
Do you deliver value?
And again, there's a lot of stuff we do here internally with how many users does a customer have that uses honeycomb regularly? Again, these are things that we look at regularly in our set of customers look at. So we don't just care that you are a customer now, we care whether you get value, you continue to get value out of this. So that we're not surprised when a year from now, you go on, ah, it turns out no one's actually used you and we're just gonna leave. So that's that sort of retention.
How do you know your customers are getting value out of this? And again, that changes from the business end, but I want you to think about is: How are we going to measure what people are doing on our platform and are they getting value out of this? Referrals is very much like how do I get, how do my, how do enable my existing customers to help me attract new customers.
And so this might be sharing.
We have a large sort of news company, one of our clients that I work with a lot. And so for them, it's a lot about how do we have people share articles around? And so I don't just care that my API endpoints are doing well.
But tracking whether people are clicking on the share link and checking where people are actually coming in via the share link, those are super important things to know specifically.
Right. And lastly is revenue.
You'd be surprised - or maybe not, because you write software for a living - how many times people can't pay.
Like, I would like to give you money, but I can't. I can't pay for the thing.
And so again, check those flows. Are they working?
Are people having a good time of paying for this?
Are people going to drop out? If you're running an e-commerce platform, what are my abandoned carts look like?
Abandoned carts are one of those sort of amazing things where people spend all this time looking for stuff and adding them to their cart and then not pay. Like, what happened?
Couldn't they pay? Didn't they want to pay? Like, how do we follow up on that? And so what I want you to start thinking about is not so much about like 'observability is about making sure our servers are happy.' There's no correlation between your servers being happy and your customers and your users being happy.
And that's what's going to be important. Well, it was always going to be important, but it's definitely going to be more important now.
Thank you very much.
Traditional metrics and logs are decent at telling us if our servers are happy, but generally do a pretty poor job of telling us how our users (and by extension, our business) is doing.
But the state of the art has moved on significantly and with a unified data strategy focused on wide structured events and traces can give you insights not just into how your servers are doing, but also how your users are experiencing your services and thus how your business is doing.