Teaching Agents about Performance insights
Framing the Challenge: AI Agents and Web Performance
The host introduces Vinicius Delacqua, situates his background at Gillian and Spotify, and connects this talk to earlier sessions that cautioned about AI’s impact on accessibility and performance. The introduction frames the central theme: improving how our code communicates with LLMs and agents so they can produce better, safer results. This sets expectations for a pragmatic, performance-focused exploration of AI in developer tooling. The audience is primed for demonstrations and concrete techniques that make agents more effective.
Introducing the Companion Tool: A DevTools Fork for Insight
Vinicius polls the audience’s experience levels, then introduces a fork of Chrome DevTools that reads trace files and returns performance insights in two phases—metadata first, then call-trace analysis. He positions it as a “companion” that aids understanding rather than automating changes outright. Vinicius previews later experiments with more autonomous debugging via MCP and v0, setting up a contrast between assistive and automated modes. This segment establishes the tool’s purpose within the talk’s theme of guiding agents with better context.
Demonstrating Context-Guided INP Analysis and Handoff
Vinicius demonstrates a workflow that combines Cursor, a Bitmaker demo app, and a customized Chrome instance with an MCP hack to analyze INP. He records a throttled session (~500 ms INP), uses DevTools to extract INP insights (473 ms attribution), and forwards those findings to a v0 chat as instructions to fix the issue. He narrates real-world demo friction and shows how a specialized performance agent can “teach” a general agent what to look for. This live handoff exemplifies the talk’s core idea: give agents precise, performance-aware context to get actionable results.
Motivating Perflab: Speed vs. Quality in the Age of AI
Vinicius argues that while AI increases integration speed and lines of code, it often bloats PRs and introduces bugs that harm user experience. He introduces Perflab, his side project to optimize workflows and embed performance intelligence into the development loop. He also notes emerging LLM metrics like tokens per second and time to first token, drawing parallels to web performance jargon. This segment grounds the need for more intentional, quality-focused use of AI in performance engineering.
Visualizing Complexity: From Raw Telemetry to Usable Signals
Reflecting on DevTools internals, Vinicius highlights the craft of turning raw telemetry into meaningful visuals and insights. He praises recent Chrome improvements—especially annotations and Ask AI—for lowering the barrier to extracting performance insights from traces. The segment underscores a core tension: experts can parse dense data, but average teams struggle without better abstractions. This motivates his goal to simplify the path from trace data to decisions.
Simplifying the Interface: Generative UI for Performance Signals
Vinicius shows a minimal, signal-first panel—built on his DevTools fork—that surfaces key metrics like animation frames without overwhelming users. He describes generating UI elements on demand so the interface grows only as needed, reducing cognitive load. He explains why LLMs struggle with performance traces: the data is complex, specialized, and not part of general training. This leads to the central tactic of the talk—treat context as a first-class design constraint when involving agents.
Decoding Trace Files: INP Attribution, Nested Events, and Context Limits
Vinicius unpacks the structure of trace JSON and the pitfalls it creates for LLMs: huge input sizes, hidden meaning, and nested event hierarchies that tempt hallucinations. He walks through INP’s anatomy, emphasizing animation frame sequences and initiator events that influence later call stacks across time. He explains how these patterns stress context windows and degrade model quality as inputs grow. This segment clarifies why naive “dump the trace into the model” approaches fail.
Segmenting the Problem: From ML Ambitions to Practical Constraints
After exploring ML architectures (e.g., attention over hierarchical time series) for anomaly detection, Vinicius chooses practicality over bespoke modeling. He reframes the task like a performance engineer would: combine domain knowledge with targeted telemetry to guide analysis and fixes. He discusses limits of large context windows and why RAG underperforms on non-semantic, structured trace data. The takeaway is a pragmatic design: narrow objectives, segment inputs, and keep the context lean.
Designing a Router of Experts: Trace Engine + Specialized Agents
Vinicius details how he leverages DevTools’ trace engine to transform raw traces into structured outputs, then uses internal Ask AI parsing to make that output model-ready. He implements a “router” agent inspired by mixture-of-experts to dispatch requests to specialized sub-agents focused on specific telemetry. This reduces reliance on giant system prompts and keeps each task’s context tight. The result is a modular, interpretable pipeline that mirrors how DevTools itself segments insight gathering.
Orchestrating with MCP and Delivering Results
Vinicius explains how MCP expands capabilities by connecting tools like DevTools and Sentry, but warns that each tool competes for limited context and attention. He shares “context engineering” tactics to steer an orchestrating agent: define narrow goals, keep sessions structured, and delegate planning/research to sub-agents that produce artifacts the main agent can use. Returning to the demo, he shows a successful outcome—reducing INP from ~512 ms to 29 ms—attributing the improvement to precise insight extraction and careful agent steering. This closes the loop on the talk’s theme: better context enables agents to deliver meaningful performance gains.
Q&A: Applying, Learning, and Adoption in the Real World
In conversation with the host, Vinicius describes work experiments that captured autonomous agents’ planning, research, and code changes as artifacts, concluding that fully autonomous coding remains limited without strong guidance. He advocates using agents for scoped tasks and research while maintaining human responsibility for design and code quality. The discussion touches on learning benefits, lowering barriers for varied experience levels, and balancing hype with the real complexity of this space. Vinicius closes by emphasizing experimentation, augmentation over replacement, and “trust but verify” as operating principles.
So Vinicius comes to us from Sweden. Well, from Brazil by way of Sweden, I guess. But you've been in Sweden for many years. 10 years now. In a town that I can't pronounce, which is Stockholm.
Oh, which is Stockholm. So I feel like I could have taken a swing at that, actually.
Thank you. There's that sarcastic applause at the back. Sarcastic applause.
Okay. All right. All right. Well, there we go. We're learning something together.
Working as a front end engineer. Front end lead, rather, at Gillian.
Doing lots of work on developing systems and developing tooling there in that. Because I'm gonna. Also was an engineer at Spotify in a previous life. And I'm really pleased that this. This talk kind of lands where it does in the. In the program, because the very start of the day, we had Tim talking about a whole host of things, but was kind of calling out some of the cautionary tale of how we're kind of using AI and agents within our development and the impacts that could potentially have on accessibility and performance and how there's still a little bit of work to do there. Also, yesterday we had a talk from Uma who showed us various things in DevTools. Certainly for me, it was the first time I'd actually noticed that AI was cropping up in dev tools as well. And we're able actually to make use of that right within the dev tools. So it kind of feels fitting that now we're getting to a point that we're having a talk where we're, you know, we're looking at, how can we give better hinting to these tools? How can we do a better job of communicating between, you know, our code and LLMs and making sure that agents are able to do the best possible job in the best possible way for us. So I think we're gonna cover a little bit of that today. So are you plugged in? Are you happy? You ready?
Ready to go. A massive round of applause, I think, please, for Vinicius Delacqua.
Thank you for the very kind introduction.
Before we get into the nitty gritty, let me get a little bit of an idea of the audience. So how many of you here are having your first birth? Now raise your hands. That's fantastic. Great. Okay, how many of you are within your first to third year in the industry? We have a few.
That's good. That's good. And between three and five.
All right, goody. Well, then I guess this talk will have really good broad spectrum for everyone.
Before I actually get into the demo, let's See, I'm just making sure I'm on the right window. So I have created this tool here, which is a fork of dev tools under the hood. And the idea is that it will read a trace file and based on it I can get insights. Very straightforward as a proposition, but with a few challenges, which is how to get data out of a trace file. So right now it's reading the trace, it's forwarding information to the agent, and hopefully it will start getting insights. So it has kind of like two phases for this one.
It will get a bit of an insight on everything that it sees according to just metadata and whatnot. And it will start reading the actual call trace, seeing how it might be able to optimize different aspects of this application. So let's see if it generates that. Still going.
There you go. So it will try to give you a bit of an introspection on how can you improve your application, but it's meant to be like a companion more than something that will automate things at this stage. But the idea is that it will try to help you out to understand performance does not matter what experience level you have. Later in the year, I ended up trying a bit more autonomous, a bit of spoiler, I guess. I ended up trying a bit more autonomous debugging sessions with AI. So using MCP.
So I created MCP server for V0. How many of you have used V0?
Or a few? So it's lovable, okay, Replit, etc. So it so basically just like hooking up V0 with another agent to create code and hooking up that same agent with an MCP server.
As you can see, v0 is not that great with interactions because it generates a REACT application that's not that great, not that well built. But using some form of autonomous debugging sessions, it can actually be steered to deliver something better.
So the proposition here, back to the talk, is that we can get a bit more autonomy on that workflow. So my name is Vinicius and I'm a software engineer. I have been in the industry for about 17 years now. I've been here on the first perf now and you know, it's so great to be here now talking and. Yeah, I know, I know what you're thinking.
AI is kind of everywhere now and everyone is shipping features with AI and we are kind of like being forced to use it. But very few of those systems can handle the complexity and the reality of performance data and any kind of like complex performance data. So let me see if I Can have another little demo here.
So let's try and get this done. So I have Cursor here. Let me push cursor to this side. There you go.
So I have cursor here and what I'm going to do is I'm going to ask cursor about my visitor session.
So let's Fetch My last three chats from V0.
So let's see. And the whole thing is I have some sessions here that I already run. That's what you saw.
So hopefully it will be fast enough. There you go. Last three chats. I have this one here that I generated a while ago. The whole point of this one, let's see if we open on the right window is it did not. So the whole point of that is that it will or should get a bitmaker app, which you kind of saw.
So let's see here. There you go.
So just like a demo, bitmaker.
So nothing too special. I am going to run again just so you can see that this is as real as it gets. So 4X Slowdown is a powerful MacBook.
There you go, Click, click, click, stop.
A little less interactions, but it should give you a Fairly good example. So 500 milliseconds. The concept here now is that. Let's see. There you go.
Let's see what can it do on using agents that are specialized for tasks to get something better out of it. So we already know that this is not the best performing out there, but maybe it can be a bit better.
So right here I have an instance of Chrome with a little hack that I added here. So I built inside. We have now the official DevTools MCP, but this one of mine is a hack that I did, highly optimized for something called context engine engineering. We're going to get into that. So I kick off the MCP server, I'm going to open a trace. So let's get that trace that I just generated.
Okay, there you go. Let's get the trace here. I'm going to download it because one of the things that because it's very hacky, somehow my INP metrics get very skewed on this particular instance.
So I'm going to open the trace here. There you go.
And I'm going to also open the URL just so we can have the same reference. There you go.
So right now what I'm going to do is I'm going to copy the similar prompt that I have run earlier just because there is a bit of finicking with prompts sometimes. So There you go. Fetch my last. I'm going to run the same. There you go.
So basically this prompt here, how good is it?
Okay, let me just increase it a little bit. So just stop.
No, I don't need to stop profiling. This is actually something I ran with the official. So let's gather the insights for INP from DevTools and see how we are doing. Let's see.
So basically now it will just reach out to my instance of Chrome, gather the insights and you're going to see that what it gives you is something that is not very orthodox for most of you right now. So it's going to try to record the trace. I'm going to stop it here.
Just. I already have a trace. Just get the insights.
So this is why we don't do demos.
Alright, so now it's getting the insight. Good.
And the next thing it will return to me is just what it sees on that insight. So this is also a bit outdated because the Chrome team has changed a little bit the format of this. But the idea of this is that my agent, external agent, is specialized in performance and it will teach this agent, which is general agent, it doesn't know about performance data, it doesn't know anything about performance, it barely knows anything about coding itself and it would try to teach it what kind of things to look for. So in here it gets a little bit of a preamble on how to identify the data I'm handing and also trying to teach it how to consider the data, how to think about it and what kind of insights to look for.
So I'm going to skip because the call stack is a bit long.
There you go. So if I can scroll there. Okay, good. So right now it's telling me exactly what it saw. I have a 473 milliseconds on INP. The attribution data is such and such. So this is the information it's seen. Right.
So let me see if I referred. Okay, so find three chats. I'm going to just make sure I'm referring to the correct chat. Here we go.
So now forward this insight to V0 Chat ID this and ask it to fix based on what you seen. So now this is going to take a while because code generation is very, very slow. So let's go back here for a sec.
But AI kind of everywhere we've seen it.
I'm not the first one to tell you. And one of the greatest promises that we have with AI and coding agents is speed of integration. And we have seen that the number of lines of code have been dramatically increased. The PRs are getting larger, we see a lot more dead code. In consequence, we see a lot more bugs.
Because iterating faster doesn't necessarily mean we are getting better quality out of things. The experience that we are delivering to our users is not necessarily the better ones.
Unfortunately, if that is the case, it means that we are not really contributing to a better experience, to a better web for our users. And that's kind of why I started investing time and exploring and experimenting with building PERF Lab, which is a side project of mine.
Try to understand how to optimize workflows and how to build intelligence towards performance, which is my passion. So this session here is a deep dive on this story of mine and we'll explore hopefully a bit of practical lessons that I've learned along the way whilst digging very deep into the DevTools internals and how to communicate with agents, teaching LLMs how to interpret performance data, what matters most, and how to transform telemetry data into actionable insights.
Now, before we begin, let me just share a little bit of some amusing bits of information in regards to this side of the talk, which is the AI parts. We do have some metrics that are beginning to get established within the AI circle to try and measure performance for that stuff. So for LLM inference, we kind of hear nowadays something called tokens per second tps and we have time to first token very similar to tfb. So we are not the only industry that loves their acronyms.
But this talk is scoped so we can peek behind the curtain. And as an engineer obsessed with performance, how did I end up building my own sort of performance engineer, AI performance engineer and get a deep dive into what kind of things can we learn and how can we understand the telemetry that's gathered by DevTools as well as understand how to use data in an AI circle? This has been my hyper focus for over a year and a half now.
So buckle up, it's going to be a wild ride.
Anyone here is familiar with the contents on this box, raise your hands.
Yeah, there you go. How about now?
All right, so it's a bit more familiar for you, but they are the same thing.
Just one is the backend sort of thing.
So after digging deep into the source code from DevTools, I start really appreciating the art of data visualization. Because when you go from here to here, like there is a lot of things in between to build meaningful visualizations out of variables, data, and there is A hidden layer of complexity in there. That journey kind of is what shaped how I feel and think about utilizing data nowadays in general, not just for AI. So transforming verbose information, verbose visualizations and data into insights, it's a very hard task and I feel like the DevTools is doing a phenomenal job at it.
There's so much effort involved with transforming raw data into visuals and information.
I feel like in a way this is the job of everyone here as a performance engineer or aspiring performance engineer.
And it's a bit skewed within the audience because we possibly have the most apt minds in this audience for the task at hand to interpret information such as that and transform into insights.
But if you have been around for long enough, especially you realize that the average developer struggles, development teams on the average company struggles to understand what to do with that kind of information. And to some what should be information becomes noise and extracting sites becomes quite hard of a task.
So for those who have been keeping up with the updates, Barry just shared a great handful of those, thank you very much.
The Chrome team has been on an absolute roll and we have seen great amount of improvement with simplification how the team is simplifying this task of obtaining information out of the performance panel and the other panels as well. So I'm very, very happy to see that with my favorite feature annotations of all time. I love it to the ask AI features as well to help people extract insights, developers extract insights out of trace files.
So the barrier to entry is becoming progressively lower and the devtools is becoming increasingly easier to use thanks to those efforts, by the way. Shout out to jaisaling.
So for quite a while now, much of my personal time and my personal objective, pretty much everywhere I work has been around facilitating performance work at different companies. So setting up pipelines, tooling. But ultimately what tends to happen is that those initiatives tend to fall short due to the imbalance on signal to noise ratio when it comes to dashboards and tooling to developer and development tools, how they approach those tools. So the value is unfortunately cut short.
So one of my recurring observations around trying to implement initiatives, performance initiatives in different companies has been around the insight to confusion ratio. So on one side you have people that understand the data or the value about it, and the other side is you have people that is either forced to look at it or just don't understand it at all, which becomes just noise.
So this is kind of what led me to experiment and play around with building this performance agent in perflab in general. So perflab is the initial draft of it, let's say, which was a fork of the path performance panel itself.
So after I experimented with that initial fork, I ended up venturing into creating the agent and the purpose was to experiment with new forms of interactions with the UI and the data that of devtool is so trying to think about how to render UI based on context first of all. So generative UI and how to figure out how to extract information out of the trace files and generate insights and detect problems autonomously.
Speaking of, let's see if we already with the run here before we move on still running. See it takes So the core goal of generating that interface was to simplify the UI and reduce the barrier for entry to developer and development teams of any expertise level. So the thought process was how much can I remove or at least hide away in abstract whilst still keeping it sort of performance related, devtools related. So that's why I created this little panel here which is shown here. So if I close this guy. So this little panel here and the point of this panel is just to show you some signals. So yeah, hey, I'm still a devtool sort of thing. I have this histogram based on animation frames which I absolutely love. Animation frames is a great API and loaf also great, which I agree how much of an UI I need to use or rather to abstract away.
So let's Obama, let's see if I can can remove this.
Okay, back to it.
All right, here we go.
So yeah, the whole point was how much of it can I abstract away and still keep it related to dev tools to performance whilst maintaining those goals. Also to explore with generative UI as I mentioned as you saw bits of UI being generated over time because I noticed that building for agents or with agents means that less of the UI is needed up front, which enables the interface to become as rich as it needs to, so we don't have to clutter the UI with information upfront based on what the user might need, but instead just generate as it's needed.
Similarly to how performance is a very difficult vertical, very steep vertical for developers to learn and get into. Performance data is a very difficult data set and not something that LLMs are known for to be good at.
So they lack analytical capabilities and deep insights into the data and knowledge necessary to give you actual actionable points and results from it.
So maybe you are like me before I embarked on this journey, thought that LLMs are very good at extracting any kind of information out of text based content or data. And though that's partly true, LLMs are not good at extracting meaning and insights out of data that they don't have context or lack training on.
So for that, let's think of the word context as your primary concern when dealing with LLMs or agents.
And if we're trying to extract insights out of a trace file, we have to overcome the problem that it contains a vast amount of telemetry data that can be used for all sorts of different insights, as you see when you use the Performance panel, which at this point in time LLMs are just not really trained on.
We have here two different visualizations as an example, I guess for how much you can show different types of data visualizations based on the exact same information coming from the trace. So on the left of course is the flame graph and on the right is the panel that I was showing.
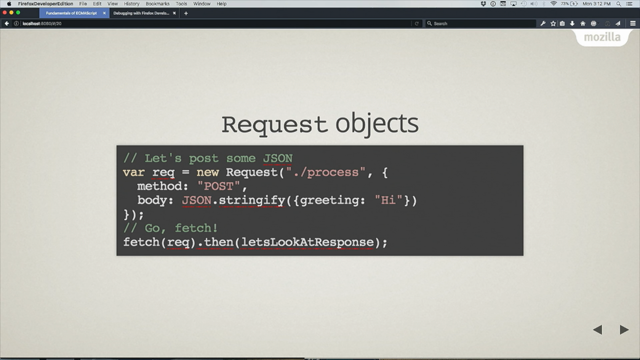
But previous knowledge aside, handling that amount of data is a very complex problem to solve when building agents. So this doc, very early on my journey I was asking around on Twitter, it's about three years ago and Paul Irish very kindly sent me a link to this doc and immediately I noticed that it's from December 2016, last updated.
But within this document there's all the things one needs to initially grasp out of that trace file.
So first you have the length of the JSON file you have normally when you generate a trace that you wouldn't need to make available for the agent trace file contains a large amount of events that represents all sorts of things captured during the trace recording from interactions and other events that represent clicks or what have you. They contain all sorts of different attributes that increases the total size of the input you would have to give, but also and your LLM would have to read and assess, but they also have hidden meaning for the most part. And you know with this you would increase the usage, let's say of the context window, which which is why most LLMs or rather AI tools have gauges to help you understand how much of the context window is being shown.
So you might have seen something like this bit here, this comes from cursor, but every ID has something similar if you are on the agent mode. And the second problem, as I was mentioning, you have a lot of hidden meaning within that large JSON file. You have a lot of hidden meaning that the underlying LLM would be very, very happy to try and guess what it means based on previous training or what have you and get very confidently wrong and start hallucinating things. So some entries would represent nested events, adding complexity because you now have to analyze not just the individual single event you are facing, but also all the grouping of events between beginning and end, which adds even more complexity when analyzing the data. So this image here, it shows an interaction event which is responsible for an INP score. And you see that is a very, very particularly slow INP metric.
And I mean we can see the underlying metric.
So behind this, as you've seen earlier on the slides, there's a lot of events within the trace file. And for this particular part on INP and low app you have something called animation frames which is what drives it. And again it's a nested event, has a beginning event, a lot of events in between and an end event. And this is one of the complex parts within analyzing a trace file and trying to hand data to an AI from traces because you have to understand the entire series and different parts in time.
That is one of the things that is a problem as well. But also when analyzing a specific call frame, you might stumble upon this, which is highlighted here, which is an initiator event that will later on be the reason for some other frame being added into a call stack.
In this case, for instance, this little event is in the input delay. So previous animation frame that adds attribution data to the presentation delay because it is what initiates a call frame in the presentation delay. So it's entirely disconnected when it comes to the call stack and is spread around the time series. So I spent a very good amount of time earlier on my research investigating different model architectures that could fit a custom pipeline to perform prediction on anomaly detection for the data represented in trace files. So I was trying to go as deep into the ML parts and what have you. So from different model architectures such as graph attention networks to something called power former and beyond, I was trying to find the best fit because the trace file is not only a time series, but it also is highly hierarchical and spread around time.
But since this is like a side project of mine that I was doing happily until 2am Pretty much every day, I had to be a bit very self critical and work with something that's readily available. Instead of trying to reinvent my own way of handling traces and building my own models, I'll try to keep the learnings as close to the workflows within performance. So let's get back to perf.
So how do you take a trace file and help an agent understand the telemetry information within it?
We saw a little bit on the demo earlier we skimmed through it and how do you go about using that data and observing the limitations mentioned earlier with gear modules available models available, because even the largest models have a limited amount of context window that you can use. And generally it's true that the more things you put in the context window, the worse the model will perform.
So you have to be keeping very, very strict on that matter.
So I guess that's the right person who said this.
Let's bring the talk back a bit to the human side.
So as everyone here in the audience, let's think about the role of a performance engineer in a very, very abstract and oversimplified terms. The role of a performance engineer is to analyze telemetry data, build insights on top of it, and report back with the findings and possible fixes.
So hopefully the specialized engineer will also be responsible for being part of the fixes itself. So it's in a clause or iteration loop and can make sure that it's aligned to the original object. But there is two sides of the problem here. One is the knowledge and the other is the actual data present. So the quality of both are needed in order to solve this problem successfully.
So as a performance engineer, one will manage to trace, analyze and fix performance issues based on contextual framing of knowledge against telemetry data.
So this kind of reasoning is what I used in the most possible rudimentary possible way to abstract into how I think about an agent that is responsible to try and fix performance problems. So back a little bit to the AI parts.
The thing about working with agents is that the problem is the limited amount of information can fit into the problems. And also the way attention mechanism works different problems around remembering what's in the context, the decay of quality as it grows lost in the middle problems.
So that generally means that the more focused the context window is in one single objective, the better output you will get. So take that in consideration.
I've experimented around different ways of segmenting the trace data into different problem spaces to optimize for the problem, for the context problem and facilitate information retrieval as well.
That way I could narrow the main objective per request to one single part of the trace file, or rather you will see later of the output by the trace engine.
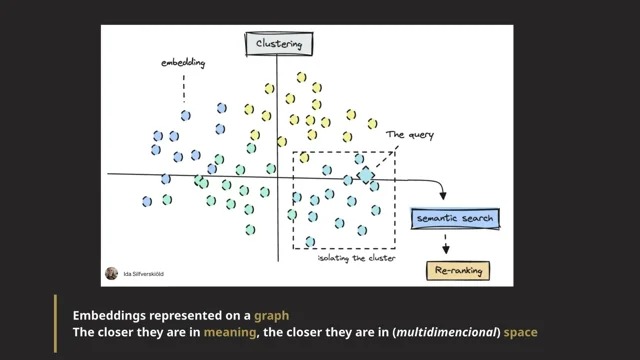
Now I could just hand the agent segments of the trace file in an ad hoc way by but if you ever research a little bit about AI, you might have stumbled upon rag or retrieve augmented generations. And the problem is that extracting meaning out of a given text or document is highly trained on top of semantical meaning and that's not really what the trace is best known for as we just briefly seen, it's kind of separate into different self problems, it's time series, it's hierarchical and so on. So remembering that, keeping that in mind, it meant that I was not entirely sure that this was a bit of the way to solve. So I kind of said it was going to be a wild ride. So that's as deep as it went. But let's take a closer look into the engine that powers the insights and all the data wrangling from the trace file, raw trace file, JSON into how we actually eventually get to see in the flame graph and of course the agents that drive the Internal parts of DevTools and the agent that I built which is the trace engine. So whilst building Perflab, one of my very earlier interactions with DevTools source code was through the trace engine. That's an internal piece of JavaScript of technology that passes the trace into a structured output of sorts that contains all different kinds of information from that trace file and segmented into subcategories of sorts. So you know, getting everything from insights to well organized network events and traces and things like that.
So that's what I started using to extract information to build my own agent based on the trace engine.
So I extracted that alongside a separate and much newer piece of DevTools internals which has to do with internal ASKAI bits, that has to do with parsing the trace JSON into more digestible, let's say, bit of information for the context window to be used. So this way I could better classify the trace file into a well structured form format to be ready to be used by the agents that I wanted to build. But that left me with a problem. Now I have an object in memory and I needed my own agent to know what part of it to use according to the user request.
So that is the next problem that I ended up borrowing from yet another model architecture.
At this point in time I was reading about mixture of experts or moe and it aims to comprise a large amount of information segmented on different sub networks of agents.
So it's just basically instead of one single, think of like anthropomorphizing it a little bit. Instead of one single expert, it has many experts but there is a router in front. So this router was where I drew inspiration from.
So what I ended up doing is that I codified a router small agent that analyzes the incoming request and tries to identify what am I trying to solve and then it will fire the specialized agents that I coded to deal with specific problems present within the subset of metadata or data that I could collect from from the output from the trace engine. So yeah, so that's the bit of information I started playing around with different libraries and frameworks early on how to set up the best way to code this, but eventually landed on this combination of AI, SDK and master. Mostly because especially earlier in the days, it was very hard to rely on the agentic loop, let's say, to find out what's best to call. And then I ended up having to add a very large system prompt to ground it into objectives. And as I mentioned earlier, that's a problem because the context usage and so what have you. So with that router in front having workflows that calls different agents you, it was a much, much easier way to think about and structure the code base. And also helped me onto how to segment the problem itself into different smaller regions.
Now we need to dig a little bit deeper into how to use those learnings, into how to potentially maximize the outcome for our workflows for performance with a AI.
We briefly touched on this already, but devtools have several internal agents that are specialized into different parts of the different panels and the telemetry that it exposes as well. So it helps breaking down a larger problem into subparts that each agent is very specifically not trained to, but set as an objective to try and tackle. In a certain extent, this is kind of what happens when you hook up to the MCP DevTools MCP, the official one where it will end up calling the different specialized agents to gather the different insights. Which brings us to the next topic, which is how to use MCP in order to extract specialized performance insights. So by now I believe most of you have at least heard of MCP or model Context Protocol, so we can skip that. But this adds at the same time that it adds a layer of possibility, it also adds a layer of complexity because at the same time that the agents can now work as an orchestrator and call specialized agents or APIs and resources to execute much more complex tasks, it also has a problem where those tools coming from the MCP also compete for the context window and attention. So it's a very hard problem to balance and it might lead to the death of a thousand cuts for your context window and the quality of your agents. So with MCP we can, we can connect different tools such as dev tools and sentry. We've seen it briefly, but. Did I just scroll this? Okay, I screwed up that one.
But my own experiments with this, as you see there, we can check it out if it is finished generating and see the outcome of it. But in my own experience, having this sort of loop, it can enable some very interesting patterns. But of course the mileage might vary because it's not as simple as just prompting. You have to steer it like that MCP setup that you've seen is something that I hacked myself to be very specialized, highly optimized for context engineering.
So it's a bit more advanced technique and it's meant to help guiding the orchestrating agent to understand what data is seeing, what should it do and you know, better output in the end. So it's a similar thing that I just showed you earlier. I was able to reduce significantly an IAM P iteration from this. But now that we have gotten some background on that, let's look into how can we effectively use this to help us think about how to use LLMs when using AI. So when using AI tools and agents, we you should think that it's important to narrow your task to a concise and very clear objective. And that helps tremendously to set the agent to success.
So keep in mind how you steer the agent, what kind of things you would have in the context, Things that should be always kept in consideration is keep your session very focused and well structured. Delegate the research and planning to sub agents and use those to generate different artifacts that your main orchestrating agent will use to steer the outcome.
But utilizing AI tools can bring new capabilities and help us iterate over tasks fast. But similarly to any tool out there, there is a number of constraints and techniques to be learned and considered when utilizing them. So the more I research and the more I build things with AI, the more I understand that we are the key factor on what can we build with it and the outcome it does give us. So it needs a considerable amount of effort and alignment to help us achieve better qualities. Not as simple as just prompt your way into success.
So we should use those tools very mindfully and appropriately. So I believe that tools like this can help us augment and speed up or even expand capabilities.
But this is an opportunity for us to experiment with new interesting ways to build and also new interesting ways to interact with things. But we are still the ones responsible for the that things things we ship. So we should be very aware because we in AI there is something called human in the loop. And we are the humans in the loop. We should be very, very responsible with how we ship code utilizing this. So trust but verify Always.
So let's see if I am done with this generation. Where is that? That's the code. Where is the code? There you go. Oh yay, it's done. So get the demo URL for new version. So let's see if it will give me any updates. So this low part here was really, you know, v0 generating code because it generates literally if you think like the node modules, dependencies is deep. You've never seen generations by AI. So there to go. Let's take a look. So let's see. I guess. Okay, before we go there, before we go there, we came from 512 milliseconds and where did we land? Mind you, it might have been absolutely botched. So let's see, we never know.
I have gotten very good success with this, but you never know. So let's just make sure that we are still throttled. Yes.
So it's the same. I'm going to start the tracing, going to click around and it seems to work still. That's a good sign.
You never know. I saw 29, it's pretty good improvement. And the key really is on how you steer the agent. So the kind of data you inform the agent, how you help the agent think about a certain problem, what kind of data you expose to the agent and how to interpret that data. So this is the key to the kingdom really when handling this kind of complex problems and AI in general. And now. Yes.
Thank you.
Great stuff. Thank you so much. Would you take a seat? Shall we chat for a mo? Absolutely. Excellent.
Well, it's fascinating to see that and it's very gratifying to see a result at the end that was where you wanted it to be.
I'm always very impressed when anyone is prepared to do a live demo, particularly when it could be a high wire act. Right. But you just, you seem very confident. Prepare for the risk, you would say. Yeah, exactly, exactly. So, so, okay, so we do have some questions and I'm also just curious about. I mean you're showing this as a demonstration example, you're showing some of the techniques and the kind of experiments we can do. But I'm also just curious about how you're using it at work right now. I mean, is this something that you are exploring with the view to putting into practice at work or is it an active use where you're working at the moment? I'm kind of curious about that. Could you speak a tiny bit about that? Yes. So I have several different experiences with this. So earlier in the summer, in order to arrive at that experiment with dev tools that I created my own MCP server on it. I kind of went full like Jesus, take the wheel mode.
So I just went that expression before. If you're going to have people completely blindly trusting AI to generate code, let's see how, how it goes. Right. And the only way to understand it is to leave it. So I, I went very forensically about it. So I asked for every step of the way to get a pick in the brain. So there is a planning step, there is a research step, there is the actual proceeding with making the changes and the learnings. And for each one of the steps there are, you know, markdown files that I can use for tracing. How the AI thought, generally speaking, fully autonomous coding is still quite far without tools like, you know, like now we have the McP server from DevTools to help steer. So the way I see is that there is possibly a way to integrate smaller tasks and features to help the agent code stuff. Right. But not just the coding agent, like a side agent. We're helping to steer the quality reading, telemetry and all this kind of stuff. Yeah, yeah. I feel personally much more comfortable kind of delegating tasks and some jobs rather than purely like vibe coding from start to end. Right. Which, which I think is a very different, different thing. But I'm also curious, I mean day to day work, as you ask, like it really goes into a spectrum. Like I find myself that I prefer to go deep into the contents myself and fully understand the problem space because if I'm going to be using an AI, I am still responsible for the code. So I want to understand every single bit of the problem. So if I'm using it to help me serve some purpose, it's mostly for research. So like help me understand this bit of the code base that I have never been or haven't been to in a long time. So I know what to touch and then I mostly use like smaller inserts of code. Yeah. And that actually that goes exactly onto the next question about whether or not you think this can be just a useful tool for human learning as well. Right. As a way of discovering how to implement things and learning about techniques.
I mean that does require us to kind of be immersed in the output of this, but it feels like that's an opportunity as well. Right? Yes, I much believe on augmentation over replacement. Right. So utilizing tools like that as an assistant, a knowledge assistant, I even built a research step onto my agent because the purpose was really to try and bridge the gap of knowledge. So Give pointers on what to do, what kind of problems are happening within a trace file and how to. So you can even ask the agent, okay, now research about what you're seeing and let me know what else is to do. So there is a research step within my agent. Totally. Okay, that makes great sense. Another thing that you mentioned along the way was of like one of your. The goals here was to kind of lower the barrier to entry for developers of a whole range of experience levels. I'm really curious about how people of different experience levels take to this and whether where there's a sweet spot. Because I think some of my biases are people with a lot of experience might be a little bit cautious and stand offish, but. But on the flip side, they're probably well placed to deal with the output of this and kind of take this forward and maintain and work on code afterwards. However, people with, you know, I'm making an assumption with like less experience might be more open to trying this, but then struggle to carry it forward. In your experience, are you finding that there is an experience level which is the sweet spot for this, or are people all just happy to get started, stuck in and everything is equal, everything is so new in this. It's very hard to gauge where we're going to eventually land. There's a lot of possibilities and a lot of unrealized promises at this point in time. And I feel like there is a lot of burnout when it comes to how much hype has been built around and how simple the hype make it looks when it actually is quite complex problem to solve. But there, there is a lot of untapped experiences as well. So in a way there's a lot of exciting things that you can play around and build, but there is a big complexity barrier to be fixed yet. So as a software engineer from several years of experience, I feel like very, very happy to explore.
I'm very curious in nature. So that's why I'm just going around it and playing with it because. Experimenting, learning, getting stuck in. Yeah, it's fun to experiment. Yeah. Fantastic. Well, on that note, thank you so much for a wonderful talk and for chatting and our thanks and I hope I'm pronouncing this right from Stockholm, Vinicius Delacqua, everyone. Vinicius. One more round of applause. Thank you.
- DevTools
- AI in DevTools
- Trace File
- Metadata
- Call Trace
- MCP Server
- Chrome DevTools
- Context Engine Engineering
- INP Metrics
- Profiling
- Agent Specialization
- AI and Coding Agents
- Telemetry Data
- Tokens Per Second (TPS)
- Time to First Token (TTFT)
- DevTools Performance Panel
- Ask AI Features
- Performance Pipelines
- Performance Agent
- Animation Frames API
- Generative UI
- LLMs and Performance Data
- Context Window
- Flame Graph
- Nested Events
- Graph Attention Networks
- Power Former
- Performance Engineer Role
- Retrieve Augmented Generations (RAG)
- Trace Engine
- Mixture of Experts (MoE)
- AI SDK
- Model Context Protocol (MCP)
- DevTools MCP
- Context Engineering
- Human in the Loop
A deep‑dive into building a Performance AI assistant and agentic workflows on top of a Chrome DevTools fork. Lessons on communicating performance data to agents, which signals matter, and turning telemetry into actionable insights.