Measuring Interactions and Navigations
Setting the Stage: Core Web Vitals, Responsiveness, and Navigation
Phil introduces Michal Mockney from the Chrome team, and Michal outlines his role working on web performance timeline APIs and Core Web Vitals. Michal frames the talk around two pillars: responsiveness of interactions (INP) and loading performance of navigations (LCP). He signals a practical, measurement-focused session that connects browser internals to real-user metrics. This opening situates the audience for a deep dive into how interactions and navigations blend in modern web experiences.
Visualizing LCP Candidates and the Switch to INP
Michal demonstrates a Chrome HUD experiment that flashes green rectangles for each contentful paint that could become an LCP candidate, explaining the browser’s short-term and long-term “memory” for paints. He shows LCP updating in DevTools as candidates change and notes that after the first interaction the focus shifts from loading to responsiveness, measured by INP. Michal emphasizes that INP captures the first visible feedback, but many interactions initiate broader loading experiences that go beyond a single paint. This segment grounds the audience in how LCP and INP currently surface in tooling and where gaps still exist.
Introducing Soft Navigation Measurement: Orange Paints and Origin Trials
Michal unveils measurement for soft navigations, showing orange rectangles for contentful paints that follow same-document navigations, alongside performance timeline entries available behind feature flags and origin trials. He walks through console data that mirrors LCP-like insights for these navigations and briefly demos GitHub’s soft navigation patterns. Michal shares a naming backstory about INP with Paul Irish and the idea of a continuum (e.g., interaction-to-next-FCP/LCP) that inspired this effort. This segment marks the pivot from known metrics to new primitives that capture modern navigation flows.
Why This Matters: Closing SPA/MPA Gaps in a Transitional Web
Michal explains the long-standing demand to measure SPA-style navigations on the performance timeline and references work by Yoav Weiss and Philip Walton affirming that Web Vitals aim to be architecture-agnostic. He cautions against a JS-versus-no-JS rift, arguing that the platform and ecosystem have both evolved, and invokes Rich Harris’s “transitional apps” idea that blend fast initial loads with fast subsequent navigations and strong DX. The message: the web is shifting, and metrics must reflect user experience across architectures. This context sets up why new navigation measures are timely and necessary.
Demo Part 1: Astro—From Cross-Document to Same-Document Transitions
Michal demos an Astro site that initially performs traditional cross-document navigations, visualized by green LCP candidates per page load. With a single line to enable View Transitions, navigations switch to same-document, and the HUD turns orange to reflect soft navigations and their paints. He highlights how a tiny code change can alter RUM behavior and Core Web Vitals reporting, surprising teams who expect consistent metrics. This example shows how modern features can reshape measurement without changing site content or structure.
Demo Part 2: SPA Routers, Cross-Document Navigations, and Developer Choice
Michal repeats the experiment with a React Router demo: baseline SPA interactions don’t produce new LCP, but toggling a single router setting switches to cross-document navigations that do. He underscores that SPA versus MPA is no longer a fixed architectural divide—developers can choose navigation types per route. Michal notes that authors are actively switching strategies for varied reasons, even after years on one model. This demonstration reinforces that measurement must follow user-perceived navigations rather than framework labels.
The Transitional Era: SPA and MPA Innovations and Why RUM Matters
Michal surveys improvements that make same-document navigations compelling (e.g., modern JS framework capabilities) and counterpart innovations that make cross-document navigations feel instant (including Declarative Partial Updates on the horizon). He describes this as a transitional period where multiple approaches can deliver fast, smooth UX, depending on context. Given the evolution, he argues that real-user monitoring is essential to validate lab wins in the field. He also shares that same-document navigations appear more prevalent than past estimates suggested, expanding the unmeasured surface area.
New Performance Entries: Soft Navigation and Interaction Contentful Paint
Michal walks through the new timeline entries: a soft navigation entry (modeled after Navigation Timing) sets a new time origin and slices the performance timeline for the subsequent paints, while Interaction Contentful Paint entries report contentful paints triggered by the interaction that initiated the soft navigation. He explains how to join them using navigationId and optionally associate them with the originating interaction by correlating start times with processing windows. Michal also notes possible future exposure of navigationId to other entries to improve attribution. This segment covers the implementation details that let RUM tools measure soft navigations with parity to traditional loads.
Attribution Model: Outgoing INP, Incoming LCP, and Prerender Nuances
Michal contrasts traditional navigations—where the outgoing page’s last interaction (INP) and incoming page’s loading (LCP) are separate—with prerendered pages where time origin begins at prerender start and activationStart must be subtracted for accurate LCP. He shows that soft navigations mirror this model: the interaction completes, a new time origin starts, and subsequent contentful paints are attributed to the new navigation. He advises teams to either measure end-to-end or, more usefully for blame, split attribution into outgoing interaction and incoming loading. This guidance helps practitioners pinpoint whether delays stem from the current page’s interaction work or the next page’s render.
Lessons Learned: Abandoned Approaches to Measuring Soft Navigations
Michal reviews earlier attempts that failed, such as resetting LCP state mid-page—which misattributes dynamic repaint noise—and naive reset triggers on URL or every interaction, which either miss early work or churn too frequently. He also covers a more promising “DOM modified” approach that still accumulated too broadly over time and struggled with precision and recall in microbenchmarks. These dead ends motivated a more robust model focused on interactions, task attribution, and component scopes. The retrospective clarifies why the final design favors structured primitives over global resets.
Under the Hood and Getting Started: Interaction Contexts, Component Scopes, and the Origin Trial
Michal explains the current architecture: detect key interactions (initially clicks and select keyboard paths), establish an interaction context, and persist it across async work via task attribution. He shows how internal tracing links event handlers, network, and timers, and connects this to public proposals like Async Context/Async Local Storage that could enable similar capabilities for developers. He then covers tracking effects—history traversals and DOM modifications—using a component-root ownership model reminiscent of container queries work, which may also improve LCP for complex DOM constructs like Shadow DOM and SVG. Michal stresses minimizing heuristics, exposing primitives, and letting the community decide policy, then points to the origin trial, docs, and a demo booth so teams can try the features today.
Q&A: ActivationStart, Mental Models, HUD Tooling, and Measuring Last Interactions
In conversation with Phil, Michal clarifies that prerendered pages should interpret LCP relative to activationStart, not zero, to avoid inflated timings. He discusses how View Transitions blur SPA/MPA distinctions and encourages developers to choose navigation types per route while relying on RUM to validate choices. Asked about the green/orange HUD, Michal says the visualization was built for the talk but could evolve into a tool, and he notes existing HUD support for paint invalidation and layout shifts. Finally, he confirms that for hard navigations you can already capture the last interaction on the outgoing page—Chrome flushes that event timing before visibility change—enabling teams to stitch outgoing INP with incoming load for full attribution.
Michal's been working in the Google Chrome team for a long time, or certainly at Google for a long time, working on all aspects of the web. I know he's done lots of things to do with the web platform, including things like working on the physical Web, working on kind of the Semantic Web, all nature of things, but very much working on kind of core Web vitals.
Now, we've heard a few things during the last day or so about measurements and metrics and just the importance of that and then how we can apply it, what we can learn from it. So I think we're going to hear more along those themes there, particularly to, to do with interactions and navigation. So let's do it, shall we?
Shall we have another giant round of applause as we welcome Michal Mockney to the stage. Michal, over to you.
All right, mics are working. Thank you, Phil. Oh, and I'm unlocked.
Beautiful. All right, well, hello everyone. Those lights are glaring. I am Michal. I do work at Google. I work on Chrome speed metrics and I'm really excited to speak with you all today.
So I do work on the web performance timeline APIs at Google. So that is our implementation of an open Web standard.
And among other things, we implement the core Web vitals and we maintain them at Google that we share with Crux. And today I want to discuss two of the pillars of the core web vitals.
Responsiveness of interactions and the loading performance of navigations.
So everyone here I'm sure is super well aware of lcp, so I'm not going to review it, but it's actually kind of hard to visualize up on a slide. So I created a little fun experiment in Chrome to integrate into the hud. So hopefully you could see the green flashes of content as this page loads.
So each one of these green rectangles showing up in the HUD represents the moment that a new element becomes an input to the candidate selection of lcp. The moment it could become an LCP candidate. Only the largest content will eventually become lcp, but each of these paints were candidates.
Now, internally, the browser is doing a bunch of bookkeeping to make this happen.
I like to think about it as having a short term and a long term memory. In the short term, we do some accurate accounting for things that are loading and painting and presenting, and then we eventually report to the performance timeline and do some internal metrics.
In the long term, we sort of keep track of the whole page. All the content that's ever loaded, has it already become contentful? Has it already painted?
Should we ever look at it again. So every new page load, you start with a blank page, a blank slate, perfect amnesia.
And the raw stream of paints that are observed and filtered and simplified become exposed as lcp.
Now, there's many ways to look at LCP to measure LCP. Here you see it in DevTools, the real time local metrics.
And as the page loads, I see each one of those new candidates update and I see a new value in the top left. And when I finally interact with the page, we'll stop accepting any new LCP candidates and we switch from navigation loading to interaction responsiveness measured by inp. So I see a score in the top right and I see a list of interactions as I go through and interact with a page.
So it's kind of loading first and responsiveness next.
Now, INP is somewhat dear to me. It was kind of one of the first major projects on the speedmetrics team that I joined, that I was part of from end to end. But even I admit that interactions, as we measure them today, it's really only the first part of a story. It's the first possible time to have any visual feedback whatsoever. But many interactions are more than just inp. It's more than just that one. Next, paint.
Some interactions lead to a whole new loading experience, complete with a URL change perhaps. And until recently these were largely unmeasured. No green rectangles here, no new LCP score in my metrics, at least on the performance timeline, at least in core web vitals.
So I do see like an interaction reported. So I know something's been happening, but I don't think it really captures the full loading experience as users would describe it.
Until now.
Aw, thanks. So here we see me interacting with this page again with a few experimental Chrome flags enabled.
And we see the interaction, we see the same document navigation, we see it triggering a bunch of contentful paints. I made them orange to differentiate. So whenever you see green or orange, you know this is a real document or cross document navigation, old school LCP versus orange, which is this new thing.
So yes, it does require feature flags, but they're available in origin trial today. They have been for some time and you can even measure them on the performance timeline. You see that in the console on the right there? And so I'm kind of hovering and getting just like with LCP references to live elements and timing data.
I have to show one more example. I'll just never get bored of looking at this thing. So this is GitHub, which is a soft navigation site and this is where if you have negative feedback where you can go give us new issues. So I'll show you how to do that.
All right? So with that, I'll switch over to story time.
One of my unique memories in the early days of INP was having a debate with Paul Irish. He was not a big fan of the name and he was trying to convince me that we should go with something else. And we made a big doc of pros and cons and everything. So if you still hate the name, I want you to blame Paul for giving up the fight. And one of the reasons the name stuck, there are a few, but one of the reasons was that Interaction two Next Paint felt like a good base for a possible continuum of measurements. We knew that Interaction to Next Paint was strictly a better way of measuring input latency. It was much better than first input delay, and it did a good job of capturing jank. But we speculated about future extensions. Interaction to Next fcp, you know, the first moment of truly contentful results, maybe next largest lcp, maybe even visually complete.
So before we even shipped inp, we were dreaming of more.
So that's the topic of this talk, how we've been long working towards measuring soft navigations, how that morphed together with our desire to do better, to measure interactions, and how the lines begin to blur between the concepts of page loading and interaction responsiveness.
So I want to start with some more about the motivations behind this.
Should be obvious to some of you.
First of all, I think it's super cool. I heard some applause earlier. So show of hands, who else thinks it super cool?
All right, I have found my people.
Maybe more importantly, it is a top feature request for a long time for the web Performance timeline. It comes up again and again and again.
This issue was filed in 2020, but references go back years. I mean, we've been trying to measure this since the very beginning.
And of course, for us at Google especially, there are measurement gaps that affect core web vitals, and that is a big motivator.
Yoav has helped work on this problem for a long time, and he helped write this article with Philip Walton. I want to pick out a few choice quotes because I think that they do a better job than. Whatever. I'll say.
So Google has no preference as to the architecture or technology used to build a site. SPAs, MPAs are both capable of delivering high quality user experiences, and the intention of Web Vitals is to provide metrics that measure user experience.
And so we're actively working to close the gaps And I did not have this slide originally in my talk, but I felt like I needed some way to transition forward, especially after the last couple of days. I know, I get it, it's Fun to bash JavaScript and a lot of folks in this room have PTSD trying to diagnose the worst of the worst crimes against humanity.
But JavaScript is part of the web platform. I think it's a magic part of the web platform. I think it's truly awesome. So we have a role to play. But I am worried a little bit about the rift in the community. So with that segue, I want to talk about one more motivation.
All the previous reasons really are sufficient to work on this problem.
But beyond that, I think the landscape of the web is evolving.
I know Rich Harris is speaking later. I know he's in the house. He might be hiding preparing his talk, but four years ago he delivered a short talk with a very cheeky title. I thought that would be a nice way to describe it. Have single page apps ruined the web, so I'm not going to spoil the answer. I'll have you watch the video yourself because it holds up incredibly well to this day.
But in that video, Rich lays out some observations about a new breed of application which kind of blends the properties of traditional MPAs, traditional SPAs, it's really neither of either.
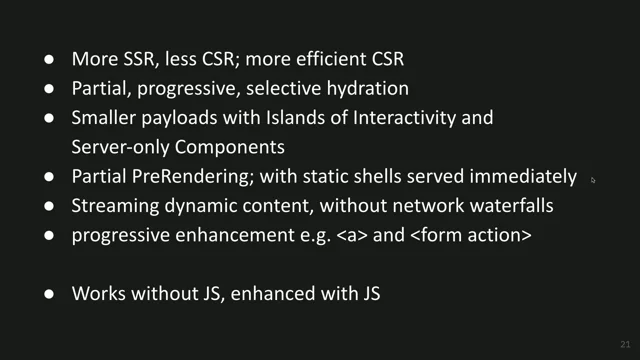
Some of the key points I think that stand out fast initial loading, fast subsequent navigations, accessible and resilient user experience, powerful capabilities and a great developer experience.
You can have your cake and eat it too. He tried to coin the term transitional apps with this wonderful graphic that I just took a screenshot of. I don't know if the name quite stuck yet.
Maybe we could bring it back. So I'm not going to explain in full detail all of the reasons he tried to make this pitch, but I'm going to try to do a quick demo to give you a feeling for it. Because in the last four years since he did that talk, more and more has happened that just makes me more convinced this is true.
So let me try to see if I could do this. That wasn't it. Not bad. All right, so this is a demo site built with Astro.
Astro is an amazing framework. It's mostly made for building server rendered, mostly statically built sites.
So it's very much in camp mpa. So if I refresh Astro I will get my green squares, some simulated throttling here. So it's slow on purpose so you could see a progression. Oh no, that might be just too fast. All Right, let's try that one more time.
All right. So as I navigate through this site, you could see that it's doing cross document navigations and you see all the paints that are selected. And so the green flashing means we've actually reset the timeline, we've had our amnesia and we're measuring lcp. If I went through the performance panel, I would actually get LCP scores. If you're measuring with rum, you'd measure each one of these interactions, each one of these navigations, and it's a solid framework, it does really well, no pun intended there actually.
All right, but I'm going to switch to if I got this right.
There we go. So this is the main layout for this demo written in Astro, and hopefully some of you are aware of this. A couple years ago, Astro started experimenting with view transitions back when they were only available for single page applications.
And some folks whipped together a couple quick demos and eventually Astro adopted it first class into their framework. And it was absolutely super cool. You could just like, no, no, there you go. I will save this. I add one line of code to this demo.
That's as much as I dare do. And I switch over here.
So your initial load continues to be as it was before, but if all goes well, we switch to orange.
Every interaction on this page has some rich transitions.
It looks very beautiful, but it's no longer doing cross document navigations. It switches entirely to same document navigations in order to enable this view transitions experience. So you might have deployed your Astro site for years as an mpa, had a certain expectation from field metrics. And then you hear about this amazing new feature. You read a blog post, it's one line edition, you, you add it, you go to deploy it and everything changes overnight.
Your run data, you see a tank and the number of visits, you see a completely different set of scores for your core web vitals.
This is a very vanilla vite based, React router based demo. And so if I load this website in React, I get a typical LCP score. But as I navigate, it uses same document transitions, it uses routing.
And so for years every React site using React router, you would get no data. There's no way to measure these transitions, but with one line of change similar to Astro.
Let me refresh that.
If that goes well, all of a sudden I'm using cross document navigations.
Okay. So as an author of a site, I don't change a single thing. I just toggle a setting at my router. Okay. MPA frameworks are supporting same document navigations spa frameworks are supporting cross document navigations.
This is not definitive of the design of the framework.
It's a choice that developers get to make for every navigation.
All right, switch back to slides.
Right. So as a final point, it might feel like a gimmick, but I see site authors, site authors that have been deploying spas for a very, very long time choosing electing to switch to cross document Navigations MPA navigations.
You know, when I ask about the reasons, it's a little bit elusive. You know, there's a range of possible reasons, but I'm not sure how many of them are 100% well informed and vice versa. We see MPA frameworks having the ability to switch to same document navigations for a range of reasons, and it's not clear what all the implications will be.
So here's a sampling of wonderful features that you get from modern JavaScript driven frameworks that just make same document navigations a lot better.
I'm not going to go over all of them. Some of these things are quite complex. They might be imperfect, they might be hard to deploy, they might have paper cuts. But it's also been a commendable effort and there has been excellent innovation and a lot of progress, including the performance space in the JavaScript ecosystem. So it's not all bad.
All right, that's the end of the Kool Aid portion of the talk. I don't drink Kool Aid anyway. I'm more of a sparkling water drinker. I figure if we're going to start debates, we might as well start this one today too.
And if you're in Camp mpa, don't worry, I got you covered too.
So it's not just JavaScript frameworks, of course, that have been innovating. So here's a sampling of features from Camp mpa. There are a bunch of things that enable instant and seamless cross document navigations, and there's only more shout out to this last one, which is a very nascent new effort called Declarative Partial Updates, which supports a lot of really cool stuff built right into the web platform. We don't know if this will ship, we don't know how far along it's coming, but it's exciting. So it's more about developer choice than ever. So the point is, it feels to me like it really is a transitional period.
And I love that name. There's a lot relying. It's like heavily overloaded term, but it's very transitional. Fast and smooth navigations, maybe cross document, maybe same document, lots of innovation, lots of alternatives, some hype, some delivering up to the hype.
So I'm excited to evaluate if these cool techniques work well beyond the lab. Will they hold up for real users in the field? Okay. And I think real user performance monitoring will become a critical part of the story, or it should.
And it also seems to be a growing share of the pie. Based on previous experimentation that we've done in Chromium, our best estimates were that about 15 to 30% of the web was in same document navigations. That isn't the range of error that we had. This is across different platforms. That was like roughly 15 on some platforms, roughly 30 on others in our latest numbers. With our new approaches, we're seeing much larger numbers. It's possible that this has, you know, our insights might be better with our ability to measure better. Might also be that this is a growing share since we last looked. So those are pretty substantial that are largely unmeasured. So I'm mostly excited, hopefully you're excited about the opportunity for this community to help gather those performance insights of all these, this breed of new applications. All right, so let's get into how we get that done. Of course, it starts with measuring interactions. From there, soft navigations and then the paints that follow.
And so we have two new performance entries coming to the performance timeline. And it's as easy as this, more or less.
I'm not going to give you all the observer code, but so you can start with event timing, which you're probably already doing to measure interactions in XPaint. Hopefully this is going to be an easier way to understand it.
Of course, event timing, you get the start of the interaction, you get the end of interaction. You also get the processing time in the middle. Thank you Andy, for covering all the gory details this morning. Saves me from doing some of it with the origin trial that's in Chromium. You start to get a new soft navigation entry. And the soft navigation entry is modeled after navigation timing.
You really only get one new timestamp, get a bit of metadata about the navigation, but that timestamp is the most important thing. It tells you that a navigation happened and it tells you when to start slicing and dicing your performance timeline.
It establishes a new time origin for everything that's to follow. If you have the paint timing mix in feature enabled, you do actually also get the first contentful paint as an additional timestamp, but that's not currently in the origin Now, if you want to this is entirely optional, but it is easy.
You can Sort of map the navigations to the interaction that led to them. And you do this like this. The start time of a navigation will always fall inside the processing time of the event that led to it. So you could just do a simple list or simple search.
Not necessary. You don't need this to measure navigations, but this is how you would do it if you wanted to.
And then you get another new performance entry. You get a stream of entries called Interaction Contentful Paint.
These are every contentful paint that was caused by the interaction that also caused the navigation. And these are modeled after lcp and they also mostly have a single timestamp that's important.
You also get largest content or algorithm, so you'll only get one new one with each new largest contentful paint.
And like lcp, it's important to have a time origin to make the timings relative to. So in this case, you want to go back to the soft navigation, and this is how you do that. It's also incredibly easy. Every soft navigation creates a new navigation ID value that's given to you in the soft navigation entry. Every interaction contentful paint also has a navigation ID value. You just join them together.
And so it helps you slice and dice the performance timeline.
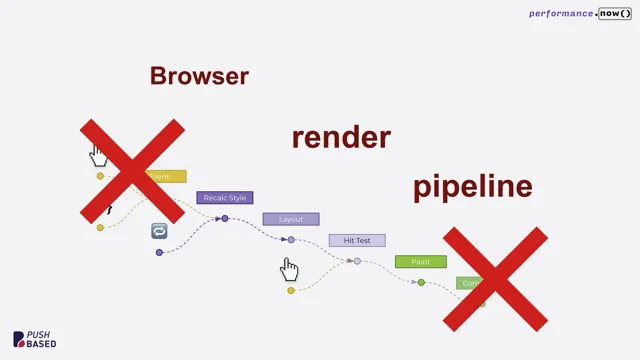
It's possible in the future we'll expose navigation ID to more entries. For now, you just get it on event timing, layout shifts, and the soft navigation entry. But maybe resource timing or even long animation frames would be useful to expose to, to sort of help explain where that time origin comes from. I want to look at hard navigations. Okay. I don't know how many people have dug deep enough to think about how it works, but this is kind of a very simplified model of the performance timeline as you navigate, you know, let's say clicking a link, a traditional page.
So the first thing that has to happen is the page you're on. The page with the blue link, the page you're trying to interact with, has to actually handle that event first. So if that page is janky, if it takes a while for the event to arrive and then run all the event handlers and then possibly run before unload, and then the browser finally gets to do the default action of trying to navigate to that URL, all of that gets measured today for the sites that are already out there, as inp. Okay. The last interaction with the page can be particularly slow, actually. There's a lot of stuff going in there, and it's that page that gets blamed for that jank.
It's that URL. This is already just How INP works.
If you're not trying to be careful to grab that last interaction in that last beacon, you might be losing valuable data.
And then eventually the browser starts loading. You know, you get a loading spinner and the time origin resets and we start counting a new time for the next URL and eventually you get an lcp. And so implicitly the LCP time is relative to this new time origin.
But what happens with sort of pre rendered navigations if you're using speculation rules? Well, the time origin actually happens a lot earlier. It's the time that we start pre rendering the page. You might be doing network fetches, you might be doing sort of rendering work, parsing, that sort of thing.
You're getting a lot of the work done up front, but you're never painting.
The page isn't visible. You're not going to have any lcp, not until you actually click the link. We activate this page and then you might get a really quick lcp. Okay, but if you're not careful, if you don't compare this LCP time to the activation start time of the page, if you just assume the LCP time is the load time, you'll get these huge values. Your document starts Pre rendering and 30 seconds later it gets activated. You have to be careful to check your against activation start. So this is already true today. This is just how it works. These are soft navigations.
The model is very similar. The current route you're on that provides you the links that you try to interact with might be preventing you from starting to navigate to the next route.
So it's only once the current interaction is done processing that we restart the time origin and all new contentful paints are attributed relative to. So I don't know if it's called a route start.
It doesn't really have a name right now, just the start time value in the soft navigation entry. We think the model's pretty comparable.
So the interaction of the outgoing URL and the loading performance of the incoming URL together, that's user Now these choices really aren't forced upon you. If you want to measure it end to end, you could do that. I showed you how to glue it all together.
So you could go from the hardware timestamp of the input all the way up to loading performance. Or you could report it as two separate metrics. The INP of the outgoing page, the soft LCP of the incoming page. So I'm sure there's going to be a lot of things, but for attribution reasons, I think Slicing it like this probably makes sense.
So if you just cluster it all together, if I told you that next URL was slow to paint, had a very large value lcp, then you're going to go into it and you're going to look at how is this page rendered, what JavaScript's running, what resources are fetching, you're going to try to optimize whatever it is. But it might be useful to know that actually 90% of the time was spent on the outgoing page before you were even allowed to navigate. So that really, it just simplifies attribution.
All right, so that's really about everything you need to understand to get working, to get, you know, you understand our goals, you understand the concepts, you have a model for everything. It really is that simple. But for anyone curious, I thought it might be worth digging under the hood to discuss how it actually works. So first, quickly, what didn't work? Okay, so what did we try in previous versions, previous origin trials? So a long, long, long time ago we tried. Let's just try an experiment. What if we just reset lcp?
I talked about the short term and long term memory. What if we just give it amnesia? What if we restart? Well, LCP was built for a web that starts with a blank page and sort of every contentful paint is automatically attributed. So the first time you paint something, that's the loading performance. But if you just reset lcp, you've already got a lot of dynamic content on the page and it's kind of arbitrarily going to paint. If you just like swipe your mouse over it, you're going to invalidate swaths of the page. And so it's kind of random at reporting, so you don't really want to do that. Good.
All right.
Yeah, don't be interrupted by that.
The other thing is, if you have this sort of model of just a global stop start resetting, you have to pick a point when you're going to reset. So if you reset every time URL changes, like a same document URL changes, you've already missed a huge opportunity to measure a bunch of loading performance. A lot of sites will re render first and then update URL last Might not be the most accessible way to do it, but there were a lot of deployed sites that did that. If you reset with every interaction, it's a little bit better, you get to cover more pains.
But how often would you reset? Like often users are interacting faster than you're able to measure. You know, in the field we know LCP, we want it to be under 2 1/2 seconds, but it's often 4 seconds, 10 seconds. So do you expect users to sit there and not interact with the page for 10 seconds? And for cross document navigations, you have paint holding and you have input suppression. And so we kind of prevent these types of interactions. But on single page applications, you're often filtering through a form or continually typing into a field. We're actually trying to motivate people to continue interacting as stuff's loading. So that didn't really work that well.
Another version did explicit interaction tracking and sort of DOM modified bit. Okay, that was a much better version. And it differentiated sort of initially loaded content from dynamically added content do to interactions. It was much better. One problem this had is it would just accumulate over time. So every time you add an interaction, any interaction, even if it wasn't a navigation, everything it touched got touched. And then if you used shared layouts or anything like that, it would just accumulate and accumulate over time.
So eventually you just go back to the first version where everything on the page counts, but we like that direction.
It also had a bit of a precision and recall problem. There were some like performance micro benchmarks that didn't work. We wanted to push the limits, but we were worried about doing it. But we just.
Anyway, we kind of like that model. We just knew we needed improvements. Okay, so here's how it works today. So it starts with observing key user interactions. Okay. For now, it's fairly constrained on purpose. We're talking about click events, navigation events that might trigger from browser UI some limited support for keyboard events. We wanted to reduce risk and noise, and we wanted to focus on quality in depth before going breath. Okay, so most interactions, most navigations, most soft navigations on the web really do start with a click.
And so if you solve that problem, we can extrapolate easily to others.
But there's no fundamental reason to constrain ourselves like that. So ideally we merge with INP eventually the concept of an interaction, if it works for measuring inp, it should work for measuring these new things.
We actually want to potentially expand out the concept of an interaction.
And you know, under the hood, CLS and LCP also track interactions for various reasons. We should just consolidate all of that. When you detect a key user interaction, you establish an interaction context. It's really like a map or a structure. And every distinct interaction gets its own distinct context. You can only have one active context at a time. And we really want to persist that context across scheduling.
So when you do settimeout or you do fetch or you do async await.
You want to keep your context around, and that's what we use a feature called task attribution. At the end of the day, we want to know every single task that was triggered because of an interaction.
So here's a sort of internal tracing example.
So here's a bunch of work that happened on main thread.
I had an event handler. From there I sort of needed to go to network from the network I needed to yield. And then I had a timer fire or something. And you could see there's numbers at the top, which you could think about it as an id. And so it was capable of saying this was the same interaction along the way, sort of strings together all the work. And in more complicated cases, it's capable of weaving things together. This is much harder to do yourselves.
Now, this is internal only. There is some risk of performance overhead of exposing this public publicly.
It's easier to ask, do you have a context? Than to say, give me events that I can observe for every single context change.
But at least in lab tooling, it's possible that we could do, you know, interaction total blocking time, or maybe interaction TBD or every animation frame that's specifically related to an interaction, or maybe every paint, who knows? And this is very strongly related to a public API proposal called Async context for JavaScript.
So this is to give you the ability to do something similar. I described an internal concept. We're kind of internally tracking our own little variable for interaction tracking purposes. But for your own, you could follow along here.
And that itself is related to Async local storage. So if you know this, you have the right context.
And so from task tracking, we also have to track effects on the page. So of course history traversals are important. We need to see that the URL has updated, but we also need to observe every DOM modification to the page in order to map changes to the interaction. So when we see a DOM modification and we have an interaction context, we try to mark that part of the page as sort of belonging to the interaction.
But it was important to support a new model of thinking to get this right. Anyway, we went through several iterations, but we really want to measure whole component trees because that's typically how sites are built. So you can think of this model of the leaf nodes are the actual elements that are painting. But often developers are thinking of updating whole components and sort of triggers re renders. Or maybe it clones template nodes and then attaches it to the thing. So the interaction becomes the owner of this root and everything that happens under it bubbles up and gets thing. And that made a big difference when we thing. And you think this diagram is poorly done and Michal's really lazy, which is true, but I'm lazier than you think because I actually stole this from last year's talk on container timing.
So Bloomberg folks are working on the public proposal version of this to give you a similar capability. You know, we're doing this under the hood automatically, but you could do it yourself if you. If you want to measure your own containers. Right.
So the cool thing about this proposal is it might be useful beyond just soft navigation measurement. I think it could be used to improve hard LCP altogether. Right. So we have some things we want to improve with shadow dom with default content like tables or svg. So it's all pretty nascent work, but I am quite excited about it. I think maybe next talk, maybe the talk next year. And so finally, we glue it all together and we sprinkle in the tiniest amount of heuristics. Okay, so in the past, we got feedback that, you know, there's too much heuristics, too many heuristics. It's complicated, it's hard to reason about, hard to model. So we've decoupled as much as we could into these foundational parts that themselves will become primitives for the web.
Now, we have some opinions about how to use those primitives and how to glue it all together, but we're going to try not to bake anything that we don't have to into the performance timeline.
So, for example, right now we have opinions about measuring trusted user interactions, but we've talked about still supporting measurement of programmatic navigations.
So if you sort of automatically navigate from page to page to page, the user's not asking for that navigation. Right now, you won't get performance data. Maybe we should still expose that then. The types of history traversals, push state, popstate versus replace state, where exactly to place that time, origin value that I showcased, the semantics of lcp, various things we're going to decouple and we're going to ship as much data as we can to give you the ability to build your own model.
All right, this QR code, I mean, it's pretty easy to Google this stuff to find the explainer, to find the blog post. But here's a quick link that'll take you to how to get set up. This is an origin trial today, if you want to try it. Many of the folks in this room Already are.
Thank you very much. We've gotten lots of great feedback and if you're super duper lazy, you don't even want to click the link, you don't want to try it. There will be a demo booth swing by and you could try it live later today.
All right, so I think we're coming up to the most important moment of the talk, the time where we all want to find out.
So have single page apps actually ruined the web? What does the data tell us?
I'm sorry, you'll have to measure to find out.
Thank you very much.
Thank you. Michal, do you want to come take a seat and have a. I'll leave the. I think we've got time for a few questions, haven't we?
Just a couple. Thank you very much. Yeah, no worries. That's a great. That's a great talk. And I mean, I'm a little bit annoyed with you for leaving us with that at the end. Then it works. We were going to get a fabulous kind of answer. And also along the way, I mean, kudos for lines like, oh no, that's just too fast. When you was having a demo. That's a great humble brag followed by I'm lazier than you think. Later on, as a reset, what a roller coaster you sent us on. There were a few questions, so I'll get into those if I may.
So Vinay on Bluesky did ask about actually something we're going to probably touch on a bit later on with the Speculation Rules API in Barry's talk. But Vinay was asking about that, about pages that are speculatively pre rendered and about how things are measured there and what is the measurement there? Are we kind of measuring on root start or on something else? Activation starts. So that was the slide. I had one slide on it.
So the question might have been asked before. Okay, so the time origin starts a lot earlier. Let's say you're on a page that has speculation rules.
The browser decides to pre render that page and that time origin starts there.
And then 30 seconds later, you click a link, you get an activation event on the new incoming page, which you don't have to observe. And the performance timeline, navigation timing gets an activation start. And so what you'll get eventually is a performance entry for LCP and it'll say like 30 seconds.
And you'll be like, oh my goodness, like that's terrible. But you have to sort of subtract the activation start. So don't assume zero is your start point for lcd. Okay. Okay, great stuff. Thank you very much. And you know, there's maybe a slight meta question here about, you know, MPAs versus SPAs. And you know, you're not, you're not prepared to stick your neck on the line and say this is. This is the answer whether they've ruined the web or not. But that's all right. That's not where I'm going with this. I'm just thinking about like the mental model for developers and you know, now with the View Transitions API and these kind of tools, it's kind of blurring the lines right between these. Absolutely. So to what extent do you think that that really changes the fundamental kind of mental model for developers as they're building their sites and applications? I mean, I always found it was very easy to kind of reason about an MPA where I knew where things started and where they stopped, but those lines are blurring now. So do you think that developers are keeping up with the mental model shifts as we're kind of working across those? I know it's a bit of a meta question. I hope so. I think frameworks have gotten really good at making developer experience quite large. Lovely.
So I think the component model has taken off. I think there's different ways to do this and adopt it. But I remember writing server rendered templated. Anyway, I much prefer the component model, but Astro lets you do that and keep it all entirely on the server. So it just renders the page and then ships the HTML. And so you have this wonderful developer experience.
But the technology choice is like that. But I demonstrated it's a flip of a switch. So I think there could be reasons why you would pick one model over the other. I mean, maybe memory, maybe occasionally you do want to navigate to reset things or maybe for certain types of navigations it's not worth having a state get dirty across. But I think we're going to more and more be able to design our pages and then pick on the transition level. Do I want to have a cross document transition? Do I want a same document translation? Are they similar enough that I save a lot to do things thing? I think there might be more talks later on specific getting into the details, but I think largely right now it's either just lab testing works good for me or I read about it hypothetically.
This is how it should work. So I'm going to try it. And so now we will have more tools to be able to actually evaluate. Right. Cool.
Excellent. And talking of tools, I mean Theo is asking this via the form. I think we enjoyed the visualization.
You had there that showed like the green or the orange boxes to demonstrate the differences. You thought it was cool. I think we universally thought that was cool. How much of that was something that you'd made for the sake of the demonstration and how much of those are tools that we'll be able to see that visualization? I hope it will be a tool that you could use, but it was 100% made for you all year. Just for us here, but hopefully that might. So the HUD has existed for a long time and it's been very useful to measure all paint invalidation, like for certain performance tests and then there's a layout shift integration. But somehow we overlooked adding for lcp, just contentful paint.
So probably we should have had it all along. Okay. But it lets me demo today, you know, which is what we love. And it's a very visual demo.
It kind of makes a real impact. There's a question that's coming in right now. I'm reading it as it's being typed. So should we see where this goes? This is exciting. So Floriano is asking for a soft navigation as you've described. I can measure the interaction to navigation, start on soft navigations. Would it be possible in the future to do this for hard navigations as well? You could do that right now. Yeah. So the last interaction with the page in Chrome, what we try to do is to basically say right before visibility change event listener, which is kind of where you have your chance to beacon all your outgoing beacons. There's some raciness there. You don't always get that chance, but if you do, you could take the last event timing entries from your performance observer and we try to flush it. And so when an interaction happens that will unload the document, you will still get that last interaction, but you don't get it in the incoming page, you get it the outgoing page. That's for privacy reasons. That's like for blame. But also I think for attribution reasons there's a good, like, I think that makes sense to keep the attribution there. Makes sense. And if it's your own site, I guess you could, you know, beacon it and then you have to stitch things together.
Yeah. Yeah, for sure. Okay, thank you so much. Thanks for a wonderful talk.
Thanks for answering questions. Michal Mockney, everyone. Thanks, Michal.
- Web Performance Timeline APIs
- Core Web Vitals
- Largest Contentful Paint (LCP)
- Interaction to Next Paint (INP)
- Chrome Flags
- Origin Trial
- Single Page Applications (SPAs)
- Multi Page Applications (MPAs)
- Transitional Apps
- Astro Framework
- View Transitions API
- React Router
- Speculation Rules
- Cross Document Navigations
- Same Document Navigations
- Declarative Partial Updates
- Real User Performance Monitoring
- Event Timing
- Soft Navigation Entry
- Interaction Contentful Paint
- Navigation ID
- Pre-rendering
- Task Attribution
- Async Context for JavaScript
- Async Local Storage
- Container Timing
- Trusted User Interactions
LCP and INP measure loading and responsiveness, but same‑document soft navigations blur those lines. Learn about new Performance APIs to measure interactions and navigations, how they work, and what’s next.

