LoAF

Confronting JavaScript Runtime Costs and Long Tasks’ Limits
The emcee introduces Andy Davies, who opens by noting the web’s steady growth in JavaScript and the risk of judging performance by download size alone. Andy illustrates how tiny scripts can wreak havoc on the main thread and explains why Long Tasks (>50 ms) have been a blunt tool: they reveal that something blocked the main thread but not what caused it. He frames the talk’s theme around measuring real runtime impact rather than bytes on the wire. This sets up the need for better instrumentation to diagnose and improve user experience.
Introducing Long Animation Frames (LoAF) and Rendering Phases
Andy introduces the Long Animation Frames API—“LoAF”—which measures the time from frame start to the beginning of paint and records entries when that exceeds 50 ms. He compares paint and presentation semantics across Chrome, Firefox, and Safari, clarifying why “paint” is the interoperable time point and why the GPU handoff matters for interpretation. He maps LoAF timestamps to a simplified DevTools model (script, style/layout, paint) and cautions that script can also run during render via callbacks like requestAnimationFrame, ResizeObserver, and IntersectionObserver. This segment equips the audience with a mental model for how LoAF observes the rendering pipeline across browsers.
Mapping LoAFs Across the Page Lifecycle: FCP to DOMContentLoaded
Andy shows LoAFs in the context of the full page timeline, including a slow first frame around FCP and a characteristic long frame just before DOMContentLoaded when defer/module scripts execute as a single task. He highlights an in-progress fix to split that work to avoid blocking early interactivity when users perceive the page as ready. Using RUM plots, he demonstrates how aggregate LoAF work correlates with behavior—faster sessions lead to more pages viewed. This ties LoAF to meaningful user outcomes, reinforcing performance measurement beyond static thresholds.
Quantifying LoAF Volume in the Wild and Platform Support
Reviewing 24 hours of RUM data, Andy shows typical counts (p75: ~25 desktop, ~60 mobile, ~100 Android tablets) and dramatic outliers, including a page with 21,000 long frames due to a timer, consuming 85% of its time in LoAFs. He covers practicalities: LoAF data is available in Chromium-based browsers, Firefox is exploring implementation, and entries are only created when the tab is visible. The examples underscore how pervasive and varied long frames can be, guiding where to focus investigation.
Connecting LoAF to Interactions: INP, Blocking Duration, and TBD
Andy explains how LoAF entries expose interaction timing (e.g., UI event timestamps), enabling alternative ways to estimate INP and potential input delay—where the longest LoAF approximates the worst-case input delay. He details the LoAF “blocking duration” calculation and describes creating SpeedCurve’s Total Blocking Duration (TBD) by summing blocking durations, then refining it by excluding interaction-induced LoAFs and considering how to treat the first long frame. He advocates developing derived metrics openly, setting realistic thresholds, and aligning definitions with user responsiveness rather than arbitrary windows.
Attributing Runtime Costs: Script Insights and Frame-Rate Estimation
Andy shows how LoAF can approximate frame rate during long frames (e.g., 200 ms ≈ 5 FPS) and discusses limits when frames are shorter than 50 ms. He then digs into LoAF’s per-script attribution for entries where a script runs >500 μs, including start times, execution durations, forced style/layout costs, and block time (e.g., sync XHR). This data lets teams aggregate by script, reason about why code executed (clicks, timers, postMessage), and begin identifying which first- and third-party scripts degrade user experience—moving from abstract “long task” blame to actionable insights.
Case Study and Diagnosis: Next.js Overhead and INP Debugging with LoAF
Using Selfridges as an example, Andy shows aggregated LoAF script data that surfaces first-party and Next.js work as dominant contributors, echoing patterns seen across multiple sites. He demonstrates how increasing CPU slowdown yields more script entries, helping teams prioritize the worst real-world conditions. Andy then walks through debugging INP with LoAF via timestamps: exclude the next-frame LoAF after GPU handoff, trim pre-interaction work, and attribute remaining script chunks to input delay and handling. A table pinpoints scripts like Tealium running at the moment of interaction, enabling targeted remediation.
Attribution Pitfalls, Source Mapping Tricks, and RUM-Driven Practice
Andy outlines challenges: missing source info from injected handlers (e.g., GTM), wrappers like New Relic collapsing source names, and cache-busting hashes hindering aggregation over time; he suggests normalization and highlights the //@ sourceURL directive to name scripts, even externally. He notes LoAF does not expose extensions or GC, advocating opaque attribution to separate site code from user environment. Closing, Andy shares helper tools (e.g., his DevTools visualization extension), reiterates LoAF’s value for understanding runtime costs, and urges teams to use RUM (beyond CrUX) for cross-browser signals and real-user context.
Audience Q&A: Targets, Tools, and Changing Frameworks
In Q&A, Andy advises setting “good numbers” by correlating RUM metrics with behavior and market context rather than chasing universal thresholds. On tooling, he recommends reproducing issues in DevTools while acknowledging the gap between local debugging and real-user variability. Addressing framework impacts (e.g., Next.js), he notes that wholesale migrations are hard; teams should pressure framework authors, plan incremental improvements, and use LoAF insights to build the business case. The session reinforces the talk’s theme: measure what users actually experience and act on data that pinpoints causes, not just symptoms.
Also delighted to see Mr. Andy Davis stood next to me ready to give the next talk. Andy is another very talented, very knowledgeable web performance consultant now working at Speed Curve. I've known Andy in the UK for a long time.
He just appears everywhere across the community. He's so engaged in the community.
He's so busy spreading the good word of the web and doing great things for the betterment of the web. I just want to to hear him all the time. He's going to talk today about loaf and long running tasks. You know this which is by the way is longer than 50 milliseconds, which I don't know, I feel like I struggle to get under that threshold as this intro is testament to. So let's not hear from me. Let's get back on track for timing.
No more toilet jokes, no more Halloween costumes. Another massive round of applause please as we welcome Andy Davies.
Thanks Phil, and good morning. It's great to be back. One of the things we've noticed, we've been watching how we build the web for a really, really long time. The HTTP archive has been measuring what the web is made of for 14 years nearly.
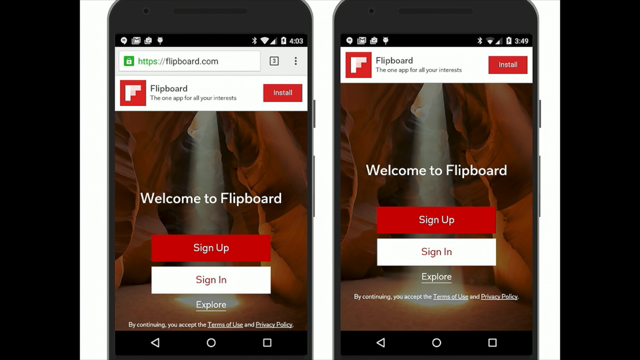
And one of the things we've seen is, is the web never gets smaller. Pages never get smaller.
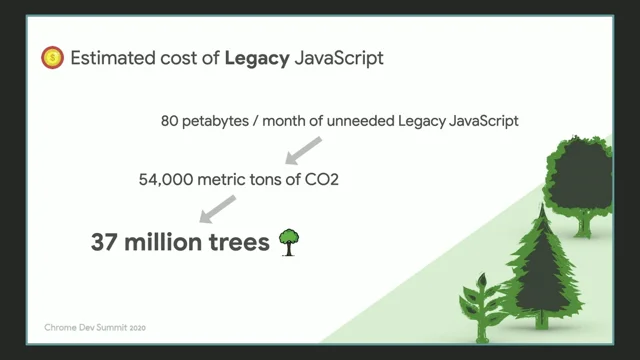
We add more and more JavaScript. Tim talked about AI slop. Unfortunately, if you actually use AI to start generating web pages now, AI defaults to building new JavaScript based pages, pages that are based around JavaScript frameworks.
And there's a challenge here because what we're doing by looking at the size or the number of JavaScript resources that are on the page, we're using it as a proxy for good or bad performance.
But when it comes to scripts, download size doesn't necessarily relate to to the impact.
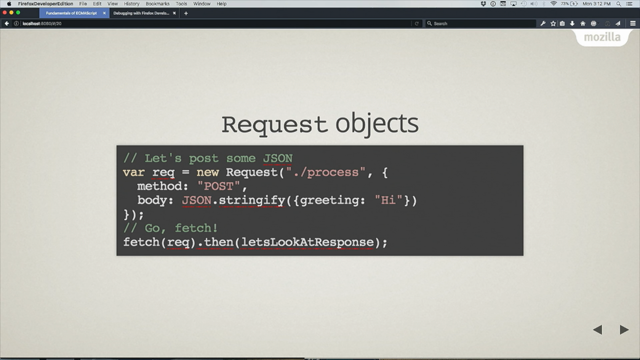
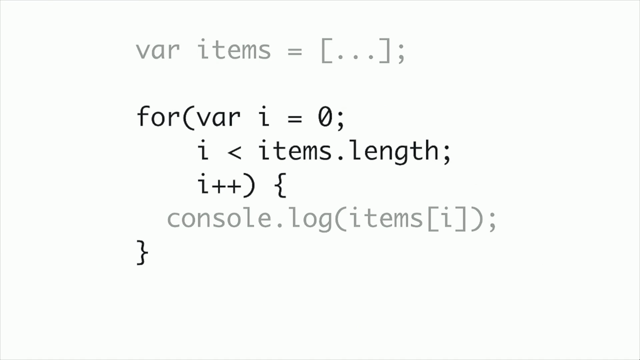
This is a really kind of silly, trivial example. If you want to know what it does every time the visitor moves the mouse, it burns the main thread for half a second.
So 200 bytes of JavaScript that can completely wreck your visitor's experience, particularly on desktop, won't apply so much on mobile.
So we've been using download size as a proxy for how well JavaScript performs or not.
And that means we kind of have this hidden danger. We don't really know what the runtime costs of all these scripts are. And that's unfortunate because I like to be able to measure things.
I work for a company that helps people measure things.
By measuring things we can begin to really understand where problems are and what we need to do to improve our visitors experience. We've tried measuring the cost of JavaScript before. I don't know when the latest draft here is 2024, but we had the long tasks API and long tasks measure any main thread activity that's longer than 50 seconds.
And this is great because we can measure them, we can show them in run. This is SpeedCurve. We can tell you all the long tasks, but unfortunately the first question we get when we show this to people is ok, so what caused these long tasks?
What script or activity ran that generated these long tasks?
And we don't get any detail. And it makes me kind of sad that I can't answer people's questions. But good news about three, two, three years ago, Yoav Weiss did the early work when he was still on the Chrome team and Noam Rosenthal took it on and a new API called longanimation Frames came into existence.
It's pronounced loaf.
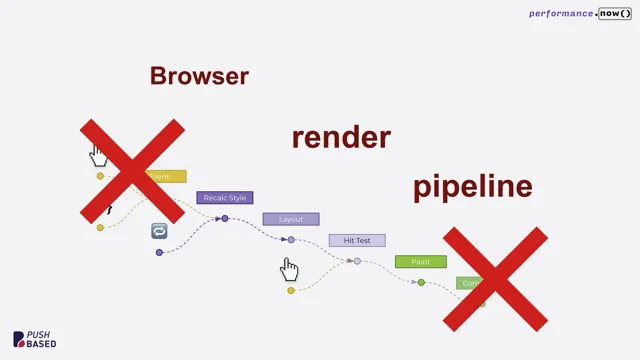
If you want to burrow inside Cliff Crocker's teenage brain, you can think of it as long as I'll leave you to fill in the end. And what it does is it times the gap or times how long it takes to present a frame to the visitor.
So we start the work on a frame and then at some point the frame is presented later and the gold standard is tried to get to 60 frames per second.
What loaf does is measure from the start of the frame to where we start to paint the frame. And if that's over 50 milliseconds, we generate a loaf entry.
Tim talked about the differences in measurement between Firefox, Chrome and Safari. Yes, Safari, that's the third browser. And there's what happens in Loaf measures to painting. And painting is a main thread activity. When we talk about painting is a really badly used phrase or badly used word in Chrome standards and web standards, we talk about largest contentful paint in Chrome. Largest contentful paint is actually the time to presentation. It's a time when we show the visitor the frame.
Largest contentful paint in Firefox is actually time to win the paint task starts.
Paint will be the interoperable time, because not all browsers can measure when the frame is actually shown to the visitor.
The thing to just bear in mind here is just consider that little gray bit on the end. That's when the main thread of the browser has finished its work and it sent the frame off to the GPU to be processed and the browser can start the next task.
Then this will become relevant later on. So just keep it in mind.
We have some time stamps. We have the time when the Frame started when we started the render process, when we started style and layout calculations.
And then we have a duration that tells us how long it took. And if you're familiar with dev tools and the performance panel, you can think of it in these simplified terms. We have some time where we execute a script, we have some time where we do something else, which we will come to style and layout and paint.
One of the things to remember is this script execution phase is not the only point on the page where we will execute scripts. We have things like requestanimation, frame animation, event callbacks. What are the others?
Resizeobserver and Intersection observer run during the render process.
So we don't only get script execution during that work bit at the beginning, we can actually get it during the render phase.
This is a really simplified view.
Scripts can call getcomputedstyle or get boundedclientrec and they can force style and layout calculations during script animation. Sometimes browsers will do the render phase mid frame.
Originally I wondered whether this was just the devtools any artifact I was seeing. But talking to Michael Mockney, who's talking after the break, he said no. There are reasons why the browser will do style and render, style and layout, even mid frame, and we've got no way of measuring those at the moment.
The event loop is quite fascinating and quite complicated in browsers, and there are a couple talks about it.
Lydia Halley did one, Philip Roberts did one, and Jake did one. If you're interested in understanding more about the event loop, I'd encourage you to watch Jake's because Jake includes the rendering processes in his. It's a slightly old Talk, it's from 2008, so it does miss some bits, but. But it's a really good intro.
We talked about interoperable time points and in Chrome when you look at LUF data, you'll also see timestamps for paint time and presentation time. Slightly cut off presentation time. Just so we've got these metrics or these timing points across browsers. But this is Chrome only. It will go into main. Sorry, it's Canary only. It will go into main Chrome at some point. And so we can kind of think about a loaf having these internal phases and it's just worth thinking about these and being aware that they're.
I'm not going to dive any more deeper into these. I'm going to go up a level and start to look at loafs in the context of a whole page.
Loafs can occur right across a page life cycle. Here is the familiar performance Panel view with the bottom half of the screenshot is the normal JavaScript and other tasks that execute on the main thread. In the middle you'll see a track that says Performance Timeline Custom. When I was trying to figure out how loafs fitted against the main thread activity, I built an extension about a year ago using the Chrome Extensibility API, so I could understand how long animation frames fitted against the other main thread activity I was seeing. We normally get at least one loaf for fcp. The first frame of a page can be really slow. Our browser has a URL. It has to go make a request for some HTML 300 milliseconds on a good day to get HTML that's more than a long frame.
So there's normally one long frame at the start and in this case we've got a couple afterwards where we're executing some JavaScript.
You'll often see one long frame just before DOM content loaded. We encourage people to load scripts asynchronously so they don't block the main thread or load them using defer or as a module. Defer and module scripts get executed just before DOM content loaded and currently they get executed as a single task. So what we often see is this one long task just before DOMContent loaded and you can kind of see.
If I go back, you can kind of see we get to DomContentLoaded, we've got all the yellow script execution and we can see the recalculate style just after the DOMcontent loaded event finishes. So we normally get one loaf here and there is a bug in process, a fix in process to try and break these up into separate tasks to avoid this delay because we have the challenge.
Carrie talked about it a bit about DomContentLoader where we present LCP comes up, it's on the screen, the visitor thinks it's interactive, but our scripts haven't run because we haven't reached DOMContentLoaded. So breaking this up so somebody can interact smoothly is really important.
We can capture this data and run, we can plot histograms and this is JavaScript execution time on a retail customer and how much total if we add up all the last on the page, how much work they did.
Tim asked the question at the end of Michael's talk yesterday, can we measure the style and layout phase in rum and yes we can. We can measure how long that style and layout process is taking and we can start to relate how the amount of work we're doing in long animation frames relates to visitor behavior. And quite orange bars. Here are all the low Fs on the page summed up.
The blue bar is the 75th percentile session length. And what we clearly see is that people with faster experiences look at more pages, they have longer sessions.
And aside from loaf, there's a point here that I think is really important to remember when you're looking at RUM data.
People with faster experiences do more, they visit more pages, they spend more time on your site. So when you look at your rum data as a whole, you will have more experiences from people who've had fast experiences than you will from people who had slow experience. So. So rum data is always inherently biased towards people with faster experiences.
Pages can generate a lot of these entries. I took 24 hours of data. I plotted cumulative distribution curves.
The 75th percentile on desktop was 25 entries.
On mobile it was 60. And on Android tablets, because Android tablets are generally rubbish and built a really cheap PI point, it was 100. You'll notice that the horizontal axis ends at 250.
And I thought it would be interesting.
And we're nearly at 100% for all the lines. But how many people think this axis goes beyond 1000 loafs and are paid to peak? Not many.
How many think it goes beyond 5,000?
How many think it goes beyond 10,000?
Hugo's brave. How many think it goes beyond 20,000?
No one. So the worst example I found in this data set is there was a page that generated 21,000 long frames. It was a page that was open for an hour and five minutes. So we measured the whole page life cycle and it was a French retailer and they were actually running on a Windows 10 machine. I presume it's quite an old Windows 10 machine and there was a timer running and every time that timer ran it created a new long frame. It spent 85% of the time on the page was spent in long frames. The next worst case was 15,000. And then below 10,000 it gets a bit more, the peaks get higher. There are less outliers.
To get this data, we can either query it from Performance Timeline or use an observer just like we would any other piece of performance data. And it's available in Chromium based browsers.
Firefox said at the RUM meetup on Wednesday that they are looking whether they can implement Loaf next year.
What will probably happen as they go to implement? There'll be new things we discover about it that we want to change. And the other thing to remember is entries are only created if the tab is visible.
So if you open a page in a background tab, or if you use pre render or speculation rules to generate it, then you won't get loaf entries for those. But beyond just timing the frame, we can have other information.
We can discover whether the frame is handling an interaction first. UIevent timestamp lines up with the timestamp in the UI event that gets fired. So we can determine did this frame happen. Handle an event, and funnily enough, it's another way of calculating interaction in the next paint.
We might not know what caused it, what interaction caused it, unless we are going to look at the event. But we can measure INP this way. The weird thing is, INP we only get for key presses or clicks or taps, but this we can get for things like wheel events. If you use a mouse to zoom or scroll, we can pick that up.
We can work out how large input delay might be if somebody interacts in the middle of a frame, then we have to wait for that framework to complete before we can handle the interaction. The longest loaf is essentially the maximum potential input delay. So with inp, we see the input delay for the worst interaction.
But we can kind of check the health of our page and look how bad could it possibly be.
We can estimate its responsiveness to user input. There's a metric or a duration in the data called blocking duration. And what we do is we look at all the tasks in the frame, we take 50 milliseconds from them and then look at the longest one that remains and add it to the style and layout costs and that gives us blocking duration. When we were implementing LUAF as part of Speed Curve, I decided I wanted to create my own metric. I wanted my own three letter acronym and I wanted it to be called tbd.
The thing you'll notice. So in Synthetic we have this, we have total blocking time. And the thing you'll notice in later web standards is time is used for timestamp and duration is used for elapsed time.
So I chose duration tbd, total blocking duration. How long was the page unlikely to be able to respond to a visitor's iteration smoothly? And the naive approach we took is just to add them all up and it seems to match main thread business all right. But there are some things I would like to do to improve it. When we introduced it, we made the commitment we would experiment in public and share what we were learning. If I was going to refine it, the first thing I do is remove low apps that were due to an interaction. Because if we're trying to build a metric that measures how long was the page unable to respond to interactions in a timely manner. It seems unfair to include interactions in that. Then we get to the question of what about those long animation frames before scp?
Total blocking time measures or uses the long tasks between FCP and time to interactive to calculate it. I have this challenge of using FCP because we can move fcp.
If you have a MVT framework or an AB testing framework, you might have an anti flicker snippet that delays fcp.
So if you're delaying fcp, you know it would hide some of those long tasks. So I have some concerns about doing that. And what I kind of thought about is let's remove or we could have rendered sorry after the first long animation frame the browser could render. At this point, what we've done is we've had some scripts that have gone on and blocked the main thread. So I'm kind of leaning towards just removing the first long animation frame and keeping the rest.
But I'm kind of really interested in what everybody else thinks. It's not us deciding what this just us deciding what this metric should be.
Everybody else should have a voice too. If we're going to build derived metrics, we should build them in public. We should talk about them, we should spec them. Some people in this room know I am very big on the fact we should spec derived metrics.
So we're left with these long animation frames and this is perhaps how we will calculate them.
Now we will remove the first one. We'll filter out any ones that are due to interaction and sum up the rest. We probably need to look at thresholds.
We just stole the default thresholds from total blocking time and what we see is that most sites exceed this. There are some that are in the green, don't get me wrong, there are some that are in the green. But these thresholds are probably too challenging to meet. But Loeff also has some novel uses that I think are quite clever. There are some people who are using it to measure frame rates.
The way some sites used to measure frame rates and don't do this is they would use RequestAnimation Frame in loops to measure frame rates. But we can begin to get some understanding of how bad the frame rate could be from Laugh.
So if the duration is 200 milliseconds, then we're running at 5 frames per second for the period of this animation frame.
If the duration is half a second, then we're running at two frames per second.
So for these periods of time, we can begin to make some estimation of what the frame rate is. It gets a bit harder where we don't have a long animation frame because all we know is that those frames were less than 50 milliseconds in duration. So the frame rate was higher than 20. But we can kind of pull it together, make some estimations. So Loaf gives us lots of useful data. And I've dug in and my sort of thoughts to all of you is you don't necessarily need to worry about the detail. You need to know what questions it can help you answer.
And that's what you should push your rum providers to work towards.
I think when long animation frames first came out, I think the thing we were all really excited is the fact we could begin to tell what scripts were doing to our pages.
And in a Loaf entry, we get this array of scripts down the bottom. What we get is an entry for each script that took more than 500 milliseconds to execute. So we were thinking we can tell what scripts are executing our page. We can begin to point the finger at marketing and say, look, all your third parties are wrecking our performance. We would have the data to do it. So for each script we have some time stamps. So we have a start time, we have an execution time, it starts executing.
We don't get it for cross origin scripts, but that can give us a clue as to how long the script took to compile, if that's relevant. And then we have duration.
We have some things like we can time how long a forced style and layout took. So we can understand whether our scripts are increasing our render time, and particularly around thrashing. There's also the time it gets blocked for things like synchronous xhr. But I don't think I've seen a synchronous XHR in the wild for many, many years.
We seem to have done a good job of eliminating those.
So we can find out what script executed here. It's script.js from example.com the source function name is the top level entry function and then the source child position is the file it came from. And this can be useful data. We don't actually find the entry point or source function name that useful. When we looked at data, we can look at why did it execute. In this case, somebody clicked something, but it could be because somebody posted a message, a timer ran. So we can get some information why it executes and we can begin to aggregate this data and roll it up and look at it at a page level, look at IT across site level and we can begin to expose the frameworks that are not delivering great performance or having a bad impact on our visitors experience. This is Selfridges. I chose Selfridges who are UK retailer because they're not speakers customer.
It doesn't seem fair to pick on speaker of customers particularly if we want them to renew. But what you'll see in this data is if I do this we begin to see self register built on a Next JS framework and the scripts that are executing for the longest time on this page are first party scripts, then next JS and this is a single view of Selfridges page and all Selfridges pages like this.
I'm lucky that I have a data set I can look at of rum data from customers who do use Next and there's a similar pattern when I look in our run data at customers who are using Next and it's clearly identifiable NEXT is a problem for their performance.
It is affecting their visitors experience.
So we can start to use this data to hold people to account. We can hold ourselves to account. Is our performance problem us or the third party tags that other people are installing? In the same way we might get many long animation frame entries per page. Obviously we can have multiple script entries per long animation frame. So we get multiple script entries here. I profiled Selfridges homepage on various different CPU slowdowns and you can see as it gets slower we get more entries. So in this case you'll get more entries hopefully from your worst performing people.
And having this script information helps us answer more data, helps us answer more questions, helps us answer which scripts are the problem?
What script should I tackle? Which ones are having the most impact?
What scripts run before fcp? What scripts run between FCP and lcp so could potentially slow it.
Ethan talked about time to perform a task so we could measure what scripts interfere with somebody filling in a form or completing an address with auto. Look at autolookup.
The other thing it can help us is debug slow interactions.
Interaction to Next paint is a good metric in my view. You know, it's from when we click on the search button, you know it's gray here, it's gray in the uk. I thought, you know, wouldn't it be nice to the Cape Verde Isles tomorrow?
So when we click on the button to search for those flights, it measures until the time we get the next frame presented. And there are three phases or subparts to inp.
It's the time we're waiting for the event to be handled the actual time of handling the event and the time of presenting new content onto the screen. And I think about it actually in two phases.
There's the time we're waiting for other tasks to complete, and there's the time we're waiting for the work that's in our event handler to complete. And we can kind of debug this second part. In DevTools, you've got to know what the interaction is, but you can debug it. And you're only, as Tim said, we're only debugging it in local host environment. We're debugging it in our own context rather than the visitor's context. So some other things might be happening in the real world, but this is harder because this depends on what's executed, isn't it? This depends on what's executing when the visitor interacts. Is our tag manager still loading?
Is an ad script running? Is session replay doing something? So this is harder to measure and harder to diagnose what's going on.
In speedcurve, we plot INP by page label.
We can break it down, and if we look at the plp, the product listing page, we can see it's got quite a long input delay. And debugging this in DevTools, it's hard. But unsurprisingly, long animation frames allows us to debug it in the wild, to gather data in the wild. Unfortunately, there's no direct way to link event timing entries, which is what INP is constructed from to laugh. So we have to use timestamps.
And in this interaction we have three long animation frames. And we're going to start with the one on the end. If you remember about 40 slides ago, there was a section that said GPU on the end of the long animation frame. And when the frame has been sent to the gpu, the main thread is then free to start on the next frame.
So here we've got a loaf that finishes after the frame is being presented. So that's work on the next frame, it's not this frame.
So we can remove it. And then we'll start on the beginning and we can see that our visitor has interacted partly way through a task that's running. So we probably don't want the piece of script execution before they interacted. So we can take that off and then we're left with these full and partial chunks of JS execution time. And we can identify which scripts to assign to which subpart of inp.
And you can visualize like this. This is A table.
In this case, we can see that Telium Tag Manager was running when the visitor went to interact. And then we can see some scripts that run as part of the interaction.
There are two ways of calculating inp. You can either look at the single longest INP or event timing entry, or you can look at event timing entries that are from the same frame. And that's what Web Vitals does, it's what Chrome does. So how they actually get assigned varies depending on the process. But we can finally begin to understand which scripts are causing input delay and think about how we mitigate that.
Having this answers lots and lots of questions, but there are some challenges. Sometimes we don't get any source information.
I can't quite remember the pattern for this. Sometimes we don't get a URL.
If you use GTM to inject an inline event handler, we'll often get no source information.
Wrappers Friends at New Relic write a wrapper that wraps your JavaScript.
Unfortunately you end up with this where for every encrypt entry, the source file function name is nrwrapper and the source URL is New Relic js. There is a proposal to try and help mitigate this. I don't know where it is at the moment. The other challenge we see is we encourage people to version URLs so they can be cached forever. Our build processes do it so you end up with hashes or version numbers and URLs, and depending on how consistent they are, this can be hard to track across time.
And what we do and what some other people do is take the hashes out to try and normalize the file names to make it trackable across time. But one day, probably a year and a half ago, I think we when I was investigating Loaf, understanding what we could do with it, understanding what questions would answer. I came across this as a source URL and I was puzzled.
I actually raised the Chrome bug for it. And then somebody said to me basically, don't be silly, this is intended behavior. Because long forgotten was this directive, the source URL directive, so we can name sources.
It was originally made for inline scripts in the body, but you can use it in external scripts. The program colon two is actually a script from a third party called Forta. Now quite what's going on with their build process to create this entry, I don't know, but it means we can name scripts and it works for external scripts. There's a demo here that if you click. If you load this page and click anywhere on the body, you get A Loaf entry where the script name is.
Use the source URL Luke Spot the boy who comes from a Star wars household we don't get script entries for extensions. As people operating sites, we have no business knowing what extensions our visitors are using. When Erwin did a talk on Loaf at the meetup two years ago, you could still get information on extensions but you can't anymore and we don't get any entries for garbage collection. It would be really nice to have a pay attribution for these so that when we look at the work duration that our Loafs are doing, we can eliminate extensions so that we can tell what's us and what's our visitor. The good thing about extensions is depending on what market you're serving, what segment you're serving, a lot of your scripts, a lot of your visitors will be on Android and Android doesn't support extensions anyway, so having opaque attribution for these would be good.
There are some tools and things out there you use to investigate, so here goes. We can see how good my Catalan is. We can see how good Estel's teaching is. Joanne Leon or Leon has a bunch of scripts that do various things of querying the performance APIs in the browser from everything from LCP to Loaf that are well worth experimenting with and help understand the data. I wrote an extension that you'll have to load unpacked that will produce that middle row to visualize Loaf against the main thread when you profile pages.
In case you haven't guessed, I'm quite a fan of Loaf. It's knowing what's going on in our visitor's browser has been been something I've wanted to know for a long time because if we can't measure something, it's hard to know what we need to do to improve it other than just say delete all the JavaScript.
But that's probably something we can't do. Loaf provides an insight into the runtime costs of the code we ship. It allows us to identify the problem scripts within the context of our visitors environment because our visitors environments are really really varied. But to get it, you're gonna need rum.
Crux is never going to do much of this stuff for privacy reasons. You should also buy rum because you really want LCP from Firefox.
And when it comes to Safari, if you want to talk to people about rum, Matt from Debugbear is here. Caroline, Jordy and Irwin from Rum Vision are here. Me, Cliff and Tammy from Speak over here and we all support laugh.
Sometimes I feel like I've Just scratched the surface of what, what life is capable of. Every time I spend more time looking at it, I think of new things and I think there's a potential to explore it and push it further and understand how it can help us understand what we need to do to improve our visitors experience. And finally, for those of you flying out tomorrow, you can go visit the Loaf Cafe in Schiphol.
I hope you enjoyed it. I will put the slides online, but thank you very Thank you so much, Andy. I think we're going to steal a couple of minutes to take a couple of questions if that's okay, if that suits you.
What if I say no? Well, then I guess it's early coffee for everyone. Thank you all for submitting questions.
There were a bunch that came in and we'll just cherry pick a couple just to try and get through. And one of the first ones that came in was really about trying to decide what a good number is. You showed that chart that went off forever with a very long kind of total duration.
How do we decide what a good target is? I mean, Tammy spoke yesterday about setting good goals and like contextualizing goals.
Is there a definitive this is a good number or a good target? How, how do we arrive at that? That was one of the questions that came in.
So my answer that goes back partly to what Tammy talked about is look at run data, look at how changes in metrics affect your visitors behavior. Right. You know, we saw there that people who have faster experiences spend more time on your site. If you're a retailer, the number of product pages somebody looks at is a good indication of where they're likely to buy. So there's no quite one size fits all. And that certainly doesn't apply. That certainly applies across the world. You know, in the Western Europe we're used to fast experiences, we expect fast experiences.
In other parts of the world, they're used to slower experiences.
So the fact it's slower for them but they're normal means it doesn't change their behavior as much. Right. Okay, fair enough. So, yeah, so very much echoing the. There's a certain amount of it depends. And of course it always depends. It always depends. I know that's the stock answer, but that makes perfect sense. There's also another question that came in from Andrea on Bluesky, talking about identifying the, tracing the source of the issue and finding the source of the function that was actually causing, you know, a long task.
Are there particular tools and techniques that you're keen on for identifying those or is that baked Right into the dev tools already. I mean, Andrea mentioned a VS code extension that helps find the source of the particular function that was causing the issue.
Or is that something that's still. I tend to. So once I'm looking at trying to identify the problem in the wild, it becomes, okay, how can I look at this in dev tools to see what's happening? And sometimes if you're trying to simulate input delay, you may have to do many traces to click at the right moment. There is a gap there that still relies on us as developers to be able to use our development tools in the browser to get the final piece of debugging. Sure, yeah, that makes sense. I've also got another question which is less about the nitty gritty of the technology and more about the impact for people and people working on the project.
And I was kind of curious about this myself and Vincent echoed this.
By the Q and A form, you showed some aggregated data about different clients, different projects and where you've seen different impacts and you identified, you know, next as being something that was. Was causing some issues. I was curious myself about how receptive people are to change and, and how those things address it. And Vincent was, was echoing that. I mean, Vincent went straight in with, did they drop it? Did they change? And I suspect, I suspect not, because changing an entire framework is a hard thing to do. But are there ways to address those issues that we see commonly in particular frameworks? And I'm just curious about how receptive clients are to the insights that come from these things. It's hard.
I don't think there are easy things to solve in performance, and there are harder things to solve in performance. And I think the challenge with the next JS situation is, you know, companies have already spent a hell of a lot of money investing in building a site that uses that technology and changing it is difficult. You need compelling reasons. You almost need to do it as a guerrilla project over time without telling anybody.
But then you have the challenge of how do you know you made the right choice, what you switched to? It's the whole challenge of we've grown up on hype driven development, particularly when it comes to JavaScript frameworks and AI is probably only going to make this worse. And it becomes how do we pressure and expose, pressure those framework makers and expose the issues and encourage them to fix it. But then even then, you've still got the migration problem, the cost of moving to the next version of the framework. So there are no easy answers.
There are no easy answers. But I guess I guess things like this are all good grit for the mill, right? They all help us make the case.
They all help us feed into the things that Harry was talking about in terms of thinking like a performance engineer. They're influences.
Andy, thanks so much for the talk. I know you're going to be around, people can ask you more questions. But for the time being, our thanks again, please, for everyone, for Andy Davies. Thank you. Thanks,
- HTTP Archive
- Long Tasks API
- Long Animation Frames API (Loaf)
- 60 frames per second
- Largest Contentful Paint (LCP)
- requestAnimationFrame
- ResizeObserver
- Intersection Observer
- getComputedStyle
- getBoundingClientRect
- Chrome Canary
- Chrome Extensibility API
- DOMContentLoaded
- async and defer attributes
- module scripts
- RUM (Real User Monitoring)
- Performance Timeline API
- speculation rules
- Interaction to Next Paint (INP)
- blocking duration
- Total Blocking Time (TBT)
- derived metrics
- frame rate measurement
- synchronous XHR
- sourceURL directive
- DevTools
- Tealium Tag Manager
- New Relic
- Web Vitals
- CrUX (Chrome User Experience Report)
The Long Animation Frames (LoAF) API provides data on what Main Thread activity caused a long frame, overcoming limitations of the Long Tasks API. Learn how to use LoAF to understand and improve script performance.