How to Think Like a Performance Engineer
Setting the Stage: Tim’s Introduction and Harry’s Talk Framing
Tim warms up the room with a lighthearted introduction, underscoring Harry’s credibility as a trusted performance consultant and clear explainer of complex topics. Harry then reframes the talk’s title, emphasizing that his goal is not elitism but sharing a practical ethos for newcomers: how to approach web performance so tests are believable, repeatable, and aligned with real user experience. He positions the session as guidance for people grappling with lab versus field data and stakeholder pressure from PageSpeed Insights screenshots. This sets the context for a methodical, evidence-driven mindset behind “thinking like a performance engineer.”
Tools Landscape: CrUX, Treo, DevTools, and WebPageTest
Harry introduces essential tools he’ll reference, starting with the Chrome User Experience Report (CrUX), which he credits with democratizing performance by surfacing real-user data across sites and competitors. He demonstrates Treo as a free, graphical front end to CrUX for quick triage and competitive analysis, and contrasts self-selecting audiences (PerfNow) with broader properties (Financial Times). He briefly notes DevTools and calls WebPageTest the gold standard—a forensic wrapper around DevTools that preserves rich snapshots for analysis. This segment grounds the talk in accessible, free tools that support reliable, field-informed testing.
Choosing What “Fast” Means: Core Web Vitals and Benchmarks
Harry stresses that teams must first agree on “which number on which dashboard” defines success to avoid costly misalignment mid-project. He recommends starting with Core Web Vitals—LCP, INP, and CLS—as the most pragmatic, if imperfect, baseline for new efforts, while aspiring to add business-specific metrics over time. He highlights that LCP can misrepresent importance depending on context (e.g., a banking logo vs. account balance) and frames these as solid off‑the‑shelf KPIs. The message: establish a clear, shared benchmark to make progress measurable and unambiguous.
Enabler Metrics and Percentiles: TTFB, DCL, and Why P75 Isn’t Enough
Harry introduces “enabler metrics” that influence core outcomes, focusing on Time to First Byte as a compounding milestone whose problems often stem from many layers (server work, network, infrastructure). He adds DOM Content Loaded as a pragmatic proxy for SPA interactivity when you lack custom RUM, illustrating a British Airways example where DCL lag creates a frustrating gap after LCP. He explains P75 as a common aggregation but argues it’s too unambitious for reliability, urging teams with custom monitoring to target P95. The segment reframes how to read distributions and pick metrics that reflect real user experience, not just best-case averages.
Building Trustworthy Lab Tests: URLs, Devices, and Realistic Conditions
Harry outlines the pillars of synthetic testing—reliable, realistic, repeatable—and shows how defaults often undermine them. He advises selecting URLs guided by Search Console, analytics, and commercial priorities; then aligning device coverage to actual audiences while watching for survivorship bias. Using Apple’s traffic mix and Chrome-only datasets as caveats, he urges testing where your users are. This establishes a disciplined approach to choosing what to test before tuning how to test.
Right-Sizing Network and Locale: Aligning Synthetic Tests to Field Data
Harry critiques pessimistic defaults (e.g., slow 4G on low-end devices) that produce results wildly slower than real users, citing Apple’s ~3.2s P75 versus Lighthouse’s 21s. He recommends iterating WebPageTest connection profiles until synthetic LCP approximates your CrUX P75, then choosing the next-slowest profile to stay conservative. He extends the method to geography: match each region’s tests to its local P75 and run from regional agents (e.g., Brazil, South Africa). The takeaway is to calibrate lab tests to field realities so outputs are relevant, comparable, and actionable.
Beyond Cold Starts: Cookies, Caches, and Scripted Realism
Harry argues we over-index on worst-case cold starts because tools and “Disable cache” defaults bias us that way. He shows how the DevTools Application panel (local storage, session storage, cookies) provides context to script realistic states, starting with cookie banners that inflate every lab run. Using WebPageTest’s scriptable API, he demonstrates accepting/rejecting cookies and separating those phases for clearer attribution. The segment’s theme: inject realistic state into tests so you measure experiences your users actually have, not just first-visit pessimism.
Testing Real User Flows: Carts, Journeys, and Hidden Regressions
Harry shows how testing an empty checkout is meaningless; instead, he extracts cart state from localStorage and passes it into WebPageTest to simulate a real cart. He then contrasts direct-page tests with a realistic journey (Home → Schedule → Speakers → Profile), where warm caches and primed resources cut LCP by more than a second. Investigating a field-only TTFB regression, he manually clicks through and spots a costly breadcrumb-induced redirect that scripted URL navigations would miss. The lesson: script journeys and interactions, because the “fun stuff”—the impactful, hidden issues—lives in realistic flows.
Measuring SPAs Properly: Soft Navigations and Scripted Journeys, Plus Key Takeaways
Despite his skepticism of SPAs for e-commerce, Harry demonstrates that soft navigations can outperform hard ones—and that naive “navigate” tests miss SPA benefits. He shows how to use WebPageTest’s executeAndWait to click real links and capture SPA transitions that better reflect user experience. He closes by urging teams to design tests for their context, include varied scenarios (cold, warm, multi-page), and remember that off-the-shelf tests surface low-hanging fruit while deeper value hides in user interactions. This aligns with the talk’s core ethos: engineer tests that mirror reality to earn trustworthy, repeatable insights.
Audience Q&A: Coverage Depth, Non-Chrome Data, and Pessimistic Tests
In Q&A, Harry explains deciding test depth by cross-referencing RUM and analytics: segment by what you know about users rather than brute-forcing every scenario. On non-Chrome coverage, he notes Safari often appears faster due to platform optimizations and shares a heuristic for extrapolating missing metrics, while emphasizing the need for your own RUM to capture multi-browser truth. Finally, he clarifies that cold-start testing is essential but shouldn’t be exclusive; optimize for slightly pessimistic conditions while also measuring realistic, multi-visit flows. The exchange reinforces his systematic, data-driven approach to credible performance engineering.
So next up, Harry.
Yeah, I get it. No, it's good. This was an intentional. I have to be nice now. No, I just. First off, before I introduce Harry, there's one thing that it's really, really important for me to know, for all of you to know.
I feel like he's not actually taller than me. It's like he's got.
No, it's. He's got these shoes, and I've got, like. These are, like, barefoot. So that's why I just wanted to explain that. No, Harry. No, Harry is independent web consultant. Performance consultant.
I think I'm on record as saying that there's a very short list of performance consultants that I would wholeheartedly trust with a project, and Harry was near the top of that list. It's in writing somewhere, so I can't take it back now. No, but Harry always does fantastic analysis. If you read his blog posts, they're always very thorough. They're always very, extremely well explained. Even the most technical of concepts.
He just makes them very, very approachable. So, honestly, for a talk called how to Think Like a Performance Engineer, I can't think of anybody better equipped to give that talk than Harry. Also, you know, claim to fame for Harry is that he once borrowed $20. You know rich Harris, who's speaking tomorrow? Yeah.
He once borrowed $20 from Rich Harris. Now, there's a little bit of intrigue there.
Here's the question that we don't know a, did he ever pay him back?
I'm not sure we're gonna find that out. Maybe secondly, was that Harry who asked me to say that, or maybe Rich is looking for his 20 bucks and he slipped me a little bit of a note. I'm not sure. Stay tuned for the next two days and hopefully we'll get the answer to that. But, yeah, Harry. Cheers. Thank you.
Hey, everyone. That's a very nice intro, Tim. I'm glad you could read my handwriting.
Right. So when I wrote the title for this talk, I didn't really. Okay, actually, I'll reword this. I wrote the title for this talk before I wrote the talk itself. And now, in hindsight, I'm not particularly keen on it.
It sounds a bit pretentious, like performance engineers somehow know better or know more than everyone else. And that's not my point. With this talk, it's not to be righteous. The point of this talk is more to share with people perhaps new to web performance engineering, people who aren't really sort of very experienced.
Tim Cadlek, how might one approach web performance Engineering in a way, you get sort of test results that you can trust. This talk goes out to anybody whose boss or client or manager has emailed them a sort of PageSpeed Insights result.
And you're kind of terrified that, well, no, the site is faster than that.
The lab tooling we're using doesn't represent the field experience.
And how do you reconcile rum and synthetic data?
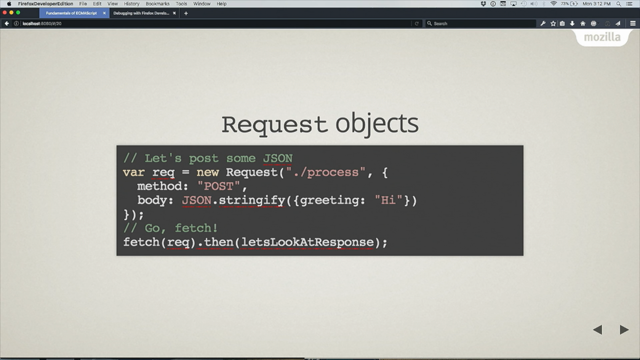
How do you run tests that you can trust, that are believable, that are repeatable? So my talk is more kind of an ethos, my own ethos, how I approach performance engineering and sort of brand new performance projects from a fairly sort of zero baseline, from a start of a project. So yes, I'm Harry, I'm a web performance consultant from the uk Independent. You can find me virtually anywhere online as CSS Wizardry. I picked that domain name when I was 17 and it sort of stuck. And yes, Rich Harris, it was actually Euro. But you know, Tim's American, that's fine. Rich Harris did actually once, he did lend me €20 and I did pay him back because he said if I don't receive repayment in 72 hours, I will rebuild all of the New York Times on react. So I paid, I paid. But yeah, Rich did actually lend me €20, which I think is quite cool. If you're into performance engineering, you might also be into OBs JS. It's something I built recently, a tiny little utility that just helps you make your site faster in an adaptive sort of scenario. If you're into web performance, you may like OBS js.
And yes, I am a consultant performance engineer, which means I am probably the luckiest boy alive. I get to work with really wonderful clients, really amazing clients from a completely sort of a very broad spectrum of industries. And all of these people on this screen at some point have had to run some kind of performance test.
And most of them to start with at least, have gotten it wrong. Not through their own fault. Sometimes it's the tooling that we've been given, sometimes it's the sort of the knowledge, the instruction we've been given. Sometimes our defaults are just wrong. And a lot of this talk is about how to recalibrate those defaults and run tests that work for us. I'm going to do a quick introduction to a few tools. I'm not going to deep dive on any of them, but this is mainly just a refresher or just to make sure we're all on the same page so that when I mention any tools later in the talk, we all know we're thinking about the same thing.
So who's heard of Crux? And presumably.
Yep, that's sort of just, I'd say the majority. You may have heard it known as, or, sorry, you may know it as the Chrome User Experience Report. This for me was a huge, huge turning point in our industry in web performance engineering.
In my opinion, the Chrome User Experience Report, or crux, democratized web performance. A lot of people, through no fault of their own. Well, now I guess it is fault of their own, had no idea if their site was fast or slow or not.
And Crux democratized web performance.
It's imperfect, but it's bad. Better than what we had before. Now, all of a sudden, the Chrome User Experience Report lets you know how fast your site is and your competitors for real people. So what happens is when you install Chrome and it asks you, are you okay with grabbing telemetry, crash reports, et cetera, et cetera, and you click, yep, I'm fine with that.
One of the things it will now do is it will beacon off user experience data. Every site you visit, every page you visit, Chrome will beacon off how fast or slow or whatever the metrics are for the pages you visit, and it beacons all that data off to a SEN public repository known as the Chrome User Experience Report. There are several ways to access the data in this data set. Very sort of API led, very sort of programmatic ways of mining the data. One of my favorite ways of accessing this data is through a tool called Treyo. Anybody heard of Treyo?
Oh, that's not enough. So, Treyo, everything I'm going to show you in this talk, by the way, is free. So dive in, experiment with these tools.
Treyo is built by a friend of ours, Alexei, and Treyo is a very sort of graphical way of looking at the data that the Chrome User Experience Report sort of gathers. So if you look at the Perf now site, which is, I mean, it should be fast, shouldn't it? But a 0.4 second LCP, I think that's even faster than Tim Verico.
I don't know if he's in the room yet, but we've got you beat.
So Perf now, it's a bit of a. I don't know, it's a bit of a ruse, right? Using a performance website who. Basically, when you segment this based on desktop, by the way, we only get traffic for like three months of the year, but it's all fast. But this is real user data. This is how real people using Chrome experience the perfnow website, but it's a bit self selecting. People looking at the PerfNow website are probably going to be on fast connections, ironically mainly on desktop because you're looking at, you know, actually this is really interesting. Specifically around the weeks of the event, mobile traffic goes up because you're all in the room trying to find where what time the next break is or you're in your hotel trying to find where the venue is. If we look at a slightly more global website, let's look at the ft. Anytime someone visits the Financial Times website, this data is getting beaconed off to this central repository we can just look at now. For me as an independent consultant, this is great for doing early analysis on clients who haven't signed on the dotted line yet. It allows me to do early triage as a site owner. You can do competitor analysis. You can go and see if you, if you're the ft, you can go and see how Bloomberg or how the Economist is doing. You can spy on each other. DevTools. I'm not going to explain dev tools to a room full of web developers. So we're actually going to talk about DevTools. Very, very little. If you want to know more about dev tools, you can hit this URL and I'll share this with people like in the breaks, whatever.
I'll give you a link to this. I did an entire course on how to set up DevTools to be hyper forensic. Go and grab a discount at that URL there. Web page test.
Anyone remember that?
It's Halloween, so if you wanted a horror story, all the screenshots are now going to be out of date ui.
But the same rules still stand. We will look at webpagetest a lot in this talk. UI is different. The rules are still the same.
Webpagetest is the gold standard in performance engineering and testing. Like lab testing, it's hyper forensic. The interesting thing is webpagetest is actually just a wrap around dev tools. It's no more complex than that.
So if you're used to using dev tools, WebpageTest is just a hyper forensic static screenshot. Not screenshot, sorry, a static sort of snapshot.
That's what I'm looking for of DevTools. Okay, that's the tools. That's the brief introduction. Let's talk about the metrics that matter. What are we actually going to measure? This next slide is going to seem painfully obvious to most of you, but it's really important that we agree on this thing. Agree on what you're benchmarking I have worked on commercial projects worth hundreds of thousands of euro where stakeholders are not actually agreed on what fast means. I've been hired to work on projects where people have six weeks in, two months in you've got two very important stakeholders who are looking at different dashboards to define fast. So one of the first things I do on any project is which number on which dashboard of which tool are we all looking at that we agree the project is done, it's finished, we're fast.
This sounds painfully obvious. This has happened twice this year for me on high profile clients where they've got ideas of we want a 1.2 second LTP. Is that crooks rolling average? Is that in datadog? Is that in speed curve?
Is that in something else? Is that in synthetic tests? It's very important to dial this one in. The metrics I would recommend and Tammy mentioned these in her talk just now. But core web vitals on a fledgling new project I genuinely think the best place to start is core web vitals. For years web performance and its metrics have been a bit of a vague target, fairly loosely defined. Core vitals I think are very elegant and again imperfect, but a very elegant and so far other than speed index. Thank you Pat. Probably the most elegant metric we have to measure performance. So I think this is the easiest place to start. And the trio of metrics Largest Contentful Paint how quickly could we see the main body of content now? Largest Contentful paint is useful if you're an E commerce site on your product details page. But if you're running a banking application, largest content of paint may be your logo, whereas the most important bit of content is probably much smaller than that. Perhaps it's the bank balance. These are imperfect but off the shelf. You'll struggle to find a better suite of metrics.
INP interaction to next paint. Is it responsive to user input? Is it going to feel sluggish to use after it's loaded?
Finally, CLS cumulative layout shift. Do things move around the page as the page is loading or as we're using the page and if so, by how much? Cls, interestingly, is the only sort of non time based metric, but is still a potential measure of user frustration.
I would honestly recommend starting here as well as this suite of metrics. Okay, I would recommend starting here.
The ultimate goal would be to have very business facing custom metrics.
But this is an intro to web performance. So I would start here, but I would also fold in a suite of what I call enabler metrics. Metrics that help us get to where we need to be stepping stones, if you like one of those. And for me, one of the most interesting is time to first byte. One thing I find very interesting about time to first Byte and our industry in general is this constant overcorrection.
When we had sort of websites in the olden days that were server rendered, we'd have generally we'd tend to have time to first byte issues because of database reads or file system reads or whatever you like, API calls on the back end. Then we went fully client rendered and every site had a great time to first byte because it was just shipping an empty div ID app. Nowadays, thanks to JavaScript, we've reinvented server side rendering and what I'm seeing is clients are now battling time to first byte again because we're actually putting work onto the server. So time to first byte is a really interesting one to measure.
The reason it's important is it has a knock on effect. It's a milestone timing. So if you've got bad time to first byte, you're going to spend a lot of time trying to sort of COVID sort of lost ground getting to your actual KPI metric, which is probably going to be lcp.
A wiseman once said, while a good time to first byte doesn't necessarily mean you'll have a fast website, a bad time to first byte almost certainly guarantees a slow one. The wise man was me, by the way. It's very tasteless, isn't it? But time to first byte is not a metric in and of itself. Your users, your customers, will never notice a time traverse byte. Ideally they don't even know what a timed first byte is, but it will have a compounding knock on effect. Now this slide, well, if you can memorize it, I'd be very impressed. Just commit this idea of this slide to memory. This slide is going to come back later in the talk. Time to first byte is a bit like that drawer in your kitchen where you don't know where to put something, so it just goes in the drawer with everything else that you never really worked out where to put. Time to first bite is a bit of a black hole. Debugging is very, very important and it's also very, very difficult. We're going to come back to this slide in a minute. Anything? Well, any Robin's sort of squinting.
My point is anything on this slide could be a contributor to time to first byte. If you're looking to optimize time to first byte, you've got to go deeper still. And anything on this screen is a potential candidate for optimizing time to first byte. Another interesting metric that I recommend clients look at and this is available in Crux in the Chrome User Experience Report available for free. Is DOM content loaded?
This is what most people would consider a legacy metric, a bit of a relic.
Is anybody here building a single page app?
You probably shouldn't be, but that's a separate conversation.
Don't get me started. Okay, if you're building a single page app an spa, there's every chance that the framework you're using either uses type equals module or deferred JavaScript.
If you aren't capturing your own metrics, if you're not using Dynatrace, Datadog, Rumvision, Speed Curve, if you're not using any of that, you have to lean on something like Crux. A good proxy metric for app interactivity is DOM Contentloader. Because DOM content loaded effectively is all your deferred JavaScript has finished running.
This is a really useful metric to know because this signifies OR Signals Deferred JavaScript has finished running. Now it doesn't tell you if it ran successfully. It could have run and just completely errored. It could have run, but then there is still knock on work to do to fetch API calls. Sorry, API calls fetchers to fetch content to populate a page.
But a very cheap proxy metric is DOM content loaded?
Has your deferred JavaScript run yet? So if you look at the British Airways website in Australia, we see that DOM content loaded is at 3.8 seconds. Now there is no such thing as a good DOM content loaded. It's an invisible metric. There's no such thing as a good DOM content loaded.
But we do know that Google have told us a good LTP is 2.5 seconds. Let's say British Airways hits that 2.5 second LTP. But their average or their sort of aggregate DOM content loaded is 3.8 seconds. That's a 1.3 second delta where the page is rendered. The largest contentful paint has happened, but the deferred JavaScript hasn't run until 3.8. That's a 1.3 second delta of potential user frustration. Okay, well We've got the 2.5 second LTP ideally, hopefully, but the app hasn't booted until 3.8. That's 1.3 seconds where the hamburger doesn't work or the searches you type for your nearest airport isn't responding. So it's a very cheap metric and it's a proxy at best. But in the wild DOM Content loaded is a good proxy for app interactivity or availability. This 3.8 seconds, and I mentioned, I said average and then quickly reworded to aggregate.
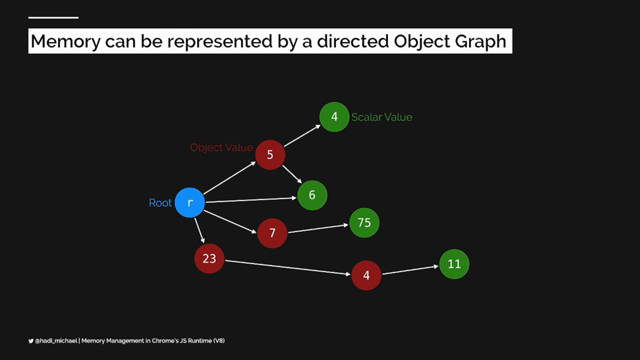
This 3.8 seconds represents the 75th percentile. And one thing we're going to look at in this talk is we have a very diverse array of basically users and user experiences, page views, scenarios, circumstances, and it's very, very hard to summarize an entire website's performance with any one number.
So what we do is we look at the 75th percentile. And the way this works, if you've got a site like mine, which gets about 100 visitors a month, it's very easy to work with 100 numbers, 100 data points. What you do is you take all 100 visitors and you put them in order of slowest to fastest and you count all the way down the line until you find the 75th experience. And what you say is okay, anybody that just turned pink, we've got to keep you happy. We're going to make a site that's fast for 75% of you.
So P75 is a pretty big number. In fact, to contextualize this, during the outbreak of COVID in the UK, BBC.com they sort of experienced or they received 1.5 billion page views in the month of March 2020. That means for the 75th percentile, we need to keep 1.125 billion people happy.
That's a huge number, but it's not big enough. I don't know how. As performance engineers, front end performance engineers, we settled on the 75th percentile. Anybody working site reliability SRE? No one.
Well, I mean, it's safe. You're all at work then.
Hope none of you are on call. If you're into SRES, reliability engineering uptime, you look at 95th, 99th percentile, 75th percentile is really unambitious.
Well, let's put it another way. If someone told you only 25% of people who ate at this restaurant got food poisoning, you wouldn't fancy those chances, would you? 25% is an entire. It's a huge number of people to just forget about. For the BBC, that's like saying we are okay if 375 million experiences aren't good enough. So we've settled for some reason on the 75th percentile. As an industry, I encourage my clients, especially if they have custom monitoring optimize for the 95th. I don't know how it's happened, but business owners are completely okay with saying 25% of our customers give them a bad experience. We don't mind. We've settled on the 75th.
I'm not sure why. I mean, it does make my job a bit easier, but be a bit more ambitious. Aim for P95.
When I'm working with clients, teams, especially engineering teams, we need to look at our testing, our test setup.
We've got reliable, we've got realistic, or we've got repeatable.
Pick all three. This part of the talk, I'm going to show you how to write tests or build tests, structure tests in such a way that you can share them with colleagues. You can read the same data, you understand you have a shared language, you can run the same test in three months time and trust the outputs just as well as you can. Now, one thing I find with most testing tools is that their defaults and their baselines aren't actually that helpful. So what I'm going to show you is how to tweak and configure tests in such a way that that you get all three. One of the first things we need to work out when doing lab tests, or when we are doing synthetic tests, diagnostic testing, one of the first things we need to work out is what test conditions are we going to run under. We have got basically four things we can choose here.
Basically four. There are more, but for the sake of this talk, we have got things like URLs. Which pages should we test? Which device types are we going to test, which connection speed should we test over and which geographic locale, if any, should we test from?
There are parts of this section that get a bit thorny. They get a bit messy. So please bear with me. But we'll step through it now. URLs, this is the easy one. You should know which URLs to test. You should know if you're an E commerce site, then it's going to be things like listing pages, product detail pages imperative if you've got marketing campaigns, marketing landing pages are going to be important. You should know your own URLs. Interesting dark pattern. I shouldn't probably say this on stage, but we know that faster sites convert better. So if your Product details page wants to convert better, you'd make it faster.
Someone unsubscribing is technically a conversion, right? So make those pages slower.
Source them from Search Console. Search Console is a cheat code, especially if you're optimizing for SEO purposes. Search Console will just tell you which pages to optimize and then things like analytics, commercial importance, knowing which URL to Test should be a fairly easy one.
Search Console if you're working on a fledgling project, a new project, one of the first things you should ask your client is can I have access to your Search Console account? This will tell you broadly what your to do list is. Device type Again, this should be fairly easy because you kind of know where your customers are and you should go to them. However, beware of survivorship bias. I remember, I'm old enough to remember when responsive web design was invented and I had clients say, we don't need a responsive site, we don't have any visitors on mobile.
Which one comes first? Of course you don't have visitors on mobile, you can't use your site on mobile. So beware of survivorship bias. But if we look@apple.com for example, we will see that the majority like slight majority of visits are on mobile. Still a huge amount of desktop visits for Apple. So I would give this equal weighting. And also this data is Chrome only. And also because Apple are scumbags, this doesn't include any iOS traffic. So again, this data isn't particularly representative. But make sure you test appropriately based on device type. Connection speed. This is the one that gets a little bit messy. But this part of the talk goes out to anybody who's had their boss or client or manager email them a screenshot of Lighthouse, who's had that happen to them. I once worked on a project for over a year and the client would still send me pagespeed insight reports.
Dude, you're making way more money. Everything's faster. I've proved it.
I wanted to edit his hosts file so that pagespeedinsights.web.dev or whatever it's called, whatever the URL is, I just wanted to point it to like dev. No, I wanted to get rid of this tool. But this goes out to anybody who's run a test that came back at 21 seconds only for you to implore and tell your boss, your client, your manager, no, no, the site is way faster. Now, 3.2 seconds for Apple isn't great, but it's roughly seven times faster than Lighthouse.
Told you. I'm not here to hate Lighthouse. You can do that for me.
But a synthetic tool that comes back roughly seven times slower than your real users. Useless.
That's not. That's not trustworthy data. So what we're going to look at is how we run tests that come back more accurate, more reliable, more relevant. My controversial take is that most tools today run over too slow. Defaults especially, again, a self Selecting audience. We're in sort of the Netherlands, we're in northern Europe. We're going to have people who are going to have fairly powerful devices, will have access to decent, even cellular signals.
Most tools defaults, especially for the European and North American audience, they're just too slow. Lighthouse running sort of slow 4G on a Moto G power isn't representative of most of our clients. I'm not saying everyone's clients.
And if I was giving this talk somewhere else in the world, I might have completely different advice. I've worked with Dutch clients a lot and I really enjoy working with Dutch clients. By the way, you're all very intelligent, but you're also very straight to the point. It's very productive testing anwb anwer bay over a slow 4G connection.
A Moto G power pointless. What a waste of everyone's time.
We need to run tests that are more representative of our actual customers.
The way I recommend proxying this is go back and look at that 75th percentile. So for apple.com, that 75th percentile globally was 3.2 seconds. That means that any test I run should come back with a number close to that. Not exactly that, but close to it.
Put another way, running a test that comes back at 21 seconds is insanity. That's not a useful test. We need to run tests that come back somewhere close to where we know our customers are or beyond. So what we need to do is find a test result that comes back somewhere between the 75th and hundredth percentile. And again, this can't account for situational bias or like, you know, someone could be on a fast connection but have just dropped connection for a little bit or something. This doesn't account for situational bias. But run tests that come back somewhere in this yellow zone the way I would do this.
And this is the cumbersome bit, this is the bit that's a bit Clunky is in WebpageTest or whichever tool you are using, it should be WebpageTest is we have got loads of options for connection speeds. This is the messy bit.
Every start of a project, I just run loads of disposable tests at different connection speeds until I get a result that mirrors something close to what a customer might experience. So I'm just going to run loads of tests at different connection speeds. Whichever connection speed sort of fits my audience, that's what I will use for the rest of that project. So in my tests of apple.com, what happened was LTE came back at 5 seconds, which is a 1.8 second delay or delta or straying from the 75th percentile.
So I think this is probably a fairly good baseline connection speed to represent the average apple.com visitor. I would never recommend running a test that comes back faster than your 70th percentile. Always pick the next slowest one. What we're trying to do here is pick a test or connection speed that mirrors something a little more realistic for your audience.
So yes, takeaway here is most tools defaults in my opinion are far too pessimistic. Try align your lab data with your real users geographic locale.
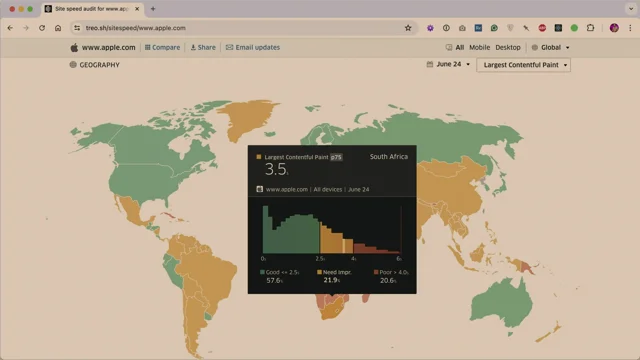
This only really matters if you operate on a global scale or not even global, but like a multi regional scale. If you only sell products in the Netherlands, there's no point testing from China. But if you work fully globally then this will be of interest to you. So for example, Apple in South Africa comes back at 3.5 seconds.
So again it's a similar number to 75th percentile. But as you move around regions, let's say you sell in Brazil, go and look at your P75 data from Brazil.
Then rerun webpage tests from a Brazilian data center or test agent in Brazil and make sure you test for Brazil come back closer to that figure. So tweak your geographic locale and connection speeds so they always marry up. You end up with a small like text document somewhere or something in confluence that says when testing from Brazil use these connection speeds.
Testing from the Netherlands, use these connection speeds.
All right, now I want to address something completely different. I'm going to change tact.
I want to talk about something that our industry talks about. I've actually never said this sentence out loud. I want to talk about something that our industry talks too much about, which I realize now makes me part of the problem.
Cold start scenarios.
This is something I really want to press home and really drive home to a lot of performance engineers. We over focus on the worst case scenario.
A cold start scenario is basically what every tool will give you out of the box. Most tools, if not all tools, start from a very pessimistic baseline. You go and run a Lighthouse report or you run a web page test. You're going to start from the very coldest possible baseline. DNS hasn't been resolved. There is no primed cache. TCP hasn't been negotiated. All these things haven't happened. Anytime you run a test from one of these tools, you're getting the worst possible scenario. And while at some point every user has their first ever visit to your website. It's not the most common use case. So a lot of our tools set us up not for failure, but they set us up for a very pessimistic default. However, it's not just the tools that do it to us, we do it to ourselves. You're all using this way too much. Your customers haven't checked this box.
Why have you? I'm deadly serious. We test. We seem to have this enabled all the time. None of your customers have ever checked this box and tried to buy something. They just don't even know it exists.
Ideally, but we seem to test every page view in this scenario, of course we get pessimistic results. This and webpagetest and Lighthouse out of the box will give us an empty cache with no user interaction. Yet things get warmer as you use them. And every tool off the shelf will give you the coldest possible measurement. It is very, very important to measure a cold start scenario. It's very important to measure somebody's first ever visit. But once they visited, there are certain things that are in place that are going to make their future experiences a little bit better. And that experience, it compounds.
So what you'll often find is your tests come back way more negative or pessimistic than actually represent real life. The whole point of this part of the talk is to give you a bit more optimism about the situation.
Cold starts also tend to show your most obvious issues. And this is really interesting to me. I always get emails from clients who say, hey, we've been working on this for months and we just, we've done all the, We've done all, everything we can. We've done everything we can, but we still haven't broken the back of this project. We still haven't got there. And it's because they're just running cold start tests. And a cold start test will show you that you haven't optimized, you've not minified your css. It'll show you that, I don't know, your time to first byte is too high. It will show you the easy bits.
The easy bits are the easy bits and you do those and still the site's going to be slow because we haven't probed into the deepest, darkest corners of the site. So test scenarios. This is the interesting bit, that P75 number we looked at, or ideally the P95 number we've agreed internally, that doesn't represent cold start scenarios. It represents every single person on this slide and infinite permutations.
That P75 number isn't the 75th percentile of people who've only visited your site for the first time ever. It contains any experience on the site that could be someone who's midway through a user journey.
They could have returned to the site two days later. Is your caching strategy working?
So that P75 number represents a very diverse array of experiences, so we should test as many of those experiences as we can.
So the Application panel, arguably the most boring panel in dev tools, but the application Panel is a treasure trove for giving tools this context. The three things we're going to look at most commonly in the application panel would be local storage. I appreciate this screenshot may be a little small.
I apologize. Local storage, session storage, and cookies.
These become a bit of a sort of treasure trove, a gold mine of context that we can pass into these tools. Cookie banners.
I don't know if it's good news. We left the EU because we still have cookie banners, right? Of course. I don't know why I said that, especially on camera.
It's terrible news. We left the EU and we still have cookie banners. Anyway, so what was it all for?
Cookie banners. These are an interesting one. Any tool you use off the shelf is going to give you a cold start scenario in which a cookie banner pops up and you make a load of changes to your site and you test it again and a cookie banner pops up. Your customers aren't seeing a cookie banner on every page view. Or if they are, it's their fault. Choose an option. Right?
Get rid of your cookie banner. But any tool off the shelf is going to show you a cookie banner. That's not a realistic way of testing a website.
Especially in the case of Amobe, the cookie banner is the page.
It's a terrible experience. But most of your clients, your customers, your visitors, they're not going to see a cookie banner on every visit. So we should script for that eventuality. So, using WebpageTest Scriptable API, let's tell WebpageTest to run an experiment or test rather, in which we accept or reject cookies. It's trivial.
Find your accept or reject button, right click copy selector. Then what we're going to do is just paste this into WebpageTest's script panel. I'm going to pull this out into a way more palatable slide in a second. So people taking photographs of this slide, if you wait a couple of seconds, WebpageTest has a scriptable API, set an event name called Home, navigate to the current URL in question, set an event name called Accept Cookies and then Execute and wait. This JavaScript snippet a more palatable version of that slide for people who wanted to take photos.
The percent URL percent is just a bit of a magic trick that just says, whatever URL you've pasted into the test, go to that URL. It's a variable that is just available to us and it means you don't have to repeat yourself.
Now what we get in webpagetest is we can visit the homepage and see what happens up until the cookie banner. Then we've got a second test that runs immediately afterwards in which we've accepted cookies and now we can isolate those two streams of work. This is way more useful than just having a cookie banner pop up every time. I haven't gone into detail in this talk just for time constraints, but we could also set a cookie preemptively that says, oh, go and test this page as somebody who has previously accepted or rejected cookies. So we don't see a cookie banner at all. These are the scenarios we should be testing. Shopping carts. Here's a really funny one, and I presume it's a majority Dutch audience. So this, this one speaks to you specifically.
Worked with a client over the last 18 months and when I joined the project, they were like, Harry, our testing setup, it's pretty sweet. I think you'll like it. We're testing loads of things. We're testing our checkout page. Obviously, it's a very important part of the funnel, testing your checkout page. Until he realized that you need really good eyesight and to speak Dutch for this. But to extract this onto a slide a bit larger in English, once a day they were testing an empty checkout. What's the point?
Hey, there are no products in your shopping cart. Why would you test an empty checkout page? Just going straight to checkout and testing it makes no sense. There's nothing in your cart to actually. It's not a realistic scenario.
So with the client I looked into, okay, how do you memorize or sort of notify the front end of the application of what is in the shopping cart? It was just a local storage key value pair.
Let's pull that out. Let's extract that information from the DevTools application panel. Pass that into WebpageTest. So now what will happen is you visit a page. We'll quickly add something to local storage before the page actually loads.
Then the application is going to get item and know that, hey, look, we've got something in the shopping cart. Let's test a realistic page. So after doing this, we now have slightly more realistic tests.
I'll just wait while people take a picture of that.
We've now got more realistic test because now webpageTest goes and visits the checkout URL and at least we've got a product in the cart to be tested. Even this isn't a very likely scenario, because who's going straight to a checkout page with a product already in their basket without actually going to the product page first? So even this isn't a worthwhile test. One of the things I go through a lot with my clients is throw most of your current tests away, don't go straight to a page and test it, because your customers must have got there somehow.
And unless someone's just sent them a link in WhatsApp or whatever, it's very unlikely they've just landed at a checkout page for the first time ever and there's a cool box already in their cart. So, user interactions and user journeys. How did people get there in the first place? This doesn't work for the perfnow website because Perf now doesn't have speaker pages. A conference I spoke at recently. Well, last week I wanted to test, you know, how fast is the speaker page. So I tested the ltp, the performance of the speaker page for my own profile, my own bio.
Very narcissistic, I know, but if you just go straight to my speaker profile page, this site got a 1.48 second, let's call it 1.5 second LTP. Now, that's actually really good. That's one second faster than what Google says is good. So this is really optimistic. And if this was your boss, you could tell your boss, look, we're a second faster than good. You could stop there. But again, the optimism part of this talk is that things are probably even better than you realize, because even someone as narcissistic as me isn't going straight to my own speaker page.
I'm getting there somehow. So we script a test that's more realistic.
We go to the homepage, then the schedule page, then the speakers list, and then, oh, okay, let's see if this guy knows what he's talking about and click on my profile page. All of a sudden, that 1.48 second, that 1.5 second LTP is over a second faster in more realistic scenarios. As you use a website, it gets warmer. You prime caches, things just get faster inherently. It's a compounding effect if you navigate the site more naturally. The bottom user journey version, we've gotten to an LCP event before the cold start even got to an FCP event. Now, don't get me wrong, the top version of the test is still fast. It was 1.5 seconds. But a realistic test is even faster. And this is the optimism you need to take back to your boss, your client, your manager. Again, I talked about a compounding effect. This is the work on the left. That's the work that you would have to do to go to the speaker page from a cold start.
This is what the majority of your tooling will show you. A more realistic journey to that page. You do the work on the right, it's far less.
No wonder it's so much faster. Even this isn't the same as a real user. Clicking on even that isn't a valuable test. What WebpageTest just did then was the equivalent of pasting URL into an address bar, hitting return and then going, I want to go to another page. Actually I'll copy the URL, paste it into the address bar, hit return. That's not the same as how people actually navigate websites.
Sometime earlier this year, I believe it was earlier this year, a client of mine, time to first byte went through the roof. Now I'm a very, very front of the front end developer. So as soon as it's time to first bite, I put the kettle on, I put my feet up and I tell the DevOps people to look into it. Not my problem. I can't fix it. I'm a front end guy.
But no amount of testing could replicate this. Time to this is real user data by the way. This is really happening. And no amount of testing that I ran could replicate this. I was asking DevOps engineers, have we re platformed, have we moved from like, you know, we getting cache misses, have we got what's gone wrong, what's happened? No amount of testing could replicate this.
Now at the top of the talk, I showed you a slide with loads of different time to first byte things on it and all these things are back end things. That again, not my fault, not my problem. I've gone to make a coffee.
Except one thing. There's one thing on this slide that happens on the front end and this is what all of our testing was missing.
If you just paste a URL into webpageTest or Lighthouse, you're probably not going to incur a redirect because you've probably pasted the resultant URL out of your browser and into a tool. It turns out on this particular website and the website, if you're Dutch, you know it well. It was anwer bay. We found that this little breadcrumb in the top left, that little breadcrumbs passed us through a very expensive redirect. Now I knew this, I knew this sort of like regression the time to us byte regression. I knew it had happened on category pages, no matter how many URLs I pace into webpagetest I could not get a category page to have a bad time to first byte. So what I did is I put this little bit of pink in the middle of the screen here, the middle of the slide. I pasted that, I put that into dev tools and it just showed me every non 200 response from the first party domain.
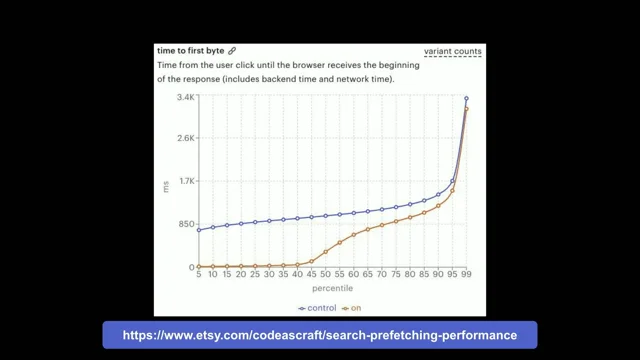
I just clicked around the site like a user would. It took me a long time to work this out, longer than I'd care to admit. It's very manual work, there's no elegance to it. But it turns out as soon as I clicked the breadcrumb to go back to the category page, we incurred a 1.4 second you'll notice for the very keen eyed this is not a throttled connection. This is actually over a real sort of like WI fi connection on a laptop. This is how users actually use websites. Pasting URLs into tools is never going to be representative.
So this brings me on to soft navigations and spas. Now I'm very anti spa. I live my life in cheap rhetoric. So one of the first things I'll do if when I work with a client, when I work with a new client and if they've got like an e commerce site and I know it's built on nuxt or next, I'll say to them okay, I'm starting a new project with you today. What pages would you like me to test? Homepage. Relatively important product page, really important Category pages, Search results page you've just named four pages. Why have you built a single page app? Cannot stand it, but they exist whether I like it or not. And I need to be able to test spas properly. Soft navigations, right?
That's the complete polar opposite of visiting URL.
So you can't use the navigate command in webpageTest with a single page application. You just can't. The navigate command is the equivalent of pasting a URL into an address bar and hitting return. If you do it on spa, you're going to get X amount of server side rendered interactions or server side rendered pages. That's not how spas work. So you need to actually use the website like a person traversing it. So in that Case you'd have to write more of like, I don't know, more of like a.
Not the word, it's like a selenium, like a more of a user sort of journey thing with actual interactions. So I had a client, an E commerce site in the uk and they were. They'd re platformed for an spa. And I had to admit to them, look, I don't think it's the right technology for the job. I don't at all. And if anyone wants to argue with me that argue about that with me, I'll tell you, you're wrong in person.
I really don't think spas are right for 99% of the use cases.
I really don't. But I had to admit this client, their soft nav was faster than hard navigation. They primed things. The soft nav, it was faster than their testing was showing.
More pessimistic, it's not very clear from this screenshot, but the soft nav, we got to LTP at 1.8 seconds for hard navigation, visiting that page, sort of as a navigate command. It was more like 2.5 seconds. This site was demonstrably faster when used as an spa.
If you're testing your spa with simply visiting URLs directly, you're missing out on the whole benefit of your spa in the first place.
Right. I'm about to run out of time, so, oh yeah, this is how I would do sort of user journeys in webpageTest, scriptable, sort of API, navigate to your initial URL, trigger the hard navigation, trigger your SSR, but then from then on in, execute and wait, an actual click on an actual href.
And that's how you will trigger a test that will look a little more like a person might actually experience it. The whole point of this part of the talk is just to show you a bit more optimism. The tests you're running are probably running too slowly and you're probably not testing the site in a forgiving manner.
So to wrap up, the numbers you see represent a huge array of experience. That 75th percentile, it includes people who've got a primed cache. It includes people it's their fifth page view. It also includes people who've never seen your site before. But you can't just test one of those scenarios. You can't keep running one test to represent the 75th percentile of your visitors. Design tests that suit your context. You will know where you need to test from, which pages, et cetera.
Design tests that are realistic. So don't test your spa only via hard navigations and I think the key takeaway for me is the fun stuff is the most well hidden. Your off the shelf tests will give you the low hanging fruit, but the fun stuff is hidden in the dark parts of that website like the actual nitty gritty user interaction. That's where the fun stuff is. So with that I want to say thank you very much for listening.
Thank you for your time and yeah, thanks for having me. That was great.
Do we have time for questions? Yeah, we can do a couple. Amazing.
Thanks Harry. That was awesome. We did have quite a few questions come in, so I want to at least take time for a couple of them.
Even though I can smell the stroopwafels. Does anybody else smell those?
Oh my gosh. If I start drilling on the table, Harry just. That's fine. Yeah. So one question right up front with that. Like you're talking first off, love the approach. Like I love how scientifically you think about this when you're talking about getting those tests and you can't like you said, you can't have one test running, right? And you're looking at those URLs, you're looking at the device types, how deep do you go? Is it similar to writing code coverage tests where you're like, oh, I want like X percent coverage of all the devices available or whatever? Like, how do you decide where to draw that line?
You need to cross reference basically all of this with rum or analytics data. So if you don't have that you're going to struggle. So you just have to use best guesses. But normally what I'd do is I would start measuring as many I've done this for sort of 12 years now, so I've got a little bit of experience, I know where to start looking. So I'd start cross referencing things with your RTP is currently this but that represents people had cache misses or hits or so you know how to start segmenting the data.
So even your 75th percentile can be divided into we'll look at your analytics basically. So work back from what do we know about our users and how do we segment that. So I don't think I'm really answering the question, am I? But I think it'd be knowing how to segment things. So I wouldn't test every scenario but I'd look for the tells in other data. So if your analytics working for a client recently they were obsessed with core web vitals, but they had a 51% iOS audience. So it's like we're Technically optimizing for the minority. So always cross reference things with other business data. What else do you know about your customers? What else do you know about your users? That's actually a really good call out because that was another question somebody asked. You mentioned Crux and you were showing like how you use trail and stuff like that to get that lay of the land up front.
But then the question that came in was around other browsers and like, is there a close enough approximation in your experience?
Like, oh, if I'm seeing this in Crux, like it seems to translate, or I've.
Okay, don't hold me to this. Generally you'll find that iOS will be faster. That's not because Safari or WebKit is faster. It's just that Safari can take advantage of sort of bare metal optimizations. I've modeled numbers before where I've taken a full suite of Time traverse by FCP LCP data from Chrome, and then using a tool like Speed Curve, you can get FCP from Safari.
And what I've done is I've passed that into ChatGPT. I said, here's a full suite of Time traverse by fcp, LTP for Chrome, and here's Time traverse by an FCP for Safari. The data point we're missing is ltp.
It's not supported. What extrapolation could you make from my Chrome data?
The delta's there and the delta between just TTFP and FTP here. What can you extrapolate and what could we guess about Safari?
In every case that I've done that Safari does come back faster.
So it's a blind spot you can probably afford, is what I'm saying.
Robin Shakes. You can probably afford. You should still measure it, but you'll find anecdotally, generally you'll find that an iPhone will be a faster experience than Chrome, but you still need to capture the data firsthand. So when I said Crux is a good starting point, it's just a starting point. And it will only capture Chrome data even when Safari start capturing or start supporting ltp.
If when, that will never go to the Chrome user experience report because it's not Chrome. So some of it's Apple's fault. Some of it is just by design.
It can't go into the Chrome user experience report because the browser isn't Chrome. That's why it's super important for any sufficiently ambitious project, have your own rum monitoring. And that's also why I'd recommend looking at rum providers that don't just talk about core Web vitals So use someone like Mpulse or Datadog who can capture data from non. Or don't just talk about cohort vitals. Sure. And then last one before we turn everybody loose for the stroopwafel is you talked a lot about like how the overly pessimistic results are often coming from these tests.
Is there ever value in treating that overly pessimistic view as a stress test of the site? Or is that sort of an after you've kind of optimized for your PE90 P95 wherever you're at?
I always, always start with a cold start scenario. So I do think it's incredibly important to test the most pessimistic outcome.
But when you're actually looking to solve real problems on a website, don't test it like when you're looking for solving a real problem. Like the example I had with the breadcrumbs, cold testing would not get me anywhere close to solving that problem. So I do think your cold start scenarios are like your worst case scenario. Very important to test those and make sure you do test your cold starts. It's just don't only run those. I also recommend always, always test slightly more pessimistic than you expect. Anyway, if you can make the site faster for folk down here, everyone on top of that gets a boost for free. If you only optimize the top 10th percentile, you're not really helping anyone.
So always, always test a slightly more pessimistic scenario than you expect.
But don't only test the most pessimistic scenario.
If that makes sense. It does, it makes sense. All right, awesome. Thank you sir.
Appreciate it, Harry. Really appreciate that. Thank you everyone. I'm going to be around if anyone's got any more questions. Thank you.
- PageSpeed Insights
- Chrome User Experience Report (Crux)
- Treyo
- DevTools
- WebPageTest
- Core Web Vitals
- Largest Contentful Paint (LCP)
- Interaction to Next Paint (INP)
- Cumulative Layout Shift (CLS)
- Time to First Byte (TTFB)
- DOM Content Loaded
- P75 (75th Percentile)
- P95 (95th Percentile)
- Synthetic Testing
- Search Console
- Survivorship Bias
- Lighthouse
- Cold Start Scenario
- WebPageTest Scriptable API
- User Journeys
- Soft Navigations
- Single Page Application (SPA)
As awareness and tooling around site speed have been improving at a very exciting rate, has performance testing actually become any easier? In this talk, we’ll look at practical tools and workflows so every test has a purpose and provides actionable, reliable data.