Console Dot
Console.log is one of the simplest and easiest tools to use when you’re programming in JavaScript. Most of us see it as the hammer, and every problem with our code as a nail. The majority of problems we come across aren’t nails though, so we need to be using the right tool for the job. Luckily for us, the console API is full of handy tools that will help us develop faster and debug more efficiently.
Awesome things you might not be using right now in Chrome dev tools:
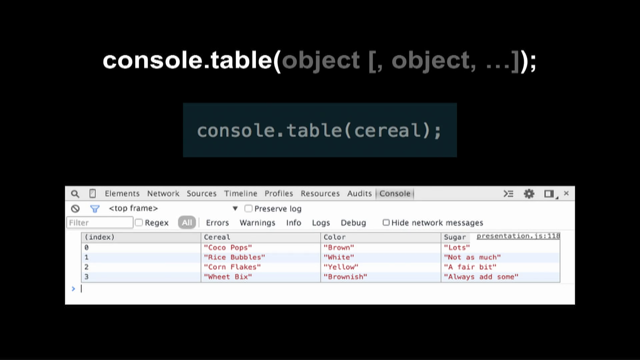
console.clear()console.count(label)console.dir(object)– prints out a DOM objectconsole.dirxml(object)– same thing with xmlconsole.errorandconsole.warn– these are useful debuggersconsole.group(label)– the following console output will be grouped, so you can create a collapsed set of debug informationconsole.groupEnd()– closes a group. Optional but lets you control things nicely.console.profile()andconsole.profileEnd()– sends data to the profile tab.console.time(label)andconsole.timeEnd(label)– sends data to the timeline tab.console.table(object)– needs an array of objects, prints them out in a table with their keys. Doesn’t print nested objects. You can control what’s printed.console.log()– prints a string. You can use%sand%detc for fine grained control.console.log("%cHack","color:red")You can also style the output (expedia have a console easter egg using this).
Just google “console api” as you’ll never remember the URLs in the slides!

