Modern Performance Workflows
Setting the Stage: Goals, Scope, and Expectations
The host introduces Umar as a developer tooling expert, and Umar frames the talk around modern performance workflows focused on diagnosing issues rather than fixing them. He sets expectations for a broad survey of tools, encourages note-taking instead of deep dives, and flags that tasteful AI content will be included. Umar also references a simple “social media demo” site used throughout to ground examples. This opening aligns the audience on the talk’s practical aim: adoptable workflows that improve day-to-day performance debugging.
Unearthing Lesser‑Known DevTools: Insights Pane and Annotations
Umar skips the basics and highlights the Performance panel’s Insights pane as a bridge between high-level results and low-level flame charts. He demonstrates LCP request discovery and a network dependency tree overlaid on the flame chart to reveal the critical rendering path. He also calls out flame chart annotations and urges the audience to try them, even if they feel minor, to build muscle memory. This segment encourages attendees to use DevTools features that make performance patterns visible and actionable.
From Page Loads to Journeys: Time‑Span Audits and Recorded Workflows
Umar introduces Lighthouse time-span reports to evaluate user journeys and post-load interactions, surfacing metrics like Interaction to Next Paint. He explains common challenges—repeatability, observability, and continuity—when trying to compare runs over time. Umar then shows how the Recorder panel replays interactions, captures performance recordings, and exports code for CI, solving consistency and ownership issues across teams. This expands the performance conversation from page load to real user flows.
Precision Throttling: Diagnosing Web Font Issues with Request‑Level Control
Using apple.com as a case study, Umar contrasts site-wide throttling (which masked FOIT) with new per-request throttling in Canary that made the issue visible. He temporarily fixes it via DevTools Overrides by adding font-display: swap, then shows similar real-world findings on TfL and Monzo when throttling specific font requests. Umar also notes upcoming request priority controls and how to enable these features behind flags. This segment demonstrates how targeted throttling surfaces problems global throttling can hide.
AI in DevTools Today: Assistants, Contextual Prompts, and Smart Annotations
Umar outlines AI’s “milestones” and introduces Chrome’s AI Assistance panel as a contextual helper that explains slow requests and flame chart events. He shows right‑click actions like “debug with AI” and “explain slowness,” noting answers often link back to trace regions. While he doesn’t rely heavily on these for deep work, he uses AI to generate clear annotation labels and shares traces with teammates. This positions AI as a supportive layer that speeds understanding without replacing expert judgment.
Coding Inside DevTools: AI Suggestions, Workspaces, and Breakpoint Helpers
Umar enables AI code suggestions in DevTools to get inline “ghost text” for small edits, sometimes preferring it to his editor because he lives in DevTools. He demonstrates Workspaces via a devtools.json mapping so edits write back to the local file system, which is especially helpful for teams and workshops. While paused at a breakpoint, he uses AI to scaffold quick logging and fetch snippets, noting sign‑in is required. This segment shows how to keep fast iteration loops inside the browser.
Automating Diagnosis with MCP: DevTools and Playwright as AI Tools
Umar explains Model Context Protocol (MCP) servers for Chrome DevTools and Playwright that let AI call tools like “open page” or “collect metrics” from chat. He configures clients (e.g., VS Code, Claude, Gemini CLI) and shows natural language tasks that gather performance metrics and compare runs for stakeholders. He highlights chaining tools to express outcomes instead of imperative steps, while cautioning that auto‑fix attempts are still hit‑or‑miss. The takeaway: AI‑driven tool calling accelerates measurement and communication, even if full automated remediation isn’t ready.
Agentic Workflows in the Wild: Local Sites, Remote Browsers, and Team Bots
Umar demonstrates an “agent” opening a local Astro site, throttling, and retrieving LCP directly from Copilot Chat—no hidden prompts. He proposes a “first‑pass” technique where an AI continually explores a complex site to produce stable navigation instructions for later use. He then runs remote browsers on a VPS or Raspberry Pi, shows control from a mobile phone, and wires a Slack bot to return metrics on demand. These examples illustrate flexible, low‑cost ways to bring automated diagnostics to where teams actually work.
Scaling Journey Testing: Generating Lighthouse Time‑Spans from Feature Specs
Building on earlier demos, Umar converts Given‑When‑Then feature files into Lighthouse time‑span scripts with AI to cover common user flows. He aggregates results into an HTML report that spotlights regressions and lets product managers drill into metrics like CLS for critical journeys. He suggests this as a pragmatic bridge when teams lack bandwidth for hand‑crafted scripts, while noting Lighthouse CI remains page‑load focused. This segment reframes performance testing as an extension of existing acceptance criteria.
Dynamic Performance Checks in CI: GitHub Actions Powered by AI
Umar shows how to read a PR’s git diff in GitHub Actions, prompt an AI to generate the right performance test, and publish the results as a report. He advises guidance for different PR types and guardrails for irrelevant diffs, acknowledging cost and latency trade‑offs with state‑of‑the‑art models. He saves artifacts like Playwright traces and inspects them in trace.playwright.dev to validate what the runner actually did, down to click coordinates and network payloads. This turns performance reviews into an automated, auditable CI step.
Reality Check: Costs, Determinism, and Strategies for Complex Sites
Umar recaps these AI‑assisted workflows as stepping stones, not replacements for performance culture. He calls out model cost, large diffs, and non‑determinism, offering mitigations like a sliding‑window approach over diffs and a weekend‑long first‑pass run to stabilize instructions for nuanced sites. He notes the best results so far come from top‑tier models like Sonnet 4.5 and GPT‑5. The segment closes by encouraging incremental adoption and promising to share prompts and examples.
Audience Q&A: Adoption Tactics, AI Reliability, and the Future of DevTools
In Q&A, Umar attributes his discoveries to curiosity and heavy use of Chrome Canary flags, encouraging others to browse DevTools experiments. He says he goes “all in” on AI where policies allow, but mitigates hallucinations by asking for binary outcomes (e.g., pass/fail on Core Web Vitals) rather than open‑ended reports. Asked about gaps, he wants AI‑assisted fixes and safe, override‑based trials that compare multiple solution profiles. He also underscores the importance of cross‑browser DevTools parity so developers can test and build confidently across the ecosystem.
Next up we have Umar. Your bio.
We need to brush up your bio. It says developer in the UK and I could not possibly say that you're understanding things more. I've done so much training over the years where I've talked about dev tools and how to use them effectively and efficiently and everybody's like always intimidated because there's so much there and it's constantly changing and constantly like evolving and so much going on and they're always like oh well how do you learn more? That's how you learn more. He's done these amazing tips over the years. He has an amazing modern dev tools workflow course. I have learned so much just about the tools that I use on a day in and day out basis and how to be much more efficient with them from him. And so this is like modern performance workflows. Again, perfect presenter for this.
Really excited about it everybody. Welcome. Amar.
Thank you.
Thank you so much for the really kind introduction. I'll be honest, I don't know how to follow up the previous talk which started out by showing Lego on stage. So here you will have to look at my bland slide deck here. But I hope to leave you with some maybe inspirational at least workflows and tooling that you can maybe start to adopt even today, tomorrow in your actual day to day jobs. Cool.
The About Me I know maybe not too inspiring but like seeing it on the big screen it does make it look incredibly dull.
Two bullet points to sum up my life I guess. But yeah, the goals of this talk is effectively to get you familiar with modern developer tooling. Maybe some tooling that you know of but you don't know how to use. And a little disclaimer just to manage your expectation. This is about diagnosing rather than fixing. The fixing is of course very valuable. It's just out of scope for this particular talk. And also the it's going to cover a broad scope.
So as you're listening, if you hear a tool and you're like oh that sounds interesting. Just again to manage your expectations. We're not going to do deep dives into these. This is going to be quite broad. So I do hope you make a little note on your phone or you write it down so that you can search for it later. This is the rough outline and I think we can pretty much get started. Yes, again there will be some AI stuff.
I know you've been getting overwhelmed. If you're like me, it's just non stop.
You look left, right and center AI everywhere. But I'll try to keep it tasteful.
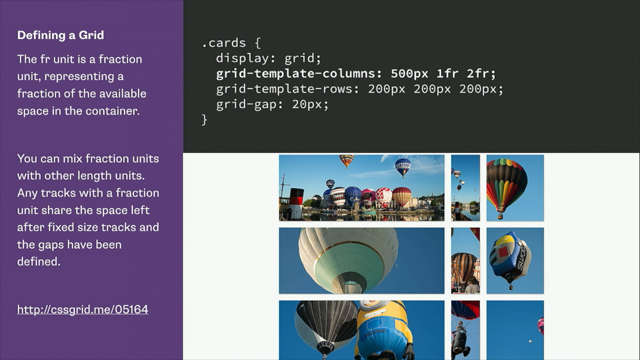
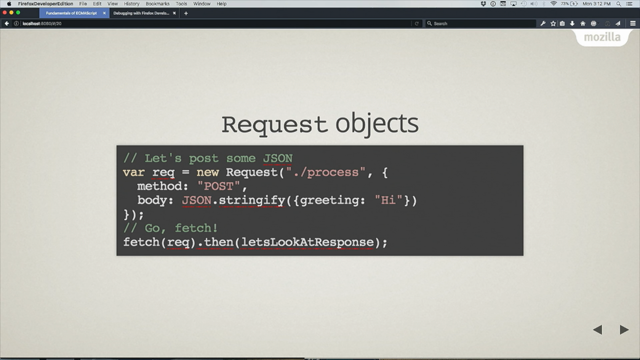
And I do believe we shouldn't bury our heads in the sand and we should try and stay up to date where possible. Very quickly, if you ever hear me referring to a social media demo website, it's this little thing that I've it's a copycat from sites you probably use yourself and it just does the usual like following a post, liking a comment, leaving a comment and so on. So nothing particularly special. I just want you to be aware of what I'm referring to when you When I talk about a social media demo website, let's get into it and in fact let's just skip the basics. You know DevTools, you've got the network panel, you've got the flame chart, which even if you don't know this in depth, I think it's fine. Let's skip past this because I'm going to assume most of you are at least aware of it and maybe some of you are quite intimately familiar with the tooling itself. What about some of the lesser known tools? Well, one thing that I've been using quite regularly is the insights pane within the performance panel.
I find this is incredibly useful because in the past we have only had high level overviews or very in depth granular, low level stuff. But this kind of marries the two where in this example I have opened up an LCP request Discovery Insight and it actually highlights the appropriate portion on the flame chart and it is the flame chart which is the low level thing that is sometimes a little bit hard or difficult to digest. Here we have got a network dependency tree and it is effectively showing me the critical rendering path that again overlaid on the flame chart which is the thing that is sometimes hard to digest.
I think that is pretty useful. You have also got annotations.
For me this isn't a big thing, but the times that I forced myself to use it hoping that I would develop the muscle memory, I have actually found it pretty handy. Pretty nifty. You have got a few different types of annotations. I am not going to do a deep dive into each one. So I want you to search for DevTools annotations and read about it. This is just to make you aware that it exists.
Again, in the spirit of maybe lesser known tools, let's skip past Lighthouse reports, at least the navigation style reports and instead let's talk a little bit about time span reports because this is something that I think doesn't get enough. Love Page load experience is very important, but so is user interaction and user Journey testing.
This is something I don't feel gets spoken about a lot or as much.
So yeah, this is my plea to you to start considering it and later on throughout this talk we'll explore some techniques which you can use to maybe help you develop some of these in a more automatically generated way.
So I'm not going to preach to the choir. I think you already agree with me that this is important. This being User Journey testing, how do we do it?
Well, again, go into Lighthouse, you select time span mode and then you start doing a bunch of actions on your page. Interestingly, you start to get metrics which you wouldn't get otherwise, like interaction to next paint, which you see there because obviously you need an interaction and that's not normally going to happen during page load.
That's nice. You also get the insights that we saw just a few minutes ago. Those insights that you see in the performance panel insights pane are also visible on the Lighthouse report. But there are some challenges with this, this being time span reports.
One is repeatability, or how easy you can reproduce the thing that you did. Because my workflows generally do it once, try and fix the thing in code and then do it again. But I can't do it again because I don't know how to repeat the exact same set of interactions.
Or if I do, I'm kind of taking a guess, then you've got observability.
If you look at a Lighthouse report, can we quickly do that?
There's nothing really telling you what you've done or what's going on here, at least for me. It's kind of hard to make sense of this. Like did I scroll, did I click, did I type what actually happened? And then you've got continuity, which is just my fancy way of saying like over the weeks, over the months, over a year, like did I improve, did I regress? And it's just a bit hard to tell from that report that we were just looking at.
To solve this, I want to enter into the Recorder panel, which is this nice little panel within DevTools. And it turns out that you can do basically any set of user interactions.
For example, if on your shopping website it's very common, it's very popular for a user to add an item to their cart and maybe check out.
Well go and do that and go and measure the performance of it. But how you ask? Well, first of all you can just replay it like normal, which is maybe useful if you have like, I don't know, browser automation or more scraping related use cases but hopefully, you know, this is a performance conference. Hopefully you want to actually be clicking this performance button, which what it will do is it will allow you to replay the thing you just recorded and then capture a performance report automatically.
And this performance report is not necessarily a lighthouse report, but rather a performance panel recording. And then there's continuity.
How do we address that? Oh and by the way, you can also throttle the network, which I hope you do by default. But continuity, what do you do? So there's a little show code button. Again I can't do a deep dive into every little feature that I show, but just trust me, there's a little show code button in the recorder panel and that will produce for you this code that codifies the interactions that you recorded. Which is really nice because you can take that code, you can run it locally, you can run it on GitHub Actions, you can run it on Lighthouse CI, which I'll mention a bit about later or just your general continuous integration process.
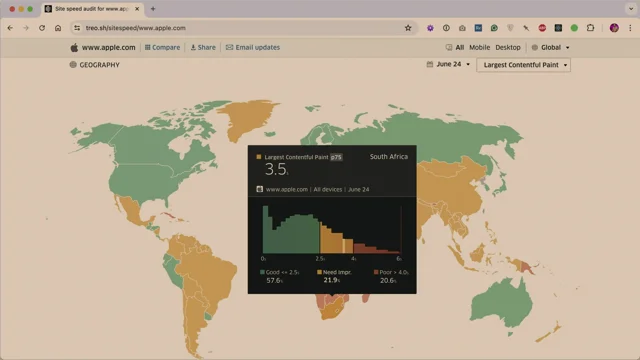
I think that's quite nice. Moving on network throttling, I'm going to go to apple.com and I'm going to completely disable or just not enable throttling. And I want you to pay attention to the web fonts on their page, specifically the text basically on the page. So I'll go to apple.com and there you go. Did you notice anything?
Because I didn't and to be honest there's nothing to notice. I'll replay it once more. It loads perfectly fine on my blazing fast Internet connection back home. Now I'm going to do site wide throttling.
So I'll go to the. Oh, sorry, I've already done this. I've gone to the network Panel, I've enabled slow 4G throttling, load the apple.com website and if you look at it it's alright, white screen. And did you see the text slightly shift a little bit? Now I like to think of myself as a decent performance engineer and if I was doing a performance audit for the apple.com website I would see that and I'd be like oh, you get a tick for using the font display property. Because if I do it once more I clearly saw the fallback font and it seemed to like swap to a web font and that's good, good on you apple.com but it turns out that I think it's Chrome, maybe Firefox, some browsers, they have like this default timeout of 3 seconds I believe where they say if your page is slow we are just going to use the fallback font regardless, or some sort of system font. That is what is actually happening here. It turns out that by doing site wide throttling I slowed everything down to the point where I couldn't really experience the problem and I didn't notice it. And again, I would have given them that tick. So DevTools, at least in Canary, now supports individual request throttling. This is in Canary and I will talk to you a bit about that in a second. I am going to turn off site wide throttling. We don't want that anymore. At least for this use case. We don't want that. I'm going to right click on an individual font in the network panel and I'll say throttle this request URL. When I do that, you get this drawer, open up and I'll change the 3G into slow 4G and I'll edit the URL to use a wildcard and I'll say everything within the fonts folder I want to throttle that. Then I'll reload the page and we'll see what happens. Interesting. So I know it's very short, this isn't a serious example, but still it's a real world example nonetheless. And I've paused the video here just so you can see it. So there's the classic flash of invisible text which you might have heard about. And I think it's kind of interesting how site wide throttling didn't allow this problem to manifest or present itself to me, visually speaking, but then individual request throttling did. I think that's quite a solid use case for this feature.
I know earlier I gave a disclaimer and I said we're not going to talk about fixes, but just very quickly because it's very easy to mention. And just in case you didn't know about it, I've set up DevTools overrides here, allowing me to override the content on the production website. And I'm just going to add in the font display property, which is one example of how you could fix this problem.
Admittedly, I'm taking a very naive approach here. I'm not an engineer on apple.com, so I don't know if this would genuinely fix it. But hey, in the test after I add Font Display Swap, which allows the browser to use the fallback font right from the get go. If the web font takes too long, you can see it. I mean there's nothing noteware over here and that's a good thing. But it's interesting because in my Testing Individual Request throttling. This is TfL Transport for London, which is a pretty heavily used website in London. A lot of websites actually presented problems that only manifested themselves again when doing this individual Request Throttling. So this is my, I don't know, my advocacy to you to say like, go and try it out. I think it's really valuable. And here's Monzo as well.
Interestingly, in the last few days I just happened to open up Canary and I noticed you've also got the ability to change priorities, which is like, wow, I think that is so really fantastic in terms of being able to test different use cases, maybe reducing the priority of an analytics or chat widget, seeing how it affects the critical rendering path.
Note, I believe this is changing the priorities of requests relative to one another, but there are actual Chrome people here at this conference, so I'm sure they'll be able to give a better explanation than I can. Cool. So go and try it out.
If you don't mind. Like canaries where you can try it out or just wait for it to land unstable, you do have to enable it with a flag, which I guess I should give a disclaimer. That is, in theory that means it's subject to change, but in my opinion this isn't going to disappear anytime soon.
Okay, let's move on. Again, I did say I'll try and keep it tasteful. I know the AI thing is a bit overwhelming depending on what sort of social feeds that you follow, but let's try and get on a level playing field. I want us all on the same page because I bet that some of you are not necessarily using AI as part of your web performance debugging journey. Maybe you ask it, I don't know, educational questions or you ask it to summarize an email, but I just want us all on the same page before I continue. So imagine a slow page load and then ask yourself how would you diagnose that with AI? And I want to go through five AI milestones. This is not official, this is just how I sort of conceptualize it. And first, and I think this was maybe four, three, four years ago, we had like the classic version of ask AI where you go into ChatGPT or you go into Claude and you say why is my website slow?
And you get the epitome of a stack overflow style answer. It was just a better search engine. Then you had the same thing. But I don't know, this was like half a year later and you just had a larger context window. So if you had permission from your organization, you could actually dump parts of your code into the chat window and say, here's the code, now tell me why. It's slow and it would sometimes do a decent job, but for the most part it would hallucinate. Third milestone, we had the AI wrappers and to be fair, many of them are still here.
It's funny, whenever I hear about AI wrappers, it's only in a derogatory context.
It's like, ah, it's just a rapper over, you know, the OpenAI API or the Anthropic API, which to be fair, in defense of them, they do like interesting prompt engineering techniques. They do like rag retrieval, augmented gener, like interesting things to manage the context window and get you results for very specific use cases.
Admittedly though, I haven't seen that many for web performance debugging.
So let's move past that. We then got tool calling or model context protocol where you could start to say things like, oh, capture a page screenshot.
And the language model would be like, oh, I have a tool that's been exposed.
To me that sounds like that. So I'm going to go and invoke that.
And this was really powerful. I love when this. Yeah, I loved when this came out. And then I can't believe I'm going to say the word agentic on stage. It's such a weird term. But yes, we now have agentic AI, which is effectively what we saw just now, tool calling, but on a loop. So it would literally just continue until it's done.
And whether it's like that in the real world is a different question entirely.
So that's where we are currently. And with these things in mind, let's actually move on to what I wanted to talk about, which is AI features and DevTools. You've now got an AI assistance panel, which on its own it doesn't really do much. It's just a panel, but it's highly contextual. Meaning if you go into, let's say the network panel, you remember paper, what was it called? Paperclip from Microsoft Word.
It was like, oh, it looks like you're writing a. Whatever. This reminds me of that, where you've sort of selected a resource and you get this kind of prompt. Why is this network request taking so long? And in case you're interested, the results look a little bit like this. So if we compare it to the milestones that we were just looking at, I believe this is like version three of that where it's kind of an AI wrapper and that's not a negative thing.
I'm not complaining. It is nice, but it has definitely not changed my workflow dramatically just yet. But who knows, maybe in the upcoming months that will change hopefully.
But a few other things. You can right click on pretty much anything within DevTools nowadays and you get these nice debug with AI, explain the purpose, explain the slowness. Same in the performance panel.
You can just right click on a, record an event in the flame chart and assess the purpose, identify the time spent.
What is really nice is sometimes the response to these prompts that you give it. It will be quite contextual. It will include links to various parts within the flame chart. That's quite nice. Funnily enough, I don't personally use this too much. I find it useful and I want you to be aware that it exists. But one thing I have been using is very tiny feature. But you know how I mentioned you can now do annotations in the flame chart? Well now you can generate a label with AI, which I thought as very superficial, but for some very deep dives that I've been doing, I have been using this. I've been kind of forcing myself to use it and I found it very useful. You can also export these traces that you make with the annotations, share it with your team, upload it to an issue tracker. So lots of interesting use cases.
You know, compare a before and after after you've supposedly fixed the performance issue in question. Anyway, let's move on. Code suggestions and devtools go and enable this in the AI Innovations section within DevTools. Again, maybe try this in Canary in case you're not seeing the same behaviors that I'm demonstrating. But the gist of it is for the record, this is not groundbreaking in the slightest. But again, it's one of those weird things where I sometimes use it here more than I do in Copilot chat, like in VS Code. Just because I kind of live in devtools for a lot of the work I've been doing. But here I've commented out a line of code, I add a new comment, add a limit of 4 to the URL and you get the ghost text, the ghost text that you've all probably seen before, but you now get it within devtools and it's nice. It generally seems to do exactly what I want, but not always. So maybe that's an issue of model quality.
In case you were noticing there. I don't know if you saw a little green dot. If I just. I don't want to replay the whole video. A little green dot near the file name API JS that green dot indicates that I've set up workspaces and I just want to do a little bit, maybe a bit of a tangent, but a little side note here. If you expose this URL com.chrome.devtools.JSON and then within that URL you add some metadata to say, this is where my code lives on my file system. It turns out that DevTools can then automatically connect to your file system during local debugging, which is a nice little handy trick. Really good if you work in a team and you all have the folder in the same location. And really good for me, because I do workshops and I would love for my workshop attendees to benefit from this rather than us having to faff around with connecting the correct folder. One place I told you a few minutes ago that I've been using this a fair amount. One place is actually while paused at a breakpoint, which is. I don't know why it makes sense now, but in retrospect it's easy to say that. But anyway, paused at a breakpoint I just made a fetch request in the Sources panel and now I add a comment log the response and status code, and it gives me the code. So again, this is not to point out that this is like a groundbreaking thing. I wouldn't be surprised if almost everyone here uses this. Well, the equivalent in their code editor. But it's just a reminder that this is now possible in DevTools as well. You have to be signed in. By the way, a little disclaimer there. Nice. Let's move on.
Playwright and DevTools MCP servers can't really do a deep dive into what MCP is, and I'm kind of making an assumption here that most of you are familiar with MCP servers or function calling.
If you're not, just very quickly imagine that you, the user, you've installed an MCP extension. Just think of it like an extension for your AI model. The idea is it will have a system prompt getting injected into it that says, ah, you have these tools available at your disposal, you being the AI model. And then you.
The user says, Please navigate to example.com and then the model's like, oh, navigate to. That sounds like the open page function.
So that's my very quick like one minute explainer.
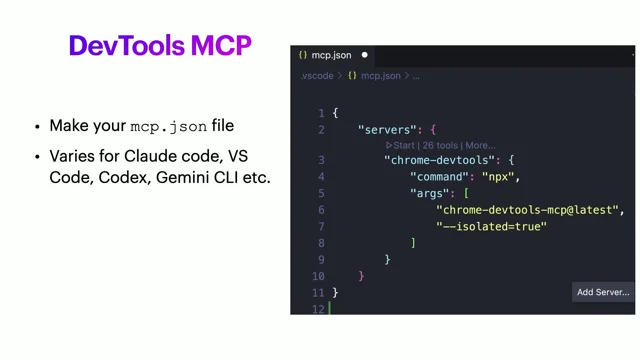
Very, very naive, I know, but that's how I would explain it. In case you've never heard of mcp. With that being said, it turns out that there is a Now official Chrome DevTools MCP server. There's also a Playwright MCP server which I've been sort of playing around with and using them interchangeably, and I'll be showing them interchangeably as well.
In VS code at least you can create a MCP JSON file. And in this context VS code would be the client, the MCP client. And you are telling it where you See args Chrome DevTools MCP. That's specifying, Hey, I want to use this MCP server. And you can do the equivalent for the client of your choice, whether it's Codex Gemini cli, which is free, has a generous free tier and yeah, a bunch of others. And again, maybe not surprising, it's hard to judge how familiar you are with this stuff. But you can go into Claude code, In this case open example.com, and it will just do exactly that, which is nice.
You can get a bit more creative, like go to the social media demo website I was talking about earlier and get me the performance metrics.
And under the hood it knows, all right, I need to navigate to a page and getting the performance metrics. Well, it looks like there's a tool available to do that, so it knows to invoke that tool. And this is really nice. I'm not just saying this for the sake of as if trying to be compelling just for the sake of it. I have genuinely been using this a fair bit more than DevTools itself, basically the UI equivalent. I've been using this like the command line interface version of this and it's letting me answer questions very quickly, which is very, very handy. I've also spoken to stakeholders in the past or maybe ctos tech leads, and there I am trying to compel them and try to make an argument for like, oh, we should do this or we should do that in the name of performance. And then they'll always ask me a follow up question. They'll be like, oh, so how much slower is our website with whatever on a mobile connection?
And I'd always struggle to answer very quickly, but now we can do that. So here I'm asking to go to Netflix and just do a before and after of no throttling versus throttling enabled and repeat the test three times and make a table. And I'm going to skip ahead to the end result. It does that. It can sometimes take a while. It can fiddle around and get a bit hallucinatory, if that's a word. But yeah, it generally works and gives me the results I want And I would love the idea of being in a meeting where you can propose ideas with the stakeholders or the decision makers and being able to answer questions like this very quickly. I think it's a powerful use case.
There's a lot of possibilities when it comes to tool calling with MCPS, whether it's the Playwright MCP server, DevTools, MCP server, and I'm sure there's like others at this point. But what's cool is not just the individual tools that you can call with natural language, but it's how you can combine them and really describe the outcome that you want rather than having to get like, I don't know, imperative, if that's the word. And also you can. It doesn't always work and that's why I'm not going to talk about it in this talk. But you can totally add on and just fix any performance issues that you find. And it doesn't always work, but the times that it does, it really is quite incredible.
And I could absolutely have fabricated some demos where I say, oh look, I asked it to fix the LCP and it knew to add a preload tag and I could absolutely show that. But I think that wouldn't be realistic because every time I've tried it in a real code base, whether it's production grade, whether it's maybe some of my more personal projects, it's always been a little bit hit and miss. That's why I don't think we're fully there yet.
Cool. Just a very quick recap. I'm not done with mcp, but just quickly to get our heads in the right space in case it wasn't obvious.
You can ask for call with vitals information from these MCP servers.
A little thing that's been bugging me for the last decade is how I've always had to synchronize almost my DOM tree or my CSS selectors with my browser automation scripts. You don't have to do that anymore. Click the buy button instead of click the element and then specify the selector. Don't have to do that anymore. And I think that's really nice. And yeah, in case you're wondering what do I use Chrome DevTools or the Playwright MCPS?
So far I found roughly a fair amount of feature parity, at least from an outcome perspective. Under the hood, I think Chrome DevTools is a bit more performance orientated, whereas Playwright is more for general browser automation.
One little I don't know, I found this. I thought this was so cool.
On the left, I'VE got a browser open with Astro, you know, the static site generator, whatever it is. It's an Astro starter kit. And on the right, I've got VS code. Let's open up VS code. So I've got my markdown file.
This is raw markdown code, and I'm going into Copilot chat and disclaimer. I've had to enable Agent mode and I'm using Claude Haiku 4.5. And I've asked a prompt, which, I don't know, maybe us as people who have expertise in this field, maybe we know how to handle a prompt like open this page in the Chrome browser, throttle the network, and get the largest contentful paint score for the image in this post. But how would you like give that to someone who didn't know about this? But anyway, interestingly, the AI model in this case, Haiku, was perfectly capable of dealing with it. It knew how to run a server, it knew to, I don't know, like, infer where the file lives relative to everything else. And then it figured out what URL to visit. And indeed it did get the LCP score, as you can see there in the chat window. So I just think that's so great. I think it's so fantastic. I would love to see. Do you remember those code editor extensions where maybe you have a hexadecimal color and then you get a little tool tip over the color that shows a preview of what the color looks like? I'd love to see extensions which are more like, oh, you've added an image. Here's the LCP score, which of course is highly dependent on the browser environment and so on, but still.
Oh, and by the way, no demo unless I tell you about it. No demo is using some secret system prompt behind the scenes to get it working.
So what you see is literally what I've done.
Okay, where you see first pass, first pass can help.
That's to accommodate those of you who have more complicated websites.
And you can't just say click the buy button, because it turns out that the buy button only appears when you've filled in a form field. So I'm going to get to what I mean by first pass in a second. But just very quickly, let's take a little detour. The geeky part of me was very curious because it turns out you can use These Playwright or DevTools MCP servers with remote browsers, and you might see where I'm going with this based on that Raspberry PI logo.
But it turns out you can start Chrome even on your local machine. If you want to have your existing browser extensions being part of that AI journey that you're taking, you can start Chrome locally, but you can also install Chrome on whatever browser you want to use on a virtual private server. For $4 a month, halfway across the globe, you can install it on a Mac Mini in your closet on a Raspberry PI that's sitting there. And I did this.
On the left is a real mobile device, on the right is Remote Desktop. And that Remote desktop is a preview of, I think this one was a VPS server. So on Claude Mobile, again, this is a real mobile device. And I love the idea that I can be on public transport doing this. I verify that I've got the MCP stuff set up. This is playwright in this case.
I've got all the tools installed and I'll ask it whatever. Go to YouTube.com and I don't know it does exactly that. But what's interesting is that browser is again happening elsewhere. Turns out you can also make Slack bots or Discord bots or whatever chat system you're using.
So here's my colleague, totally real, definitely not me.
I wouldn't do that. My colleague saying, this website is looking really slow and I've replied in a Slack thread, can you try loading it and telling us the performance metrics? And I've mentioned my Slack bot, which in turn connects to that remote browser instance and that just works and it gives me the performance metrics. Now, that might not excite you, but for what it's worth, these headless browser as a service systems, they do seem to be proliferating the SaaS market right now, and they're not cheap if you look at the pricing and the idea that you can do this for four or five dollars a month is pretty compelling to me. But if that doesn't compel you, maybe this part will. So if you do have some complexity on your website, you might want to come up with an approach, which is what I'm describing here, where I call it the first pass technique. And what I mean by that is offline, not literally offline. I'm just saying, like behind the scenes.
Ask a language model or an AI to continually go through your website. Let's say you're an airline booking website and you have all sorts of hidden complexities. Ask an AI model to go through your website in an exploratory manner and keep trying to discover what it can about different types of interactions or, or things that might not be obvious to an AI Model at first glance and have it constantly do this and constantly refine the instructions and then have it dump it to a text file or a markdown file and then you can then use that as a sort of to feed into a system prompt of some sort and then that helps get you just like much faster results.
And it can also use your existing AI subscription by the way, if you do have like Claude Claude Pro ChatGPT Plus.
But of course in a professional context you're probably going to be using an API or their API offerings. Rather cool.
Let's move on to Lighthouse time spans which we did talk about, but this is the more automated edition and yeah, let's get into it. Earlier I showed you the codified version of the website Journey that I recorded for a random website.
And that codified version I explained how you can take that, you can run it in GitHub Actions, you can run it in your continuous integration environment and that works and that's fine. But at the end of the day you still have to keep. You have to record the journey manually and that part is a little painful, especially when you're maybe a smaller team and you can't always justify or yeah, you can't always get that buy in.
In addition to the unit tests, the integration test, the acceptance test, the meetings, the feature development itself, maybe you can't always get buy in for the more performance related side of things.
So this is one way. If you take a feature file that you have hopefully already written, and I know that not all teams do this, that is fine. It doesn't have to be a literal feature file. It could be just a description in your issue tracker, it could be something that you, the developer, you wrote for yourself.
If you take something like this, and this is a scenario for following a user, maybe you've heard of it, given when thens.
If you take that, you can totally just ask an AI model to generate the corresponding Lighthouse script that we were looking at earlier.
And it kind of does a decent job, especially when you do that first pass technique that I mentioned earlier. Chuck, those feature files in your code base have the performance related equivalents generated automatically. And then you can end up with something like this where you're basically covered for almost every user journey, every interaction on your website and you're able to collect performance metrics for what those look like.
And this is me doing it on that social media website I mentioned earlier.
And in terms of what the result is here, it's basically a HTML file, it's a report and it looks like this, which is maybe not surprising, but I think where it gets exciting is you get this really, I don't know, high level overview of where performance is at.
Are we doing good, are we doing poorly? And me as a product manager, for example, I would love to see something like this where I say, oh, you know what, let's see. Viewing likes on a post. That's one of our most popular use cases. I really want to dive into that because we're getting 16 out of 22, for example, and you dive into that and it turns out it's cumulative layout shift. So this is a proposal. This is very much like an experimental thing that I'm suggesting that you do.
And by all means, if you have got that performance buy in and you can justify spending the time writing these scripts a bit more manually, or at least recording the interactions using the Recorder panel, do that.
Only resort to something like this if you don't have that buy in.
So just to clarify with what we saw there, every interaction, every journey, if you were to follow this approach, it would get its own set of performance metrics. You can output the report as part of your CI process and it's very easy to see performance regressions for interactions.
What do you do with that report? However, what I would do personally is I would chuck that into a tool called Lighthouse CI and there are a few of these and this is one option for you.
It's decent, it is what it sounds like, it's Lighthouse, but for use in a continuous integration environment. And actually one disclaimer, it only works for page load as opposed to user journeys, which is ironic because I've been talking about user journeys all this time. So yeah, pretty big disclaimer there. Yeah, it's good, it's on GitHub.
So if you're looking for a more free or open source approach, go and try that out. Okay, let's move on to automation with GitHub Actions. And again, this, I don't want to say the whole talk has been leading up to this. It hasn't, but this is somewhat of a crescendo for, for just automating as much stuff as possible as you can. And the only reason I would advocate that again, I have to repeat it, it's if you don't get that buy in from your organization, if that's the case, then potentially consider something like this. I did mention this, I tried to talk to stakeholders, team leads, tech leads, developers.
If you agree that yeah, performance, automated performance testing is valuable, especially from a user journey perspective, why aren't you doing it? And the results and the respons were generally the same. It came down to a priority issue. So what if we took a git diff and if you go to a GitHub pull request URL and just apply patch to the end of the URL, you'll see something like this. This is like the classic git diff.
What if we were to take that and then to generate an appropriate performance test on the fly within GitHub Actions. So you do it once and you just don't worry about it again.
So you can take a GitHub actions YAML file, a configuration file and you can write a prompt a bit like this. You can say, look at this git diff. Now generate and run a performance test and save the results as a GitHub report. It is good to give it a gold standard test just so it knows roughly how the API works.
Even though in my actual testing with this, in preparation for this talk, it didn't need that gold standard, which I thought was really quite impressive actually. And then yeah, you should also mention that you have access to whatever tooling the Chrome DevTools MCP server, the Playwright MCP server. It's always good to mention that. Otherwise it tries to come up with its own approach. Okay, then you want to somewhat specify the different types of pull requests that the AI might be encountering based on that git diff. And you want to just give it a gentleman gentle guidance, I would say.
So it knows that, oh, if the user, if the pull request author has added a form to an existing page, then I want you to test that the form gets filled in and check the corresponding imp.
And you can break all these down and you can do it according to the needs of your business, the needs of your team, and you can break all this down and you definitely need to add some disclaimers for like, hey, if you see a 1000 line file change for package lock JSON, please just abort. We don't want to test that. From a performance perspective, this works. I have tried this on a few projects.
It does work. It is. I wouldn't say it is hit or miss from whether it works or not, because it does work. In the times I have tested it, where it is a bit hit or miss is from a length of time perspective and also cost. Who did I burn into my the API limits here?
Maybe if you're in a more professional setting, you know, I was doing this as more basically preparation for this talk. If you're in a More professional setting.
I would like to think that you could maybe justify a slightly higher budget for this sort of workflow, but this works. This is GitHub Actions, and this is what the report shows you. Once a pull request has been submitted, you just ask for whatever performance metrics you want, and you can also instruct it and guide it for what it should fail.
And yeah, you get full details of the.
In the case of largest contentful Paint, if you want to know what element was impacted, you can ask for that within your prompt. And just for the record, in case you're wondering, like, okay, this looks cool, Umar, but how do we set this up? I do plan to, like, release the prompts that I've been using. I just didn't want to bore you by showing you, like massive screens of like, oh, here's the prompt I used to achieve this.
I think that can be a little bit boring to look at sometimes. Earlier I did mention, in the very quick prompt example I gave, I mentioned about saving to GitHub Actions or saving to artifacts. You can do that. So in a GitHub Actions report, you can basically dump the output of what the runner did. And in this case, I was using the Playwright MCP server that offers you a trace. I download that trace from GitHub Actions, I drop it into trace.playwright.dev and then you get something a little like this.
And it's really cool to be able to see exactly what the GitHub runner did, which is very powerful for if something went wrong or you kind of have a skeptical eye to the results that it's generating. You can scroll through a film strip. You can. What else?
Oh, this is nice. Every time it navigates through your page and remember it's doing this dynamically, it's figuring this stuff out on the fly. You can actually verify the hit. It shows a little red dot as to where it actually clicked on.
You get a full network breakdown. You can see the request, the response, the payloads. Really great.
Admittedly, it was a bit more complicated than this, but this isn't far off.
My GitHub actions file did really come down to this.
In this case, I was using Claude code and it basically comes down to piping in your prompt. And the prompt is what I showed you earlier, which was like five lines, and it's basically piping that into Claude code.
You can also use, what is it? Codex, Gemini, CLI, GitHub have their own GH binary and I think it's called GH models. So you can look at that as well. And because this is ultimately a bash script, you can do whatever you want. So let's recap these dynamic performance prompts as I'm calling it. I want to make crystal clear this is a stepping stone to improving performance culture in your team. I wouldn't advise you just from the get go, start doing this and never touch it again. That doesn't feel like a good idea. But who knows, maybe in a year's time this stuff will become so sophisticated that yes, you can get away with just one YAML file, one text file and call it a day.
But at least for the time being, this is really just a stepping stone.
If you can't justify spending that time writing these scripts by hand, cool. Oh, and just for the record, I was trying this out on Sonnet 4.5 and GPT5.
Great results there a few challenges.
Maybe some of you are wondering about this cost. It's a bit of a tricky problem to avoid because you do have to use state of the art models to get this working, unfortunately. So who knows, maybe in the future, maybe in a few months time, in a year's time, you'll be able to use much cheaper models, which makes this a lot more sustainable and especially if you're a smaller team with smaller budgets. The large git diffs Again, it's difficult, but it's not impossible to solve.
In my case, I resorted to what I'm just calling the sliding window technique where I effectively say, hey, for a large git diff, I don't want to burn through all my tokens, so instead just look at random points within the git diff. Don't ingest it all into your context window.
That's wasteful. And try and make sense of what's happening by looking at random chunks of the git diff. And I saw decent results from this determinism.
There's no getting around this. This is not a deterministic workflow. This is again a stepping stone. And then website too complex or nuanced.
That is a legitimate challenge in the few websites that I tried, and one of those was an airline website. Again, I used the first pass technique where I basically asked an AI model to continually go through a website and and constantly refine the instructions for how to navigate through that and dump that all to a text file. I left that running for roughly a weekend and the instructions that they got that it generated rather helped subsequent AI model interactions that I was performing.
So that is coming to a close and I really want to thank you for hearing me out and giving me this time of day. Here's a few little exercises that you can try out yourself and I hope to get some code examples on GitHub possibly next week, so you can follow me there. Thank you very much.
Thank you. I believe one person in the audience commented, if this was an album, it would be all hits, no skips, lots of good stuff. So yeah, I actually am too old to understand what that means, but I think I get the concept. So. No, I mean it's great, it's fascinating. I mean, how do you find this stuff? Like, I'm just like. I mean, I live in dev tools, so I'm curious, like, how do you, like, what's your process for keeping up on like this and how it works in the workflow? Is it just.
Do you have that, Is it just your sheer creativity and curiosity driving you on this? Yeah, I would say curiosity is where it starts. I think I spend a lot of time in Canary and I get credit that I don't deserve because if you open up Canary, you'll just find a flood and a wealth of information again within the devtool settings that you just don't get in stable. And then that starts to be like, oh, what happens if I enable that? And what's that experiment and what's that Chrome flag?
A little hint. If you go to Chrome flags, just search for DevTools and look at all the different flags available for that Makes sense. Curious. You mentioned a few of the AI driven features.
Yeah. You're not using these super heavily yet or whatever. How often are you finding yourself running dev tools manually versus reaching for some of the more AI driven tooling now that it's available there? For projects where I have permission to use the AI stuff, I'm almost going all in. Almost like to. Yeah. To a concerning part from my. Concerning from my career, that is.
But yeah, I'm going all in for projects where ultimately it's not allowed because of organizational policies. And of course I'm sticking with the manual approach.
Yeah. Organization related to like privacy and leakage and stuff like that.
Yeah. For the AI driven actions and stuff. How, you know, because I mean, I think we're all kind of at this point very, very used to hallucinations being a thing.
How often would you say that they are the insights being driven by those are accurate versus like do you find yourself needing to rerun or sort of apply critical thinking on top of it Often like to revisit those results that you're getting? Yeah, that's interesting. So Whenever I asked it for like report or like, hey, tell me what you think.
That's where it felt like this is like hallucination station.
Because it was just like so bizarre and the angles that it was taking was just, it wasn't making sense to me and it wasn't solving my problem. So I slightly changed my mental model and the prompts I was giving it. So rather than just saying, asking for these vague like open ended reports, I was like, just give me binary, like did I pass Core web vitals, yes or no? I don't want your input, I don't want your insights. Just tell me, give me that binary thing. And then maybe using that as a flag to like parcel fail the build. And that to me was a bit more, I don't know, I still felt in control. And then it, the AI model felt a bit more like a co pilot, which was maybe how it should be.
So that's, that's what I would advocate for. If you are a bit like, hey, tell me if the performance is good or bad. I think it can just go on tangents and just what it classifies as good might not be what your team or business actually needs. Sure. So at the moment it still needs that sort of tailored experience. I kind of like you said the copilot model, I guess. Yeah. Are you fighting? I'm just curious on a broader picture, are you finding that there are still like, if you could wave your wand and have like some sort of magic thing happen in dev tools tomorrow?
Are there any significant gaps that you're finding still in your flow where you're like, oh, this thing right here is a nuisance. It would be amazing if that was taken care of. I mean, yeah, there are a few Chrome people here, so maybe they're the people to ask or to make these requests to, but for me, it would be like having it fix problems for me.
I know it sounds very like entitled or maybe that, maybe that even causes offense to people who've been doing this for a long time. But I would love the idea of like, don't, you know, you've got the flame chart, you've got the insights now it's already joined up. Like, can I just please click a button?
And then like, can you fix the problems for me? Or can you at least propose the exact type of fix I put in or maybe even a step further, like, could you, could you give me three options? Because often these things are, you know, it's a balance you have to compromise. So maybe try out three different things, record the corresponding profiles for each one, and then let me pick what one I want to go for based on what the metrics were. You could see the execution path for that, right? Like, I mean, between local overrides and, and stuff like that, you could come up with solutions where they could safely apply things like that and let you test it. That's an interesting idea.
More broadly, so everything we kind of walk through here, other than the Playwright stuff, because Playwright can handle the multiple browsers and stuff, obviously this was Chrome dev tools and they have a long history of pushing developer tooling forward.
Do you think that that's like, how important or is it important that other browsers kind of really hammer home on the dev tool process and flow? If we want to prioritize a cross browser ecosystem where people are testing and actively testing, actively developing in multiple browsers, what role does, I guess, developer tool ergonomics play in that, do you think, in your experience, for the browser adoption stuff?
Yeah, I think it's super important that other browsers really step up here.
And maybe that sounds a bit bad because actually some other browsers, for their respective inspectors or developer tooling, they sometimes surpass what I've been talking about, Chrome. They sometimes surpass what Chrome can do in some areas. But I do think it's important to have some sort of harmony because, like, every time I give a talk like this, I'm always left thinking like, oh, is it bad that I didn't talk about what the other capabilities are?
Actually, I don't think it is. Because at the end of the day, if the set of features in one particular browser are superior and superior in my opinion, then, yeah, it makes sense to show that. So if we had some more unification or harmony there, that would be, yeah, make my job a lot easier and maybe a lot more compelling. Sometimes it's good to put a little of the pressure on though, to kind of, you know, get the gas pedal moving. So, yeah. Awesome. Well, thank you, sir. Appreciate it.
Thank you.
- DevTools Insights Pane
- LCP Request Discovery Insight
- Flame Chart
- Network Dependency Tree
- DevTools Annotations
- Lighthouse Time Span Reports
- Interaction to Next Paint
- DevTools Recorder Panel
- Performance Panel Recording
- Network Throttling
- Individual Request Throttling
- Font Display Property
- AI Assistance Panel in DevTools
- Debug with AI
- Generate Label with AI
- Code Suggestions in DevTools
- Workspaces in DevTools
- Playwright MCP Server
- Tool Calling with MCPS
- Core Web Vitals
- Largest Contentful Paint (LCP)
- Lighthouse CI
- GitHub Actions
- Playwright Trace Viewer
Covers recent browser DevTools features and how AI assistance in DevTools can speed up your debugging workflow. Learn about automated workflows using coding agents, DevTools protocol automation, MCP, and CI/CD integration to catch performance issues before production.