Meaningful UX performance metrics and how to improve them
(gentle music) - Now, we're going to do a few things.
So, I'm standing here between you and our, our happy hour, our beers that we're going to have later on. So, I'm going to make you sing for your supper, a little bit later.
Okay, so as John said, I'm Mark, I'm from SpeedCurve. Our, sort of, focus is on front-end monitoring, and from a user perspective.
And so, often I'm asked about these guys.
You know, there are so many metrics that we have that try and represent performance.
The questions we get are, what do we do with all these? How do we pick the right metric? What do they even mean, and how do we bring some meaning to them? So today, I'm going to try and unpick what some of these metrics mean.
We are going to walk through a process, and try and identify what the most meaningful metrics are. And, I say meaningful because it's a pretty loaded term. So, we really need to ask ourselves, who are these metrics for? Who are they meaningful to? And, what is it that we really care about? And what is it that we really trying to represent with these metrics in the browser? So, there's literally dozens of them.
And, I really feel that the focus we need to bring to these metrics is what we're trying to represent with them. And literally, what are we trying to deliver? And, that is a really great user experience. That's our users that we should be trying to understand. And, we should be letting them guide us towards the most meaningful performance metrics. After all, it doesn't really matter what sort of service you're building, or what website you're building.
If you don't have users, and they don't care about your product, then you've kind of got nothing. Like, they are the people that decide whether you're going to be successful or not. So, too often, our users are having a really awful, a really slow experience.
We're in a niche in this room, we've all got the latest and greatest gear, we're all on fast devices on fast networks. Not really here in Australia, I must say.
(crowd laughs) We're doing a lot better in New Zealand, so. And, you know, when we think about those people, that are coming onto the web now, you know, there's been some great talks about the next billion or so people coming onto the internet, they're all coming through the developing world.
They're not buying iPhones, they're on pretty slow, kind of, hardware.
They're on, kind of, average Android device. And so, our infrastructure, and our hardware needs to be at the forefront of our mind, when we're thinking about performance, and measuring it for our users.
'Cause, after all, what they want is our great and awesome content.
And the value out of our services.
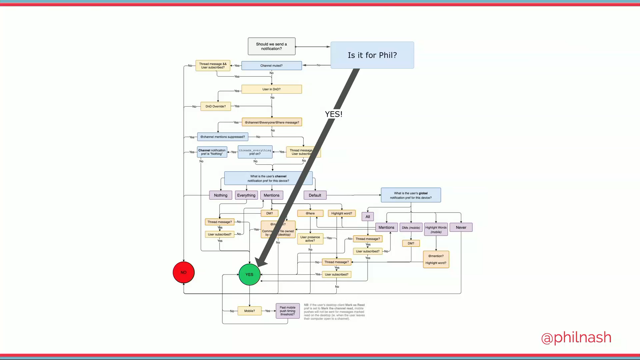
So, when we talk about meaningful metrics, I believe we need to focus our attention on the metrics that best represent that user experience. And, what is it that they're actually seeing, and what is it, that our users are actually experiencing. So with that user experience head-on, we can start to ask ourselves some key questions about those metrics.
What do we, what sort of attributes do we want our metrics to represent? We want to know when our users see content, you know, literally with their eyes.
Not only that, we want to know when they see the really important content. Not every pixel on screen has the same value. Ads, depending on who you talk to, maybe not as useful, as you know, the headline on a page. So, how do we differentiate those pixels in that content. And also, how are our users interacting with the page? Are they having a janky, and kind of laggy experience, or is it nice and smooth? So, as you can see, we've got some simple questions here, and ideally, there should be some really nice simple answers.
If only it was that simple.
So, while I love the back-end of the web, and I spend a lot of my time coding, and, you know, playing with the latest JavaScript frameworks, and all those sort of things. Image formats, you know, how much can we squeeze out of them.
Unfortunately, and it pains me to say this, at a conference like this, is that users just don't care about any of that shit, you know. They don't care about your code under the hood. They don't care what your stack is.
They're just trying to do something.
They're trying to buy that present for their mum, or, you know, they're trying to achieve a particular task. And, it's our job to provide the best possible user experience.
So, that's what our users care about.
And, there are plenty of really great, kind of, talks out there about the nuts and bolts of some of these detailed performance metrics. And, in particular, if you have watched some of the talks from Paul Irish, and Addy Osmani, those are great talks to look at if you really want to get into the nuts and bolts, and the details of some of those performance metrics. But rather than doing that today, what I want to try and do is to propose a much simpler way of evaluating each of these metrics. One that actually reflects what our users are doing on our sites every day.
And, that's using their eyes.
You know, can we use the visual nature of some these metrics to help pick those metrics themselves. So, how do we actually see what our users see, and relate that back to our performance metrics? And, to do that, there's only really one tool to use. And, that is good old WEBPAGETEST.
Can I just get a quick show of hands, how may people here use WEBPAGETEST? Good, good.
Every single person here should be putting their hand up. This is like the gold standard, open-source project for understanding user experience, and performance on the web.
Google User Research, they help fund the development of it. It's just, this is the gold standard that drives things like the http archive, and things like that.
So, If you don't know anything about WEBPAGETEST, you should make that a mission after this talk, to go and investigate it, and run it against your website. It really is the giant whose shoulders we stand upon. And, on a day to day basis, I often feel like this, you know, it's just, it's really, we've got to be, in terms of understanding user experience and performance.
And so, why is it that we spend so much time on a tool like this? And, I think, it's because of one really simple thing, and that's the filmstrip.
So, the beautiful thing about WEBPAGETEST is that it's sitting there like this neutral observer, and it's recording this screen at 30 frames per second, and just literally showing you what is happening in the browser.
And, it doesn't matter which browser it is, you know, you're not here to do any instrumentation inside that browser, it's just recording it. And, what this does is, it gives us that perspective of the user, and it allows us to see what they see.
And allows us to then kind of relate that back to all the events in the metrics that we have in the browser.
And so, it gives us that context so when we look at an interface like this, where we've got the filmstrip at the top, and along the bottom we've got the CPU main thread, and then in the middle, we've got our network, kind of, waterfall, and our key events and metrics that might be coming through from the browser. The thing that we are doing here is that we're trying to relate all this information, and these events back to what these people actually see in the filmstrip. And, that's the power of an interface like this. But, the thing that struck me is that often we're are using these sort of interfaces in one way.
We're looking at the events, we're looking at something like Start Render, and then we're correlating that back to the filmstrip.
And it struck me that, you know, could we invert this relationship, and flip it on its head.
So that, when we look at the frame in a particular filmstrip, can we flip that around, and do it the other way? What if I could focus in on just the H1, or the headline on the page.
And, If I could collect that, it tells me about what are the metrics that relate to the moment that that H1 actually rendered. You know, is it Last Painted Hero, is it Start Render, is it First Meaningful Paint? Maybe all three of those fired at around the same time that that headline became visible on the filmstrip. So, as John mentioned, I get to work with this clever chap every day Steve Souders. He is, sort of, considered the Godfather of the Perf community.
He wrote all the books on web performance.
He was Head of Performance at Yahoo! and Google. And, one of the things I enjoy the most about working with Steve, is that he expresses a lot of his thought process ideas through code. I love it.
I also find it incredibly frustrating because you can't get anything past him without the data to back it up.
And, I come from a creative background, I like to wing it sometimes.
And so, there is a lot of tension in our small four person company around data and creativity and exploring these ideas.
And so, when we talked about this idea of the filmstrip, and the events, and how they might relate them together, of course, Steve went away and whipped up a great, little, sort of, prototype interface that he called the Rendering Metrics Picker. And so, here's how this works.
We literally take a filmstrip, and we put it on screen for you, and then we ask you to pick the moment that you think that page is ready.
And ready is quite an interesting, and subjective thing.
Is it when the very first pixels render? Is it when you think, like, the main Hero content is ready, you know? Is it when the logo appears? Or, is it when everything is finished rendering in the browser.
So, there's an active interpretation here around, these kind of moments, and when you think it might be ready. And what you do in the Rendering Metrics Picker, is you pick one of these moments, and then a little bit like the example, you get to see what metrics actually relate back to that moment.
And in the Rendering Metrics Picker, there's 150 of the most popular websites with all these filmstrips, and you can go in, and click all the moments that you think it's ready, and then, it's, you kind of get a scoring of, like, which metrics relate most to what you find popular.
So, were going to do a few of these together as a crowd. And, we're going to use a really interesting technique that I read about recently.
This is a little bit of a tangent, but.
There's a really interesting kind of group, that currently developing TLS 1.3, you know, all the crypto, kind of, geeks.
And, they've got this really interesting technique, where, when they get together, and they vote, and they decide on things, they hum together. And, the reason they kind of hum, is that it's a little bit more, kind of, neutral, and like no one is having to put their hands up. You can actually escalate an issue.
If you do actually want to put your hand up. But, people just kind of hum because it's quite hard to tell, you know, whose humming, what direction it's coming from.
And so, were going to sing for our supper, and for our beer, and we're all going to hum together. So, I'm going to call out the numbers, you guys have a think about which moment you think relates the best to the user experience being ready.
And, I want you to hum for that moment.
Either softly or loudly depending on your opinion, just, you know, give it a go.
And, we're going to do four or five of these, so you've got a chance to warm up.
Okay, one, two, (crowd hums) three, four, (crowd hums) oh!, split crowd.
Definitely, two sounded a little bit louder to me. So now, we can see our metrics popping up.
This one correlates the strongest with your rendering times. Okay, one, two, three, (crowd hums) four, five.
Speed Index.
One, two, three, four, (crowd hums) oh! see, I disagree with you on that one.
(crowd laughter) I went for, like, the headline being rendered, so I went for three.
Okay, bit louder this time.
One, two, three, four, (crowd hums) five.
They sound great.
And here are our rendering times again.
One, two, (crowd hums) three, four, (crowd hums) five.
I find this one really interesting because you get this split bias between those people who are a bit more text orientated. And, everyone else that's just like, you didn't give me the images, that's all I care about, so. And, last one, I think, one, two, (crowd hums) three, four.
Speed Index again.
Well done, you guys definitely deserve a drink for that. (applause) Okay, so, when I went through the Rendering Metrics Picker, and looked at those top 150 websites, these were my results. This is the metrics that, kind of, won for me. I do want to stress that this is my interpretation with my sort of, you know, interpretation of when I think users will think that the page is ready. So, I'd really strongly encourage you to go to lab.speedcurve.com, and actually give it a crack yourself, 'cause it is really an interesting exercise because it's not the same for every filmstrip. And like we heard in the crowd, you do get these split opinions about, well, is this when it's ready, or is that when it's ready? I think that it really makes it interesting. And so, these top, kind of, three metrics capture about 70% of the moments that, in my opinion, kind of, correlated the strongest with those moments, that I believe, that the user actually cares about.
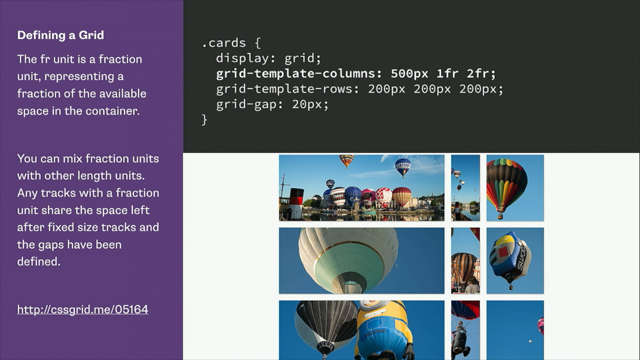
So, I'm going to use this to drive the rest of the presentation, and look at these top three metrics, and, sort of, do a little bit more analysis, and understand what they actually represent. So, the first one here, Hero Rendering Times, you probably haven't heard of much.
This is actually a unique, kind of metric that we've developed at SpeedCurve.
And, what we're doing is that we're actually using JavaScript to find the bounding box of an element. So, when the page is finished rendering, we use JavaScript to just identify the height, width, and the location of that bounding box. And then, we take that, and we do some analysis against the filmstrip.
So, on the right here, we've got the final frame from when the page was visually complete.
And, we've chopped out that element, and then we've walked through every frame in the filmstrip. On the left here, we've got, a frame, you know, the first one, it's usually white. And then we do an Image Diff.
Which tells us about how different those images are. So, we can see here, we've got a 99% difference. If we start walking through the filmstrip, we see the background colour change.
Still, no type 'cause we're waiting for the web font to load, but now it's a 24% difference.
And then finally, when we get to a moment, that the actual text renders, and we're doing an Image Diff, and it hits zero or around there, then we can, kind of, call it, and say this H1 rendered at 4.6 seconds.
This also illustrates some of the caveats with this technique.
We are just doing the analysis against the final frame, so if there was an image in the background rather than text, rather than the solid colour, then this number would represent the composite of that moment 'cause you'd need the image, and the text to be fully rendered to get that moment in time.
But, the thing that's really nice about this technique is that like our users, and like we just did as a group, people are drawn to the, you know, the H1, and the biggest image on the page, and the biggest background image.
So, those are the elements that we look at by default. We do also support element timing.
And, this is still in a draught spec at the moment, that's being worked on by the Google team.
I believe we're the only people that support this attribute, but if you add this attribute to any kind of element on your page, and run it through SpeedCurve, and WEBPAGETEST, then you'll actually get the rendering time just for that particular element. So, by default, we're looking at the H1, but maybe there's like a smaller, you know, add to cart, kind of button, or, you know, other elements on the page that you think are really important, and you want to know when did those render, then you can add this simple attribute, and that will get picked up. It is still draught, but this is the proposed element timing spec, so when Chrome finally adds this, you 'll probably instrumentation out of Chrome for the same attribute, so it is worth adding. And, at a conference recently, Paul Irish liked this technique so much that he coined this term for us, called Last Painted Hero, where he, you know, liked that we were looking at different elements on the page, but he thought we could collapse it down into one metric, which he called Last Painted Hero, which we like, so we've, kind of, added that as well. And, all we're doing here, is we're looking at all the Hero elements that we've identified on the page, and we're telling you the max time for when the final one of those rendered. And as you can see here that would be a really nice kind of metric to track for the Guardian, where you want to know, when is that headline, and the web fonts, and that key Hero Image, when are those finished rendering.
And so, that would be your Last Painted Hero time. I'm also really happy to announce that we've pushed all this code back into WEBPAGETEST. It's just going through a final review now. So any day now, if you use WEBPAGETEST, or you use any other tools that are based on WEBPAGETEST, you'll also be able to get the Hero rendering times, and things like Last Painted Hero in any of those open source tools as well.
So, that's really nice to be able to contribute that back. Speed Index was the second metric that showed up. This one can be a little bit hard to explain so, kind of, bear with me.
But basically, what we're doing here is we are looking at the visuals, and how they render over time.
And, what WEBPAGETEST does is give us a percentage of how quickly those pixels rendered in the viewport on the journey from nothing being rendered, or 0%, through to the right-hand side here. And, you can see in the percentages that that sort of captures the journey of these pixels that are being rendered.
And the top one, we get most of the page quite quickly, so it jumps to 93%, whereas at the bottom, we just get the NAV, and it just kind of hangs around for a while. Where this gets interesting is when you plot this over time on a graph.
And so, you can see here, even those both of these pages were visually complete at the same time, the journey of how those pixels rendered are, for one version versus the other, is quite different. And so, Speed Index, as a metric, is really looking at that journey, and it's actually a calculation of the sort of volume of time that is sitting above the curve here. And so, it's not a literal event that got fired in the browser.
Another way of describing it, as Pat, who wrote the algorithm, describes it, like this, which I quite like, which is, it's the average time at which visible parts of the page are displayed. So, it's not a single event, but it is a time based metric that tells you about the average time that things are rendered.
The next one is First Interactive.
Hopefully, you've been hearing quite a lot about First Interactive recently.
Certainly, the Google team and Lighthouse.
How many people are using Lighthouse to order their sights? Okay, good.
Again, all of you should be using something like Lighthouse. But, they're really, really pushing First Interactive, and I think, this is for really good reason. We've certainly seen, I think, in the last, kind of, three of four years, a huge shift in where the problems in web performance come from. Traditionally, we've been really focused on the network. How many requests? How big are those requests? Are you concatenating them, and minifying them, and putting them all altogether.
And, you know, our focus has really been on the waterfall network chart.
Instead, what we are seeing is a real growing problem with JavaScript.
And, it's basically you guys that are screwing it all up for us.
(crowd laughs) 'Cause I'm like you, I love a good framework, and it makes our lives easier, right, but the thing were not necessarily cognizant of is the cost of that.
And so, when we move a lot of our Logic, and our routing, and all that good stuff over into the client, we're not spending enough time thinking about what that actually means for those devices.
When we're on our latest, kind of, hardware, we don't quite notice it, it just, kind of, kicks straight in, and away you go.
But, there is real, real cost, and it's been really interesting to hear some larger companies talk about this. Netflix, recently, talked quite a lot about their transition to React, and the performance problems they had with it. They did a like for like transition of their native player from just plain JavaScript to React. And, they saw a big impact on performance.
And, it had a noticeable effect on user experience to the point where they had to kind of pull it from certain parts of their site, and they had to do a lot of work to improve the performance. They got there in the end, but it's a non-trivial process. So, I think we need to be really, really careful with the way that we just dive all in, kind of, boots and all into things like React, and Vue, and Angular, and all that stuff.
They're great from a developer convenience. They kind of suck from a user experience point of view. And, I don't know about you, but when I browse the web, I don't land on a website and go, Wahoo!, that was definitely done in React, like, you know, (crowd laughs) It's not like you can see it.
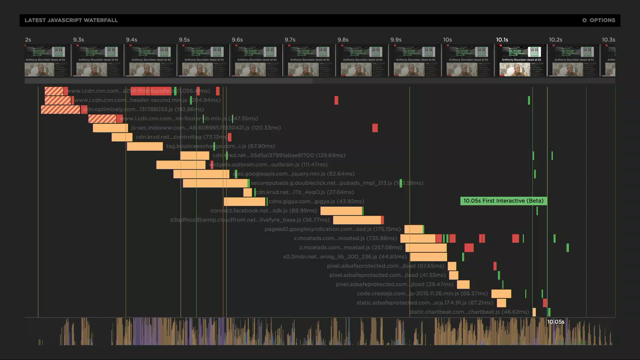
It's not like, oh! hang on, now I'm on a view site. It's like, you know, I'm just a user trying to do my stuff. And so, we need to be really careful about that. So, so, what we're looking at here is actually a new JavaScript focus waterfall that we've put to you to try and highlight this problem. And, I think it's only now that we're starting to see some of the tooling come around to highlight these issues with JavaScript.
So, let me just explain what you're looking at here. So, along the top you've got the filmstrip. Along the bottom, you've got the CPU main thread. And then in the middle, you've got what looks like a waterfall chart, but we've focused it down just to JavaScript. So, the yellow bars here are the network request, when JavaScript actually was downloaded off the network, when that network request finished.
And, then we can see the actual activity of that JavaScript.
So, you know, when was it actually executed. When do those functions get called? And here, we've focused it down, so green is any activity that's over five milliseconds for a function.
Anything over fifteen milliseconds is painted in red. And, the reason we use fifteen milliseconds is that that's a good guideline in terms of delaying user experience.
If we're trying to hit a button, and it takes longer than fifteen milliseconds to respond, then that's, you know, you can start to notice that, so that's leading to poor user experience. So, we're highlighting any of that.
And, the thing that always interests me, and I didn't really realise this until, you know, quite recently, I still think there's quite a perception that when JavaScript finishes downloading off the wire, that that's when it executes, and it does all its work. And, it's really fascinating to look at a chart like this, and see that fourth request down. It's doing a lot of work, and here at like six seconds into the page, so it's giving you quite a different perspective on when work actually happens. And then in green here, we have our metric First Interactive.
And so, as a metric, what it's doing is it's just waiting for the CPU to calm down. And, it's waiting for all that CPU thrashing to kind of finish.
So, any event that takes longer than fifteen milliseconds, a function call pushes out First Interactive further and further along your timeline.
So, it's a really good metric to try and capture the problems that you might be having with CPU, and how that's affecting user experience.
Because, while that Thrashing is going on, that's when you're, you quite often notice on some mobile, like you'll have a page that's rendered, and you're like, right, cool, now I can start interacting with it.
And, you start meshing the screen, and pushing buttons, and, just like, nothing's going on.
That's because of all the, you know, the CPU is, kind of, blocking the main thread. And, the thing that's scary to me, if we look at a different example here, is just who might be thrashing your CPU? And so, in this example, you know, we see our Stripey, kind of, blocking our JavaScript requests, and then we see some scary long kind of tasks at the top there. But, the thing that really interests me is down this bottom right corner.
And, when you look at these requests, these are ad pixels, these are like re-targeting JavaScript bits and pieces that are getting sucked into your pages.
For a while now, we've said that, okay, well, those third parties, they're are a necessary evil. As long as they are not getting in the way of the user experience, we can download, and we hit onload, we can just fire off all those nasty pixels, and in the background, they'll just quietly execute, and we don't have to worry about them.
This starts to paint quite a different picture of that. If your ads, and your tracking pixels are firing JavaScript, and they're doing things, like, you know, an ad wants to know, is it in the viewport. It's going to run JavaScript to try and find that out. But, you know, these ads are pushing out First Interactive, and so, what fascinates me here is, that when you look at this page, way back, kind of, when at the beginning, at, you know, four or five seconds in, you actually had a fully rendered page, and it looked like I could interact with it, but yet these ad pixels came in, still started thrashing the CPU like we've almost got more CPU thrashing, back here with the ads than we did even just painting the original page.
And, that's pushed our First Interactive metric right out to ten seconds.
So, this is a hugely important new metric.
In Lighthouse recently, they just changed the prioritisation of all the metrics to calculate a score, and they really shifted the weighting towards First Interactive, so this was now one of the key, kind of, metrics, that Google and Lighthouse, are looking at. And, they've also said that those, sort of, performance scores are going to start affecting things like search engine results, and search engine rankings. So, this is something that we all need, to kind of, care about, and you know, especially on those slower, older devices, the kind of average devices that are coming through in the developing world.
There's another couple of new metrics that I'll just put a quick plug in for here, and that's First Input Delay, which is measuring the first time that the user taps on the screen, or clicks an element.
How long did it take the page to respond? And, if it takes a long time to respond, then you know your users are actually suffering from JavaScript performance issues.
And there's also a great new Long Tasks API. It's a little bit high level at the moment for my liking, so it tells you about the overall time that you're page is taking longer than those fifteen millisecond chunks. So, you get a number back like, hey, we spent two seconds above that fifteen millisecond threshold.
The problem I have with it at the moment is, and this is for security reasons, there's no real attribution, so that thrashing that's happening on the page, you don't know, like, which domain it is, or which script.
I think there is some discussion around adding those attributes, which would make it way more useful.
And, the thing that's nice about these sorts of metrics is that they're coming out of the browser, so you can click them in RUM, or Real User Monitoring. We do that in LUX, and there's other tools like Akamai mPulse, so you can find out in the wild, what sort of JavaScript issues actual users are collecting, are having.
Now, for a talk about meaningful metrics, it would be odd not to mention these new ones from Chrome. Especially things like First Meaningful Paint. They sounded so promising, and yet, for some reason, they didn't really feature highly when we did our filmstrip comparison.
And so, we were really curious as to what's going on here. And, I think the simplest way to describe it is that, I like to think of it as the inside out problem. Chrome is in an environment, when it fires an event it doesn't really know what happens after that, so when is sends pixels to the screen, those pixels still have to travel, you know, through the GPU, they still have to travel through the OS before they actually get rendered to the screen.
And so, this is causing a delay, where Chrome can go, hey, we've seen pixels, lets fire First Meaningful Paint, we're done. But, there can be delays before that actually gets all the way through the pipeline.
And so, when we looked at our filmstrips we often found that those metrics coming out of Chrome were close ish.
And, our metrics, that were based on that visual analysis, were much more closer. And, they're not bad, but we did see them being on average a hundred to two hundred milliseconds off. In some cases, we saw them being, you know, three or four seconds off for some tests.
So again, this is why I love WEBPAGETEST so much. It's that neutral observer that's just recording video independently, and just showing you, hey, here's what's happening on screen.
These new metrics from Chrome, I think are worth keeping an eye on, and the new Paint Timing spec.
I was really disappointed to see that First Meaningful Paint didn't make it into the Paint Timing spec.
I don't know why, it's probably a little bit too Chrome specific, but that was a real shame. The reason that they're worth keeping an eye on is, again, we can collect them in the real world using RUM, and get a real good idea of our, of our, across our whole population of users, what a metric looks like.
So I think, the thing we've learned from this process can be best summed up by Steve, and that's that any performance metric that values all the content the same is not a good metric. And, this is why we saw Last Painted Hero perform the best when comparing the metrics to what our users actually saw because those users are focused on those Hero elements just like that metric is. So, when we think about it from the developer perspective, we also have some things that we want to focus on, how do we implement these.
So, we've got this one around, you know, we want to make sure that it picks up pixels, and things like that are not all treated the same. We want to be able to prioritise the content that we care about, and measure that.
I'm pretty lazy, I also want to, you know, how hard is it to implement these metrics? You know, do I get it automatically from the browsers, or from various, kind of, monitoring tools, or do I have to do a whole lot of work to actually implement it? And then also, one that I think that's really important, is understanding the difference between synthetic metrics that come out of a more cleanroom lab environment, and then our Real User Monitoring, our RUM, you know, is this a metric that I can get across my whole population of users, and compare those against each other, so how much can I trust this metric? How does it actually represent what we see in the real world? And so, when we try and chart those, these metrics that we've been looking at, and put them on a bit of a quadrant, down the side here, we've got at the top, does it measure those important pixels? Does it give focus, or is it just treating everything the same? How much work does it require, or do we get it automatically? And, I found it really fascinating, how most of the metrics that we have today, just treat everything on the page the same. And I think, again, for me, this talks to the bias of these metrics.
Metrics are often developed by the browser vendors themselves.
And so, they care about the internals of the browser, about what's going on.
I care about the users.
I want to see, you know, what the users see. So, a lot of those are, kind of, lumped down there in that quadrant.
Unfortunately, I had to put First Meaningful Paint down there.
I was really surprised to see that First Meaningful Paint doesn't actually take into account images.
And it's like, well, it makes it even less meaningful if it's not even looking at images that are being rendered in the browser.
It's just looking at the layout nodes, and trying to interpret that as a moment that things are meaningful.
So, there's still work to be done there.
Last Painted Hero was coming out good here, where we get it automatically.
We can do some work with that element timing, and tune it even more to our particular situation, and it does measure those important pixels. And, User Timing, which I will talk more about in a moment is also a really interesting metric, where it does require that work to implement it. It is a standard, so if you do implement it, you get the benefit of it across all your, kind of, browser tooling, which is fantastic. So, what do I recommend? Obviously Last Painted Hero.
I think that this is going to be the go to metric, going forward, in terms of representing the user experience, and really trying to understand that. You get it automatically, if focuses on those elements that users are looking at as well.
And, you know, it's just a good all-around kind of metric. First Interactive, those growing issues that we see with CPU, it's going to be a great metric to capture that.
Lighthouse is really prioritising it as well, so we know that it's important from the Google world view, and the search engine rankings as well.
Third here, we did have Speed Index, I still really like Speed Index, but I've swapped this out for Start Render. The reason that I like Start Render a bit more here is that it tells you about the critical rendering path in the browser. So, it tells you what's blocking me from actually rendering things.
And so, that to me makes it a little bit more important. And then, as I was just mentioning, User Timing, I think, is a fantastic metric for a number of reasons.
There's some really good examples around.
So, Twitter has written quite a few articles about the way that they decide what metrics to monitor in their organisation.
And so, they came up with a metric called Time to First Tweet, which is really delightful. Pinterest have done the same thing.
They have a Time to First Pin.
And so, if you think about the experiences that you're building, quite often there's a moment, that, you know, you think everything is there, all the Hero content is on screen, you can then use User Timing to fire a mark at that point, and that will show up in Chrome Dev Tools Webpage Chest.
Basically, all your monitoring tools support User Timing. And, that's really, really important.
One of the things that I like the most about that is that it facilitates the conversations across your organisation.
So, when you're having to talk to the design team, and the management teams, having a nice simple metric like Time to First Tweet, just makes that conversation so much simpler.
You're not having to explain what all these different metrics mean to people.
You're just going, hey, our Time to First Tweet is X, and everyone in the organisation is going to immediately understand what you're talking about. So, having a metric like that requires some work to implement it, but I think that can be invaluable in terms of building a performance culture in your organisation, and having everyone implicitly know what that means. So, we've picked some important perf metrics. How do we actually improve them, and make our experiences better? So, before I dive into some nuts and bolts, I want to talk a little bit more about a high level concept. And that is that I feel we need to transition away from this idea of pages.
I think pages, and this publishing mentality that we've brought to the web, have really slowed us down in a lot of ways.
It's my belief that the web is a time based medium. It's not a static publishing medium.
And, I think, unfortunately, people like me, you know, designers have not helped in this scenario. It's too easy for the creative teams, and the marketing teams to run away, design a beautiful Photoshop mock-up, that's rich and full of beautiful fonts, and images, and then chuck that over the fence to the development team, and go Wahoo! make it fast guys, and girls.
And, I think, that creates this tension between design and development that's a little bit of a false economy.
And, because we're thinking about as the static pages, and development language, we're just trying to race to this moment, where we've got this fully rendered page.
Instead, what we need to be doing is thinking about it as a time based experience, and really thinking about how we flow the content in and out of the browser experience.
So, lets, sort of, look at the order of events at some of these metrics, and really what's blocking them. So, Start Render is blocked by our blocking CSS, and JavaScript, and our Webfonts.
It's not how we normally how we have all of these that we can actually start rendering pixels on screen. So, some of the techniques we can use.
InLine Critical CSS.
Guys are all going to groan at me, when I say that 'cause you're like, it's too hard, I've got to re-architect everything, and it's just so fundamental, but it really is the thing that I believe we should all be focused on to achieve that flow into the browser.
I've got an example coming up for that.
JavaScript, just going to do a bit of job managing there. So, Async and Defer, and Lazy load, all your JavaScript. It's really important that you understand the difference between Async and Defer.
Async just still parses and executes that JavaScript as soon as it's downloaded.
Defer actually defers it till after the onload event, and the page has actually settled down, so just really think about that JavaScript, and when is it, that you need to be firing functions on the page.
And, think about that from that user perspective. I think Lazy loading JavaScript, based on user input, is really interesting as well.
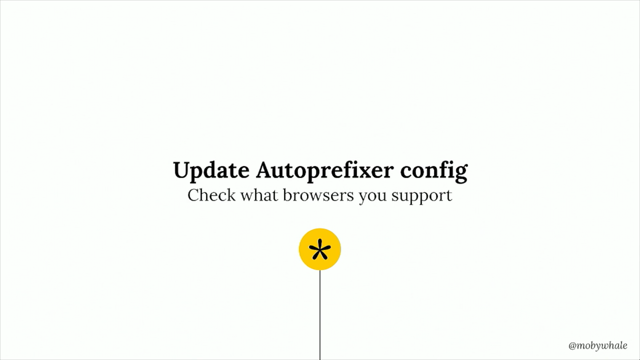
And then Webfonts, we've got the new display options for Webfonts, which are fantastic.
Personally, I like optional, which gives the browser permission to decide whether it's actually going to show that font or not. So, if it's a slow connection, it's just taking too long, it's going to say, you know what, sure, I'm going to keep downloading this but I'm not going to bug the user.
You know, once that font's downloaded, I'm not going to create that flash of unstyled text, and, kind of, swap it out.
On the next page load, it will be on the cache, then you can have your font.
So, you're kind of giving the browser, that knows a lot more about its content, the decision making process around what to do with that Webfont.
So, I think that's a great one.
I did want to just quickly hone in on one technique here, and that's this Critical Inline CSS. So, I've picked on the Nickelodeon site here, who have this, big kind of, rich experience. And, what I did, is I just created a very, very simple, you know, what we call a skeleton screen.
Has some colours, has a logo, has some blocks that tell me content's coming.
The thing that I find interesting about this is that it's all done in one request.
And so, the idea here is to do it in one request, you keep it under 14k.
If you haven't seen it, Ilya Grigorik has done a great talk about getting pages to render on mobile in under a second.
And so, that's where this principle came from, where you don't have any choice, it's got to be in the first request, and it's got to be under 14k.
But as a designer, if you say to me, hey, you can have 14k of Inline CSS, Svgs is like data URIs, and I'm like Wahoo! party time, like that is a lot of room.
And so, the point here is not try and Inline your entire experience, but just give people that first experience, and it can make an absolutely massive difference.
This is the same website on the same conditions. At eight seconds here, I gave up.
It wasn't even fully rendered, like it still kept going. But, when I did my skeleton screen, and it's one request, and it's not waiting on all those dependencies, then it renders it in half a second.
And so, my challenge to you would be to think about how you flow that content in, create these skeleton screens, and really we should all be setting ourselves the challenge of rendering in the browser, on mobile under a second, and on desktop, I would aim for under half a second. And, I guarantee you if most of you go and test your websites after this using WEBPAGETEST, you're probably going to be a lot closer to the eight second than you are to the half second. And so, that's your challenge.
Last Painted Hero, again it's blocked by all the phones. Images, pre-features is really important to try lift those Hero images up in the rendering order, and the download order, and you can do image optimization as well.
First Interactive, again, you can see how critical blocking, CSS, and JavaScript here is. Basically, it just blocks all our metrics.
So, those are the most important things to be working on. And again, our Long Task's over 15 millisecond, so breaking our JavaScript up into smaller and smaller chunks, and there was a great talk earlier today with, you know, some of the techniques to do that.
So, those are great.
So, to wrap up.
I've tried to distil this down to some principles for you, for how to think about how you measure user experience, and what might metrics you might use to capture that. So, for me, the first one is really about using that first request to tell people that they are in the right place.
Here's a logo, here's some colour.
Yay! you've arrived, and you can measure that with Start Render because it tells you about when those pixels start to change on screen. Then we want to deliver the most important, and visible content first.
After all, that's what our users came here for, and we can measure that now really easily with things like Last Painted Hero.
Then, we want to slowly layer in our functionality. And, we want to do that without blocking the user interaction.
And so, we can measure that with First Interactive. Then, as a team, we want to decide what is the moment that matters the most in our user experience.
And, we want to measure that with User Timing. And, the benefit of that is that we get it from Synthetic, and from RUM, so, that can be a really rich source of insight into what the user experience is like. So, finally, I just want you to, kind of, you know, remember that we are all working in service of our users. We want to use these metrics to try and get as close as we can to that experience that people are having.
And, try and understand whether it's fast or slow. So, lets hope, that while we're adding more content, and more JavaScript to our sites that we're also making those websites faster, and not slower, and that we're making it way more joyous to use.
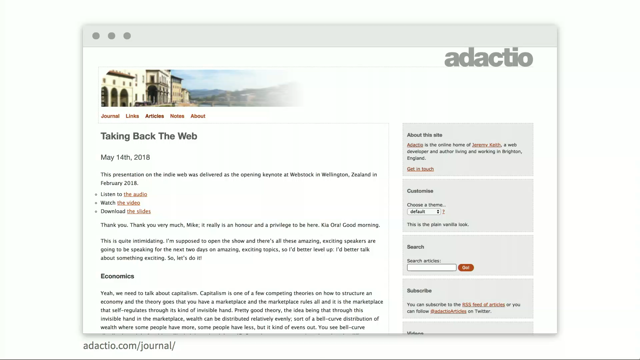
If you're interested in any of this content, on our blog, we basically publish all the research that we're doing, and a lot of the research behind the talk today.
So, you'll find the Rendering Metrics Picker, and all sorts of other great techniques especially around User Timing as well.
So, if you're interested in this stuff, I'd recommend you go and check out our blog. Great, and speaking of joyous, I think it's time to partake, is it not John? - [John] I think it is.
- Thank you.
(crowd applauds) (gentle music.)
Users don’t care how your website is built, what backend you’re running, or if you’re using the coolest JavaScript framework on the block. They only care about content. That content has to be meaningful, and it has to be rendered in the browser lightning fast, or you’ve lost them.
Performance metrics are critical for understanding the impact of our work as web developers on improving our user experience and making it a joy to use. But not all performance metrics do a great job of representing what our users actual see and experience. Network metrics have been around for decades, but rendering metrics are newer, and they’re doing a better job of capturing the moment critical content is visible.
Mark Zeman offers an overview of available rendering metrics, including newcomers like Time to Interactive and Time to First Meaningful Paint, and helps you pick the right metrics to focus on for your website and your users. Along the way, Mark outlines several techniques for improving the rendering experience of your websites, including delivering your brand in the first request, building a skeleton screen of elements, image SVG placeholders, and progressing rendering. You’ll leave armed with performance metrics and rendering techniques that will help you best improve your user experience.